Is Fed Chair Powell Actually Cap’n (Credit) Crunch? US Money Supply Has Shrunk For Eight Months In A Row As Bank Credit Slows To -0.2% YoY

I don’t know whether Cap’n (Credit) Crunch is Fed Chair Powell or the big spender Boss (Tweed) Biden?

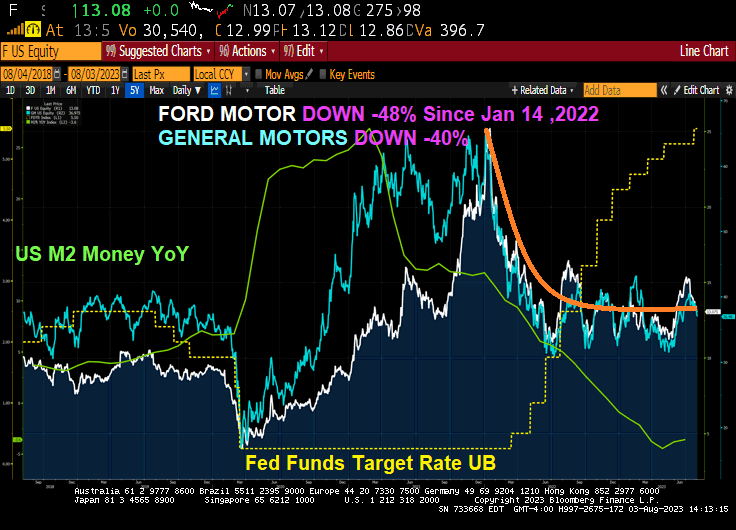
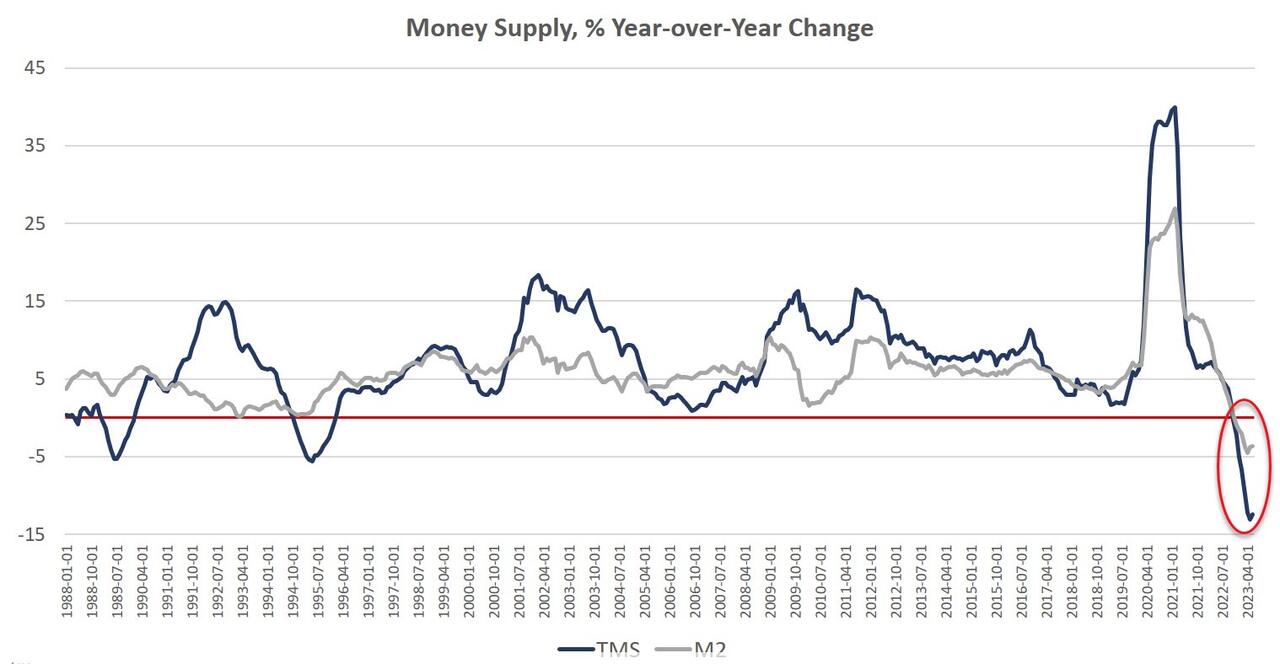
Money supply growth fell again in June, remaining deep in negative territory after turning negative in November 2022 for the first time in twenty-eight years. June’s drop continues a steep downward trend from the unprecedented highs experienced during much of the past two years.

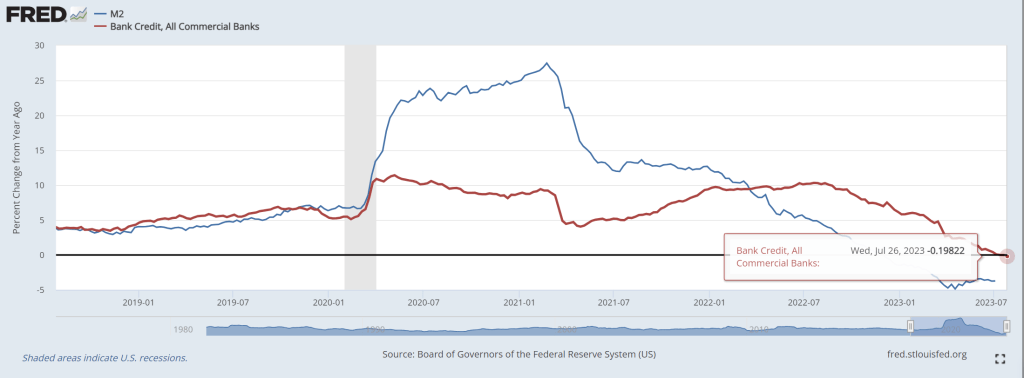
And with M2 Money growth down for 8 consecutive months, bank credit down -0.2% YoY.

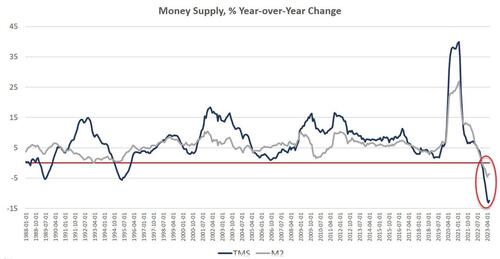
Since April 2021, money supply growth has slowed quickly, and since November, we’ve been seeing the money supply repeatedly contract—year-over-year— for six months in a row. The last time the year-over-year (YOY) change in the money supply slipped into negative territory was in November 1994. At that time, negative growth continued for fifteen months, finally turning positive again in January 1996. 

Money-supply growth has now been negative for eight months. During June 2023, the downturn continued as YOY growth in the money supply was at –12.4 percent. That’s up slightly from May’s rate of –13.1 percent, and was far below June’s 2022’s rate of 5.7 percent. With negative growth now falling near or below –10 percent for the third month in a row, money-supply contraction is the largest we’ve seen since the Great Depression. Prior to March through June of this year, at no other point for at least sixty years has the money supply fallen by more than 6 percent (YoY) in any month. 

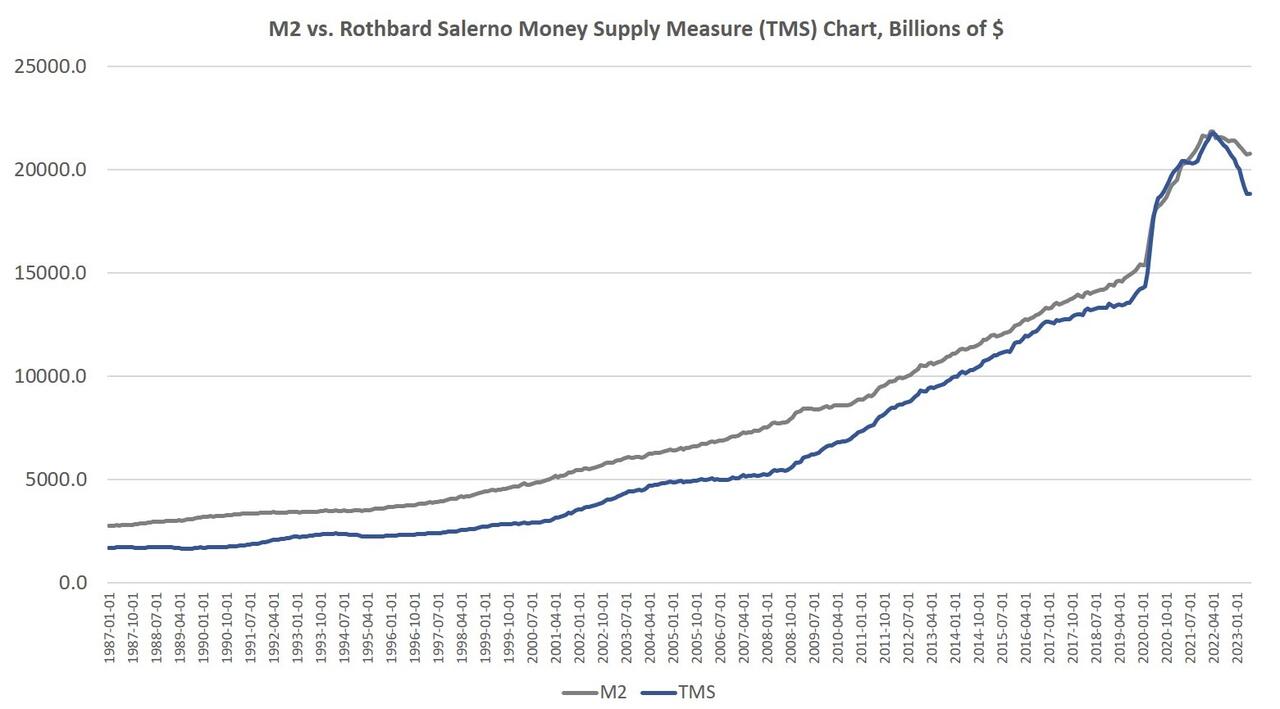
The money supply metric used here—the “true,” or Rothbard-Salerno, money supply measure (TMS)—is the metric developed by Murray Rothbard and Joseph Salerno, and is designed to provide a better measure of money supply fluctuations than M2.

The Mises Institute now offers regular updates on this metric and its growth. This measure of the money supply differs from M2 in that it includes Treasury deposits at the Fed (and excludes short-time deposits and retail money funds).

In recent months, M2 growth rates have followed a similar course to TMS growth rates, although TMS has fallen faster than M2. In June 2023, the M2 growth rate was –3.5 percent. That’s slightly up from May’s growth rate of –3.7 percent. June 2023’s growth rate was also well down from June 2022’s rate of 5.6 percent. 

Money supply growth can often be a helpful measure of economic activity and an indicator of coming recessions. During periods of economic boom, money supply tends to grow quickly as commercial banks make more loans. Recessions, on the other hand, tend to be preceded by slowing rates of money supply growth. 

It should be noted that the money supply does not need to actually contract to signal a recession and the boom-bust cycle. As shown by Ludwig von Mises, recessions are often preceded by a mere slowing in money supply growth. But the drop into negative territory we’ve seen in recent months does help illustrate just how far and how rapidly money supply growth has fallen. That is generally a red flag for economic growth and employment.

The fact that the money supply is shrinking at all is so remarkable because the money supply almost never gets smaller. The money supply has now fallen by $2.8 trillion (or 15.0 percent) since the peak in April 2022. Proportionally, the drop in money supply since 2022 is the largest fall we’ve seen since the Depression. (Rothbard estimates that in the lead up to the Great Depression, the money supply fell by 12 percent from its peak of $73 billion in mid-1929 to $64 billion at the end of 1932.)

In spite of this recent drop in total money supply, the trend in money-supply remains well above what existed during the twenty-year period from 1989 to 2009. To return to this trend, the money supply would have to drop at least another $4 trillion or so—or 22 percent—down to a total below $15 trillion. 

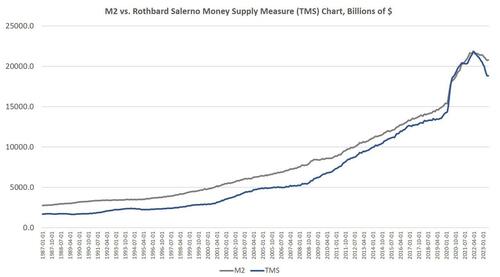
Since 2009, the TMS money supply is now up by nearly 184 percent. (M2 has grown by 146 percent in that period.) Out of the current money supply of $18.8 trillion, $4.5 trillion of that has been created since January 2020—or 24 percent. Since 2009, $12.2 trillion of the current money supply has been created. In other words, nearly two-thirds of the money supply have been created over the past thirteen years. 

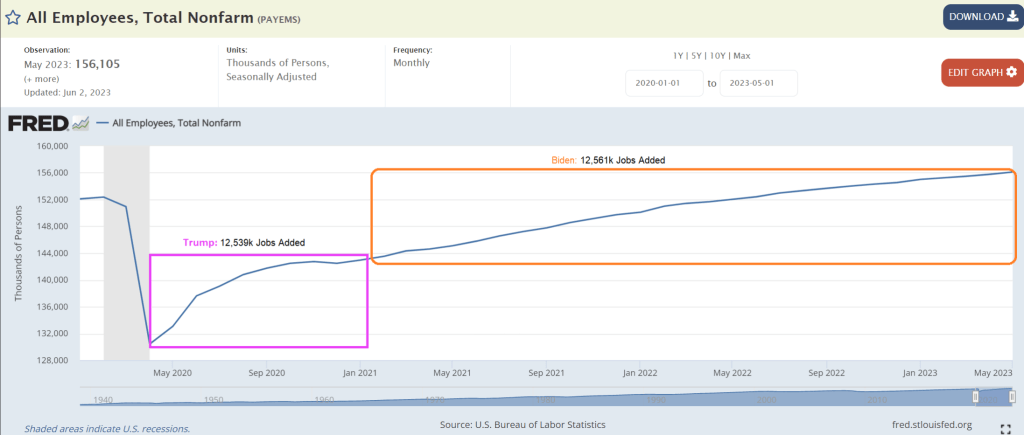
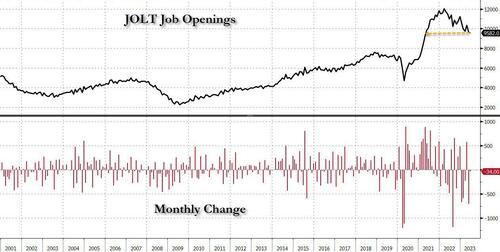
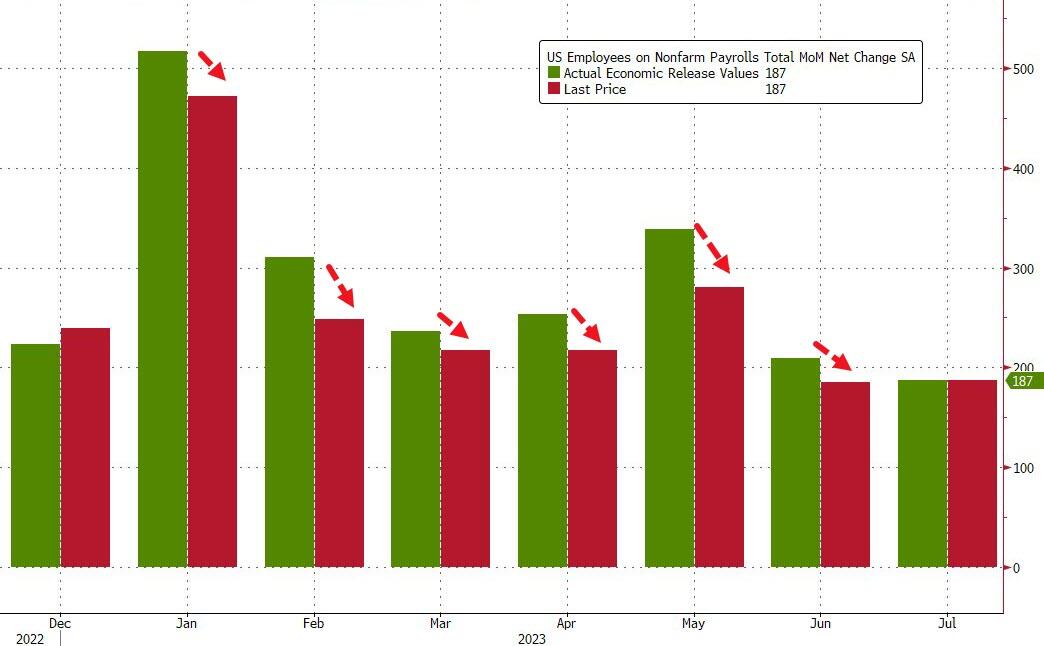
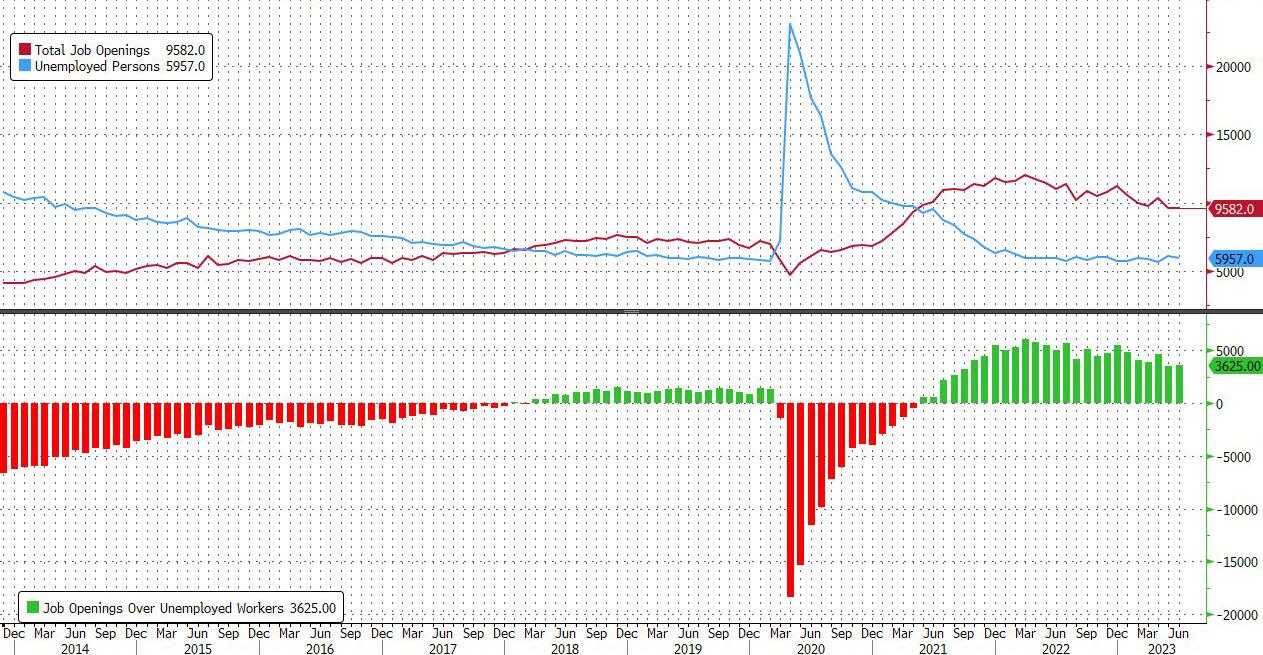
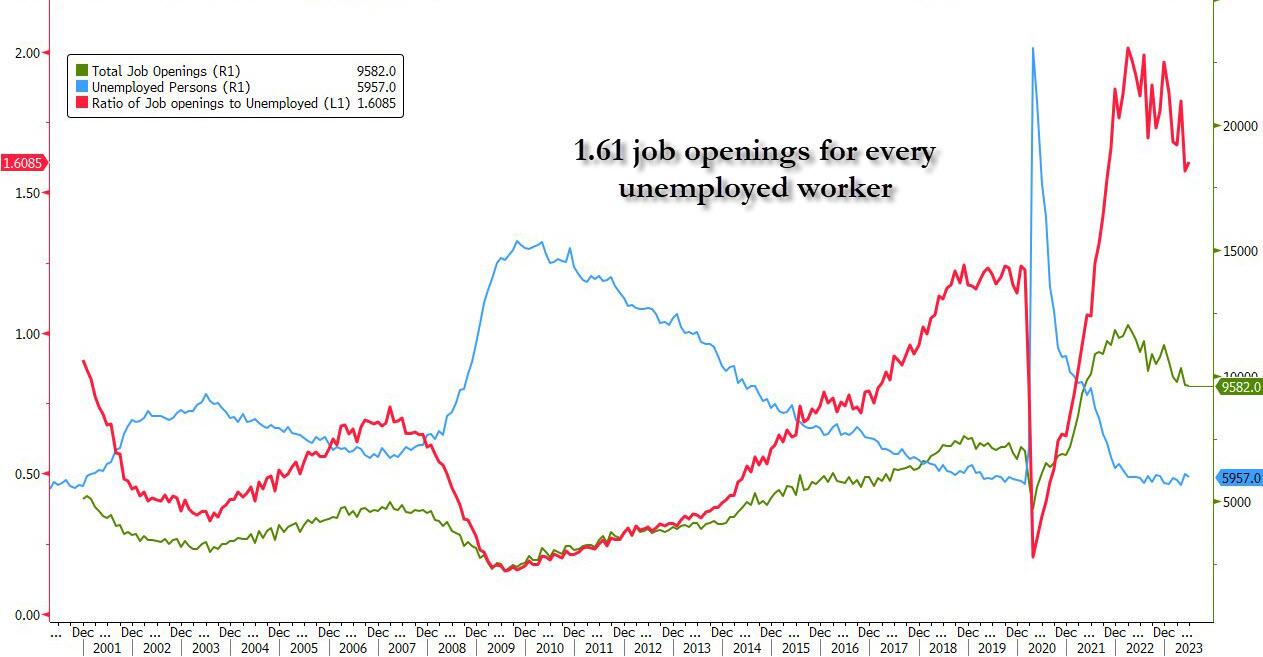
With these kinds of totals, a ten-percent drop only puts a small dent in the huge edifice of newly created money. The US economy still faces a very large monetary overhang from the past several years, and this is partly why after fourteen months of slowing money-supply growth, we are not yet seeing a sizable slowdown in the labor market.

Nonetheless, the monetary slowdown has been sufficient to considerably weaken the economy. The Philadelphia Fed’s manufacturing index is in recession territory. The Empire State Manufacturing Survey is, too. The Leading Indicators index keeps looking worse. The yield curve points to recession. Individual bankruptcy filings were up 68 percent in the first half of the year. Temp jobs were down, year-over-year, which often indicates approaching recession. 

Money Supply and Rising Interest Rates

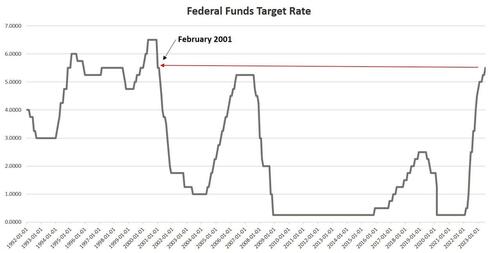
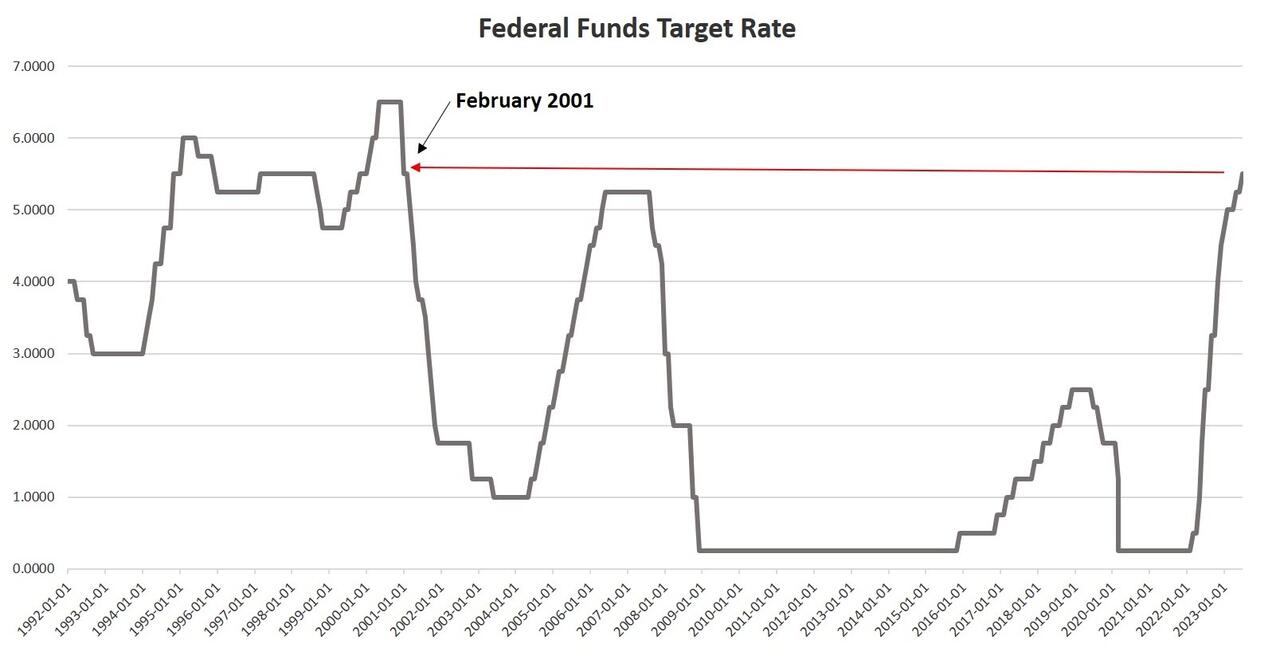
An inflationary boom begins to turn to bust once new injections of money subside, and we are seeing this now. Not surprisingly, the current signs of malaise come after the Federal Reserve finally pulled its foot slightly off the money-creation accelerator after more than a decade of quantitative easing, financial repression, and a general devotion to easy money. As of July, the Fed has allowed the federal funds rate to rise to 5.50 percent, the highest since 2001. This has meant short-term interest rates overall have risen as well. In June, for example, the yield on 3-month Treasurys remains near the highest level measured in more than 20 years. 

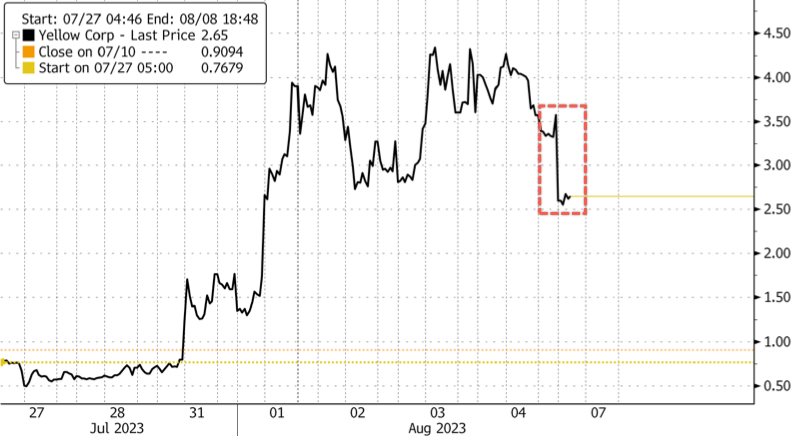
Without ongoing access to easy money at near-zero rates, however, banks are less enthusiastic about making loans, and many marginal companies will no longer be able to stave off financial trouble by refinancing or taking out new loans. For example, Yellow Corporation, a trucking company, has declared bankruptcy and will lay off 30,000 workers. Tyson Foods announced this week it is closing four chicken processing plants in an effort to cut costs. 3,000 workers are likely to lose their jobs as a result. These firms have experienced financial problems for years, but rising interest rates preclude additional delays of the inevitable. We will see more of this as more companies face the realities of higher rates. (In another sure sign of a slowing economy, state and local tax revenues have been falling.) 

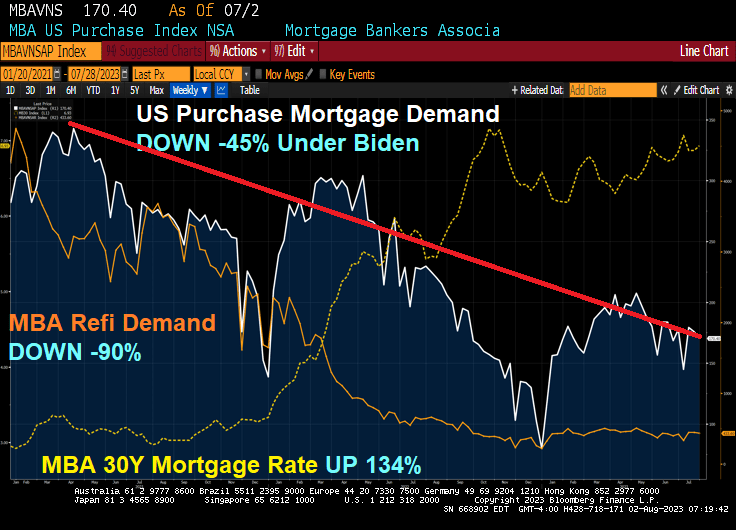
Meanwhile, as lenders get spooked by tightening cash availability, it’s getting more difficult to qualify for a home loan, and credit availability is the tightest its been in a decade. Meanwhile, the average 30-year mortgage rate rose in July to nearly the highest point since 2002. 

One of the most troubling indicators is soaring credit card debt even as interest rates soar. As of May 2023, the commercial bank interest rate rose to the highest rate measured in at least 30 years. Just last year, the interest rate hovered around 15 percent. In May 2023, it reached over 20 percent. This is happening as credit card debt and other revolving loans have reached a new all-time high. 

These factors all point toward a bubble that is in the process of popping. The situation is unsustainable, yet the Fed cannot change course without reigniting a new surge in price inflation. Any surge in prices would be especially problematic given the rising cost of living.  Both new and used cars are becoming increasingly unaffordable. Ordinary Americans face a similar problem with homes. According to the Atlanta Fed, the housing affordability index is now the worst it’s been since 2006, in the midst of the Housing Bubble. 

If the Fed reverses course now, and embraces a new flood of new money, prices will only spiral upward. It didn’t have to be this way, but ordinary people are now paying the price for a decade of easy money cheered by Wall Street and the profligates in Washington. The only way to put the economy on a more stable long-term path is for the Fed to stop pumping new money into the economy. That means a falling money supply and popping economic bubbles. But it also lays the groundwork for a real economy—i.e., an economy not built on endless bubbles—built by saving and investment rather than spending made possible by artificially low interest rates and easy money. 

Either Powell is Cap’n (Credit) Crunch or Boss Biden because of his insane spending spree helping inflation hit 40 year high is Cap’n (Credit) Crunch.

While looking up baseball statistics, I found this picture of former Cincinnati Reds outfielder Wally Post. Or is that actor Nick Searcy from “Justified”?

Banks And CRE Turmoil Worsens As Office Delinquencies Accelerate (Delinquency Rate Rose To 4.41% Last Month, Office Rose To 4.96%)

Its not a wonderful world for regional and small banks given the deterioration of office markets.

The latest data from Trepp, which tracks commercial mortgage-backed securities (CMBS) securities market data, shows the delinquency rate of commercial property loans packaged up by Wall Street jumped again in July, with four of the five major property segments posting increases. 

“While the rest of the US economy has seen relief in terms of higher equity prices, better-than-expected corporate earnings, and falling inflation numbers, the commercial real estate (CRE) market continues to be left behind,” Trepp wrote in the report. 

Trepp data found the delinquency rate rose 51 basis points to 4.41% last month — the highest level since December 2021. Office delinquencies increased by 46 basis points to 4.96% — up more than 350 basis points since the end of 2022. The deterioration in the office segment is intensifying at an alarmingly rapid pace. 

A broad overview of the US CMBS market shows the delinquency rate increased to 4.41%, a 51bps rise compared to the previous month, but still significantly lower than the 10.34% rate recorded in July 2012. The rate peaked at 10.32% in June 2020 during the government-forced Covid lockdowns. 

Here are more highlights from the report:

  • Year over year, the overall US CMBS delinquency rate is up 135 basis points.
  • Year to date, the rate is up 137 basis points.
  • The percentage of loans that are seriously delinquent (60+ days delinquent, in foreclosure, REO, or non-performing balloons) is now 3.92%, up 20 basis points for the month.
  • If defeased loans were taken out of the equation, the overall headline delinquency rate would be 4.64%, up 51 basis points from June.
  • One year ago, the US CMBS delinquency rate was 3.06%.
  • Six months ago, the US CMBS delinquency rate was 2.94%.

To better understand what might come next for the CRE market, Kiran Raichura, Capital Economics’ deputy chief property economist, recently warned in a note to clients that the office segment might experience a 35% plunge in values by the second half 2025 and “is unlikely to be recovered even by 2040.” 

According to swipe data from Kastle Systems, the US office occupancy rate is less than 50%. The figure has plateaued since September, indicating a new reality of remote work. 

One major hurdle for CRE space is that “more than 50% of the $2.9 trillion in commercial mortgages will need to be renegotiated in the next 24 months when new lending rates are likely to be up by 350 to 450 basis points,” Lisa Shalett, chief investment officer for Morgan Stanley Wealth Management, wrote in a note to clients. 

Shalett expects a “peak-to-trough CRE price decline of as much as 40%, worse than in the Great Financial Crisis.” 

Bank of America analysts expect challenges in the CRE space but noted, “They are manageable and do not represent a systemic risk to the US economy.” 

Meanwhile, analysts at UBS warned: 

“About $1.3 billion of office mortgage loans are currently slated to mature over the next three years.

“It’s possible that some of these loans will need to be restructured, but the scope of the issue pales in comparison to the more than $2 trillion of bank equity capital. Office exposure for banks represents less than 5% of total loans and just 1.9% on average for large banks.” 

We’ve already seen major building owners returning their office towers and malls to lenders in California (here & here) and elsewhere (here). This will result in an uptick in CMBS delinquencies moving forward.  

… and remember what we wrote during the regional bank crisis earlier this year — the note was titled “Nowhere To Hide In CMBS”: CRE Nuke Goes Off With Small Banks Accounting For 70% Of Commercial Real Estate Loans. 

Meanwhile, The Federal Reserve is printing the night away.

Sam Cooke sang Joe Biden’s favorite song: “Only Sixteen.”

“So why did I give my heart so fast
It never will happen again
But I was a mere man of 80
I’ve aged a year since then.”


print-icon
print-icon

Bidenomics At Work! Yellow Files For Bankruptcy, Blames Union For “30,000 American Jobs lost”Bidenomics At Work!

Bidenomics at work! From the alleged more Pro-Union member of the US Senate and now El Presidente of the United Banana Republics of America.

One of the biggest bankruptcies in US trucking history occurred Sunday when the nation’s third-largest less-than-truckload carrier, Yellow Corp.filed Chapter 11 in a Deleware court. The company has fallen victim to insurmountable debts, including a government loan and tense contract negotiations with the Teamsters Union. It listed assets and liabilities at $1 billion-$10 billion, with more than 100,000 creditors. 

“It is with profound disappointment that Yellow announces that it is closing after nearly 100 years in business,” said Yellow CEO Darren Hawkins in a statement Sunday. 

Hawkins continued, “Today, it is not common for someone to work at one company for 20, 30, or even 40 years, yet many at Yellow did. For generations, Yellow provided hundreds of thousands of Americans with solid, good-paying jobs and fulfilling careers.”

Yellow’s bankruptcy marks the largest filing in US trucking history. The firm was responsible for roughly 15% of major corporations’ less than truckload. It has struggled with a sizeable debt load and changing consumer habits in a post-Covid environment. Yellow has $1 billion in debt due in 2024 alone and has struggled to find common ground with the Teamsters Union.

The Nashville-based company had 30,000 employees nationwide, with the union representing about 22,000 of those employees. Last week, the company notified its labor force about bankruptcy plans

Hawkins blamed the union for the company’s failure:

“We faced nine months of union intransigence, bullying and deliberately destructive tactics.” 

Yellow asked the Delaware court for permission to make payments, including employee wages and benefits, taxes, and certain vendors essential to its businesses. 

Much of Yellow’s business halted weeks ago when it stopped making pickups. It axed most non-union employees and closed its yards at the end of July

Stifel research director Bruce Chan said the demise of Yellow has been “two decades in the making,” blaming poor management and strategic decisions from the early 2000s. 

For the overall trucking industry, Amit Mehrotra with Deutsche Bank said the collapse of Yellow is “clearly very positive for the companies that remain open for business.” He listed Old Dominion, Saia, CSX, and FedEx among other top picks in the industry. 

Yellow shares trading in New York plunged more than 26% on the news. This followed a 781% surge from about 50 cents on July 27 to a high of $4.34 last Thursday. 

Bidenomics = missing free markets replaced by the massive Federal foot of idiotic policies.

“Pain Trade” Points To A Steeper US Yield Curve As Fed Remittances To US Treasury Soar (The Cost Of Bidenomics’s BIG Policies)

Yes, Bidenomics is an FDR-type massive expansion of government into the private sectors requiring massive Federal spending … and inflation. Except that it beenfits anything BIG and powerful to the detriment of the small and weak.

(Bloomberg) Friday’s jobs data sparked a relief rally in bonds and a flatter yield curve, but the pain trade is still for higher yields and a steeper curve – the lesser-spotted bear steepener – with this week’s CPI a potential catalyst.

Last week was a turbulent one for bonds, but the continued softening in payrolls data served to remind the market that supply and fiscal-profligacy fears have to be counter-balanced with an economy that’s in its late-cycle stages.

After the data, 10-year yields took the elevator back down to sub-4.05% after briefly going above 4.20%. They have since clambered back to 4.12%, but their next cue is likely to come from Thursday’s CPI report. Headline is expected to nudge back up to 3.3% (from 3% last month), mainly due to base effects, and core is expected to hold steady at 4.8%.

Still, stronger-than-expected data probably means higher yields in a market more acutely alert to inflation (and therefore supply) risks. As with last week, term premium would likely drive the move, meaning a curve steepening. After relentlessly flattening for the last two years, the pain trade is for a steeper curve. Implicit positioning of speculators from the COT report shows there is a heavy skew to a flatter curve.

The negative carry for most flatteners remains punitive (for 2s10s USTs it’s ~83bps over a year), but the large upside potential from supply/inflation worries and the covering of positions begins to make that look less insurmountable.

Finally, the Bundesbank’s decision to stop paying interest on domestic government deposits – which initially pushed short-term German bonds higher this morning – highlights the broader issue of central banks paying interest on reserves when they are superabundant.

In the days of QE and 0% interest rates, the ECB and Fed at al. remitted money to their treasuries from the income on their bond portfolios.

But now that is reversed as bond income is dwarfed by the cost of paying interest on trillions of bank reserves. Take the Fed, whose debt to the Treasury is now accruing at over $2 billion each week.

This is something that will become more politically contentious, especially as economies continue to slow and cost-of-living pressures bite further.

Bidenomics. The takeover of the US economy by BIG corporations, BIG labor unions, BIG tech, BIG pharma, BIG defense, BIG healthcare, BIG media, BIG banks, BIG tech, BIG … Well, anyting that is BIG and powerful that can buy influence in Congress and the Administration. Except BIG energy which lost out to BIG Progressive DC thinktanks.

Leading to BIG inflation!

But I feel good! Even though inflation expectations are soaring again as gasoline soars again.

Bidenomics Falsehood: Biden “Created” 400k Jobs Per Month While Trump Lost Jobs (Actually Trump Averaged 1.56 Million Jobs Added Post-Covid While Biden Averaged 400k)

“One of the most cowardly things ordinarily people do, Is to shut their eyes to facts.” – C.S. Lewis

Okay, we know Biden lies constantly and misrepresents facts (hey, he is a politician like Adam Schiff (D-CA). But this graphic praising Bidenomics with Biden having created the most jobs (average per month) since Carter (notice they left out Democrat darling Jimmy Carter!!!). In this absurd graphic, Biden wins by “creating” over 400k jobs per month while Trump lost jobs per month. Riveting … except that it is completely misleading.

Actually, the US economy added 12.53 million jobs after April 2020 (Trump) while Bidenomics created took 2 1/2 years to add 12.56 million jobs. So, Biden took over twice as long to create jobs after Covid than it did under Trump. Simply opening the economy and schools produced that magical claim by Biden. And the National Teacher’s Union and Randi Weingarten worked with Fauci to orchestrate shutting down schools. Blaming Trump for local governments shutting down the economy is pure bunk.

12.53 millions jobs added / 8 months = 1.56 million jobs average per month. Biden? 12.56 million jobs added / 30 months = .43 million jobs average per month. So, Trump averaged more than 3x the job growth post-Covid than Biden.

Here is the “glories of Bidenomics” from the White House. As Biden likes to say, pure malarkey!

I wonder if the Democrat Party is a rebirth of New York City’s Tammany Hall corrupt political movement of the 1800s? Is Biden Boss Tweed? Or is Obama Boss Tweed with Biden as his nasty, dimwitted henchman?

In 1871, Thomas Nast denounces Tammany as a ferocious tiger killing democracy. The image of a tiger was often used to represent the Tammany Hall political movement. Sounds an awful lot like today’s Democrat Party.

Perhaps a fez for Democrats?

US Gasoline Prices Surge Again 6.5% Since 7/23/2023 (Gas Prices UP 60% Under Bidenomics As Strategic Petroleum Reserve DOWN -46% Under Corrupt Joe)

Josef Stalin of the old Soviet Union used to be called County Joe. But Biden has so many possible nicknames: Corrupt Joe, Pay-for-play Joe, Sleazy Joe, Bully Joe, etc. How about Green Joe?

Green Joe (or the Nasty Green Giant?) along with his energy goon Jennifer Granholm, have drained the strategic petroleum reserve by 46% while gasoline prices have soared 60% under Bidenomics.

Gasoline prices have rise over 6.5% just since 7/23/2023.

Trump wants to drain the swamp, Biden/Granholm want to drain the strategic petroleum reserve so we can’t go back to fossil fuels. Biden and Granholm as Fossil Fools

Energy Secretary Jennifer “The Evil Pixie’ Granholm demostrating how she will refill the strategic petroleum reserve. Which she never will, of course.

July Jobs Report Disappoints! Only 187k Jobs Added, Wage Growth Of 4.4% Still Lower Than Core Inflation Rate Of 4.8%, Rent CPI (June) Is Still Roaring At 7.8% YoY (May and June Figures Revised Sharply Lower)

The Federal Reserve is watching July’s jobs report carefully. According to the Bureau of Labor Statistics (BLS), the US economy added 187k jobs in July, less than the expected 200k.

US average hourly earnings continued at 4.4% year-over-year (YoY). However, the last core inflation reading was 4.8% YoY, so real wages continue to decline.

Rent CPI for June was 7.8% YoY.

Here is the rest of the story.

In keeping in with Biden admin’s penchant of constantly fabricating data, both May and June numbers were revised sharply lower of course:

  • May revised down by 25,000, from +306,000 to +281,000
  • June was revised down by 24,000, from +209,000 to +185,000.

To show just how ridiculous the data manipulation is, consider this chart – every monthly payrolls report in 2023 has been revised lower.

And on the disappointing jobs report and massive revisions of past data (the REAL inflation plaguing the nation is The Federal goverment lying about data), the US Treasury 2 year yield dropped like Biden on a flight of stairs.

Here are the faces of Washington DC. Lies, corruption, government for sale to highest bidder, cynacism, oppression, fear mongering, etc. This is Biden’s legacy.

Bidenomics! Ford Will Lose $4.5 Billion On EVs This Year, Up From $2.1 Billion Last Year (Ford DOWN -48% Since January 2022, GM DOWN -40% As Fed Withdraws Stimulus)

Bidenomics, the term for “Government Gone Wild! in terms of spending and EPA regulations, is a disaster for the US middle class and low wage workers. Even the 1% are now hurting if bought into Biden’s green lunacy. Ford is now down -48% since January 14, 2022 as The Fed started raising rates to fight inflation. GM is down “only” -40%.

Ford is slated to lose $4.5 billion from its EV segment this year, a $1.5 billion larger loss than the company had expected. 

So far this year, the division has lost $1.8 billion and this year’s $4.5 billion loss figure blows away last year’s $2.1 billion loss. Ford also announced that its electric F-150 pickup trucks will undergo a price cut, according to Fox.

Ford beat earnings on Thursday and reported adjusted EPS of $0.72, beating expectations of $0.54. It posted revenue of $45 billion and adjusted EBITDA of $3.8 billion, above estimates of $3.15 billion. 

The company also raised its guidance, forecasting adjusted EBIT of $11 billion to $12 billion from $9 billion to $11 billion. The company is now guiding for free cash flow of $6.5 billion to $7 billion, from $6 billion. 

But reality has sunk in about the company’s comments regarding its EV production schedule and spending plans. Price cuts in the industry, led by Elon Musk and Tesla, have thrown Ford’s production targets into a tailspin and Morgan Stanley noted on Friday morning that “major changes to the EV strategy” could be necessary, according to a wrap up by Bloomberg. 

Ford now says it is “throttling back” on plans to ramp up EV production, the wrap up said. It blamed the price war for EVs as part of the cause and told shareholders it would need another year to meet its target of 600,000 EVs produced annually. 

Ford CEO Jim Farley said late last week: “The shift to powerful digital experiences and breakthrough EVs is underway and going to be volatile, so being able to guide customers through and adapt to the pace of adoption are big advantages for us. Ford+ is making us more resilient, efficient and profitable, which you can see in Ford Pro’s breakout second-quarter revenue improvement (22%) and EBIT margin (15%).”

CFO John Lawler said yesterday that the company “has ample resources to simultaneously fund disciplined investment in growth and return capital to shareholders – for the latter, targeting 40% to 50% of adjusted free cash flow,” Bloomberg added. He now says Ford is “not providing a date” for producing 2 million EVs per year, which was previously the company’s target for 2026. 

Ford’s inability to compete with Tesla was noted earlier this year in a piece titled Tesla ‘Weaponizes’ Price-Cuts To Crush EV Competition

Is the company pulling an Intel and “kitchen sinking” its guide for the year, or has Elon Musk’s price cuts over at Tesla really put the legacy automaker on the ropes? Ford reports again on October 26, where we’ll get our next glimpse into its continuing operations this year. 

Tesla is down -26% since January 14, 2022. And showing a nice turnaround!

Today, the 10-year Treasury yield is up 11 basis points.

Government Gone Wild!

Bidenomics! Mortgage Demand Decreases 3.0% From One Week Earlier, But Purchase Demand Down 26% From Last Year, Down -45% Under Biden While Mortgage Rates Are UP 134% (US Interest Expenses Surged By 50% In Past Year To Nearly $1 Trillion On Annualized Basis)

Inflation under Biden has been very painful for the US middle class and low wage workers. That inflation has resulted to surging mortgage rates thanks to The Fed’s counterattack.

The result? Mortgage rates are up 134% under Bidenomics, while mortgage purchase demand is down -45% since Biden was selected. And mortgage refinancing demand is down a staggering -90%!

Mortgage applications decreased 3.0 percent from one week earlier, according to data from the Mortgage Bankers Association’s (MBA) Weekly Mortgage Applications Survey for the week ending July 28, 2023.

The Market Composite Index, a measure of mortgage loan application volume, decreased 3.0 percent on a seasonally adjusted basis from one week earlier. On an unadjusted basis, the Index decreased 3 percent compared with the previous week. The Refinance Index decreased 3 percent from the previous week and was 32 percent lower than the same week one year ago. The seasonally adjusted Purchase Index decreased 3 percent from one week earlier. The unadjusted Purchase Index decreased 3 percent compared with the previous week and was 26 percent lower than the same week one year ago.

US interest expenses have surged by about 50% in the past year, to nearly $1 trillion on an annualized basis.

Look at the share of net worth by the top 1% as Treasury borrows more money.

Oddly, Biden is not talking about about putting US government policies up for sale to the highest bidders. But don’t worry. Biden is the King of Corruption in the District of Corruption (Washington DC).

Bidenomics! Wheels Come Off The “Strong Jobs” Myth As Job Openings Drop To 2 year Low (Number Of Hires And Quits Plunge As Fed Withdraws Monetary Stimulus)

The wheels are coming off the Bidenomics recovery.

US job openings (JOLTS) keep declining as The Fed withdraws its Covid sugar splash of monetary stimulus and raise The Fed’s target rate.

For those enthralled by the narrative that AI will cause a margin-busting corporate revolution as millions of well-paid, middle-management employees are replaced by a cheap “bullshitting” AI algo, then today’s latest JOLTS report may come as a bigger shock than the big drop in job openings from one month ago. That’s because after unexpectedly dumping by 496K in May (a number which has been revised far worse of course), the BLS just reported that in June the number of job openings was practically unchanged, dropping by just 34K, to 9.582MM from a downward revised 9.616 million. And while the monthly change was modest after the downward revision of course, the total was dragged to the lowest level since April 2021.

The number was about 1.4 million below the 11 million from a year ago and below the consensus estimate of 9.6 million, a rare miss in a series which has been best known for decisively beating Wall Street’s expectations.

According to the BLS, the largest increases in job openings was in health care and social assistance (+136,000) and in state and local government, excluding education (+62,000). Job openings decreased in transportation, warehousing, and utilities (-78,000), state and local government education (-29,000), and federal government (-21,000)

The slide in the number of job openings meant that after rising to the highest since January 2023 in April, in June the number of job openings was just 3.7625 million more than the number of unemployed workers, the lowest since Sept 2021.

Said otherwise, after rising to 1.82 openings for every worker in April, in June the number dropped to just 1.61, which would have been the lowest level since Oct 2021 if it weren’t for last month’s sharp downward revision.

Yet even as the number of job openings dropped only modestly from the (sharply) downward revised print for May (because under Biden, no number is ever revised stronger), conflicting data remained and in June, the number of people quitting their jobs – an indicator traditionally associated with labor market strength as it shows workers are confident they can find a better wage elsewhere – unexpectedly tumbled by 295K to just 3.772MMthe biggest monthly drop since May 2021.

According to the BLS, the number of quits decreased in several industries, with the largest decreases in retail trade (-95,000), health care and social assistance (-75,000), and construction (-51,000). The number of quits increased in arts, entertainment, and recreation (+20,000).

And just in case some still believe Biden’s strong jobs lie, the number of hires also tumbled in June, crashing by 326K – the biggest monthly drop since July 2020…

… to 5.905MM, the lowest since February 2021.

Of course, as we have explained on multiple occasions previously, none of the above data actually matters or is credible for the simple reason that the response rate of the JOLTS survey is stuck at a record low 31.2%. Which means that only those who actually have job openings to report do so, while two-thirds of employers are either non-responsive or their mail is quietly lost in the mail.

Wheels. Of massive corruption and debauchery.