Mortgage Purchase Demand Decreases, Lowest Level Since 1995 As Fed Removes Punch Bowl (Punch Bowl To Dust Bowl)

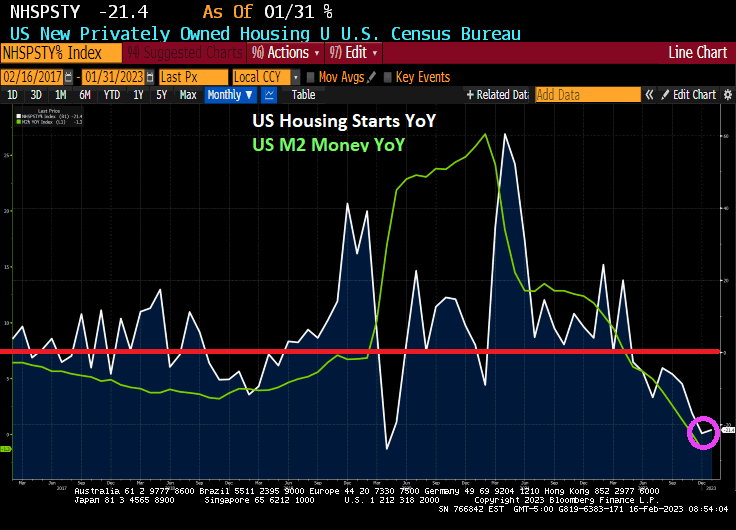
Today’s mortgage application (demand) numbers from the Mortgage Bankers Association was disappointing to say the least. Mortgage purchase demand just sank to it lowest level since 1995.

Typically, mortgage purchase applications peak in May or June of each year before beginning their annual lemmings drive downwards. But this year is seeing a early turn for the worse.

The unadjusted Purchase Index decreased 3 percent compared with the previous week and was 44 percent lower than the same week one year ago. The Refinance Index decreased 6 percent from the previous week and was 74 percent lower than the same week one year ago.

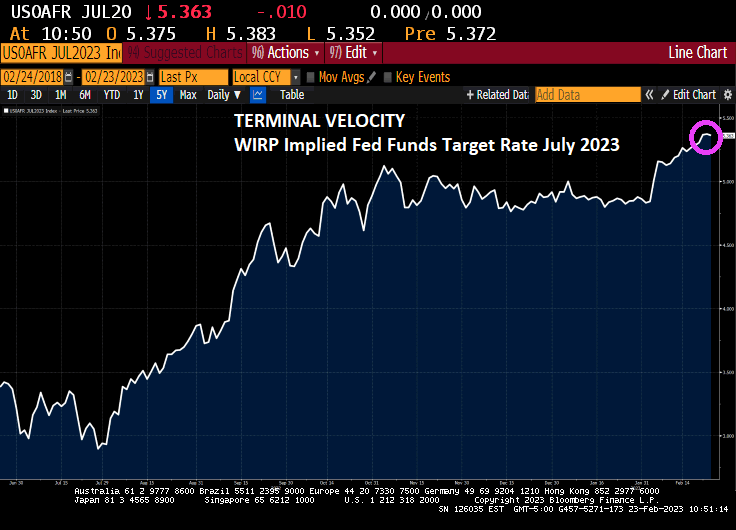
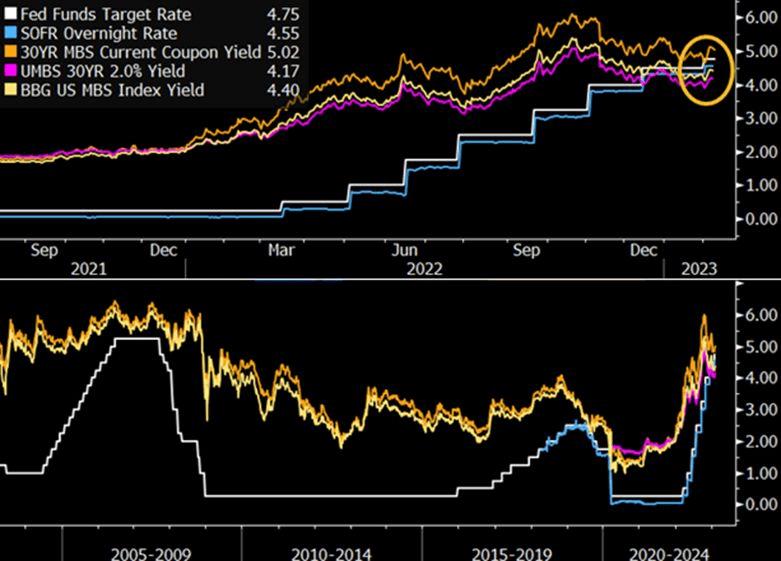
The Fed is hell bent on removing the punch bowl to fight inflation. Looks like Biden’s economic plan is turning the punch bowl into a dust bowl.

Uh-oh! January Personal Consumption Expenditures Soar 1.8% MoM, PCE Deflator UP 5.4% YoY, 2-year Treasury Yield Rises 10 Basis Points (Here Comes The Fed!)

Not really a surprise, but January’s personal spending numbers came in hot at 1.8% MoM. Also, Personal Consumption Expenditures PRICE index (aka, inflation) rose to 5.4% YoY.

Here comes The Fed! The 2-year Treasury yield rose 10 basis points this morning.

Pelsoi and Schumer (with McConnell) got the gold mine and American consumers got the shaft.

Is That All There Is? US Q4 Real GDP Up Only 0.91% YoY Despite $54.8 TRILLION In Federal Debt (+36%) Added Since January 2020

The US Federal government reminds me of the Peggy Lee song “Is That All There Is?” Since the outbreak of Covid in 2020 and the absurb spending spree by Pelosi and Schumer, the Federal government has increased their debt by 36% to help pay for the Federal spending spree. That amounts to $54.8 TRILLION in additional Federal debt since January 2020.

What did the US economy get for all that Federal spending? In Q4 2022, Real GDP rose by … 0.91% YoY. Seriously? Is that all there is from $54.8 TRILLION in additional Federal debt?

What do you expect when low-life lobbyists shuffle in and out of Congressional offices and the White House. Lobbyists don’t represent middle class America, but represent the elites.

Another bit of lousy news. Look at the trend in S&P 500 Earnings Surprise (5 year).

On the housing front, the US housing market was hit with the biggest six-month wipeout since 2008.

At least US Transportation Secretary “Pothole Pete” Buttigieg FINALLY showed up (three weeks after that East Palestine Ohio train disaster). Here is Buttigieg practising for his press conference.

Summertime Blues! US Treasury 3m30y Curve In Bear Steepening Mode, Indicating A US Recession By Summer 2023

The US economy has a case of the summertime blues.

Bull steepenings in the yield curve are generally seen as a precursor to a recession, but they are often preceded by bear steepenings. The 3m30y curve is currently bear steepening, indicating a recession could begin as early as the summer. In fact, the 3m30y curve is now inverted at -94.628 basis points pointing to a recession in summer 2023.

This is happening as the US house payment to income ratio near all-time highs.

Terminal Velocity! Fed Implied Terminal Rate Now 5.363% At July ’23 FOMC Meeting As US GDP Report Revised Lower On Weaker Consumer Spending In Q4 ’22 (GDP PRICE Index Revised UP To 3.9%)

Yesterday, we saw The Federal Reserve release the minutes of the last meeting. In a nutshell, The Fed is going to keep raising rates.

The terminal Fed Funds target rates is now 5.363% for the July FOMC (Fed Open Market Committee) meeting in 2023.

This comes as US Q4 GDP was revised lower on weaker consumer spending, revised downward to 1.4%

With the revision of Personal Consumption, real GDP was revised downward to 2.7% annualized QoQ.

The Taylor Rule estimate for The Fed Funds Target rate is 10.15%. The Fed is only at 4.75%, so there is a long way to go! Except that The Fed doesn’t follow any useful rule like the Taylor Rule. Just the “seat of the pants” rule.

The Thrill Is Gone! US Existing Home Sales Crash -37% YoY In January (Median Price YoY Falls To 0.67%) As The Fed’s Thrill Is Gone

The thrill is gone from housing as The Fed tightens away.

Well, January’s existing home sales numbers were horrific. Down -37% year-over-year (YoY) and down -0.7% MoM.

The median price of existing home sales fell to 0.67% YoY.

I am now posting my Podcasts on Spotify.

But before I go for experimental therapy for my brain tumor, I will leave you with this diddy. Inflation expectations are on the rise, not falling like Biden and Yellen keep screaming.

Final Destination? US Housing Starts Drop -21.4% Year-over-Year In January As The Fed Continues To Tighten (PPI Final Demand Remains Elevated At 6% YoY)

I feel like I am in the film “Final Destination” but I can’t get off the aircraft.

First, US housing starts are now down -21.4% year-over-year (YoY) and down -4.5% month-over-month (MoM) in January 2023 as The Fed removes its massive monetary stimulus.

PPI Final Demand PRICES are still elevated at 6% YoY, so expect more Fed tightening.

Today’s data dump.

On a final note, I am appalled at the Biden Administration’s “response” to the East Palestine Ohio derailment. Where is Mayor Pete, the US Transportation Secretary??

US Mortgage Applications Decline 7.7% From Last Week As Fed Continues Their Counterattack On Inflation (Purchase Apps Down 43% From Last Year, Refi Apps Down 76%)

US inflation is causing The Federal Reserve to raise interest rates, and mortgage applications are suffering.

Mortgage applications decreased 7.7 percent from one week earlier, according to data from the Mortgage Bankers Association’s (MBA) Weekly Mortgage Applications Survey for the week ending February 10, 2023.

The Refinance Index decreased 13 percent from the previous week and was 76 percent lower than the same week one year ago. The seasonally adjusted Purchase Index decreased 6 percent from one week earlier. The unadjusted Purchase Index decreased 5 percent compared with the previous week and was 43 percent lower than the same week one year ago.

The MBA contract rate rose 3.4% from 6.18% to 6.39% as The Fed tightens.

And if you believe the Taylor Rule (as opposed to The Fed’s current politically-based decisions), The Fed’s target rate should be 10.15% and The Fed is less than half way there at 4.75%.

The Fed is expected (by investors in Fed Funds Futures) to rise to 5.283% by the July FOMC meeting, then decline to under 5% by January ’24.

Speaking of Fed rate hikes, January’s red hot retail sales (up 3% MoM) is surely going to drive inflation UP and The Fed will keep raising rates.

The West Is A Mess! US Home Prices Decline From 2022 Peak Most In The Western US (SF Down -13%, Seattle Down -11.3%, Phoenix Down -10.5%)

Black Knight’s December Mortgage Report is out and the house price graphs show the west is a mess.

While much of the US is down from 2022 peaks in home price. but it is The West where home prices are down the most (just like 2008 where the Inland Empire of California, Phoenix and Las Vegas crashed in term of home prices).

At least Columbus Ohio is down only -2.1% from the 2022 peak. While Austin TX is down almost -10% from 2022 peak.

US inflation numbers are out tomorrow. Let’s check on home price and rent growth tomorrow. But the forecast for January inflation is a increase.

Fed Tightening Pushed Fed Funds Target Rate Above MBS Yields For First Time In History (Biden Administration Ready To Unleash A $27 Billion Green Slush Fund)

The most recent tightening by the Federal Reserve has pushed the federal funds target rate above mortgage-backed securities yields for the first time in history. Though this poses clear challenges of carry for MBS holders, selective investments in specified pool and collateralized mortgage obligations (CMOs) could provide incremental returns.

While Biden brags (redundant) about lowering inflation (that his energy policies and massive Federal spending caused), apparently he never learns. Now we learn from Mish that the Biden Administration is ready to unleash a $27 billion green slush fund on the US middle class.

Inflation started under Biden, but the massive expansion in money supply (M2) begin with Covid in 2020.

Once this latest spending splurge kicks in, we will see rising inflation again. After all, Biden and Congress have gotten the taste for massive spending bills (like vampires) and spending likely won’t slow down.