Foul Powell On The Prowl in Jackson Hole! Powell Vows To Cut Rates With Stocks, Home Prices, Rents And Food At All Time Highs

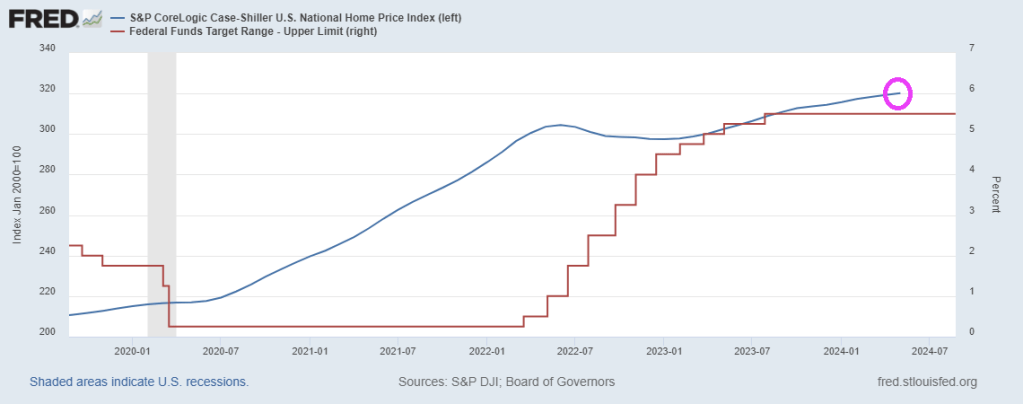
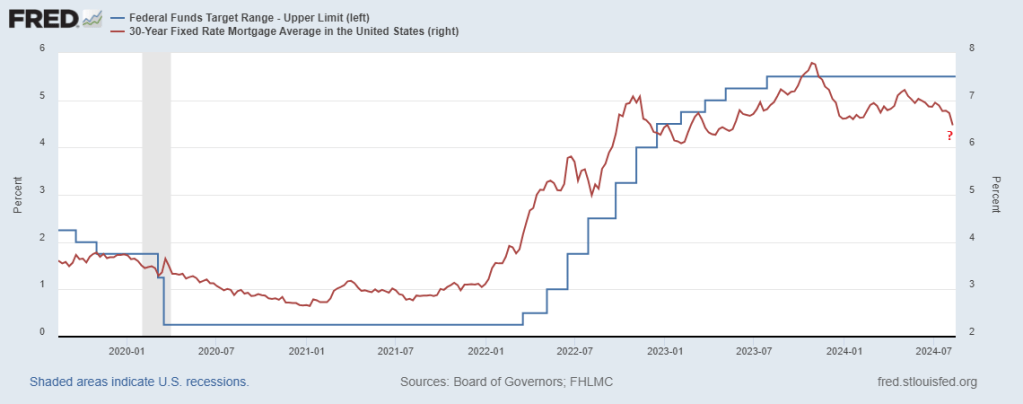
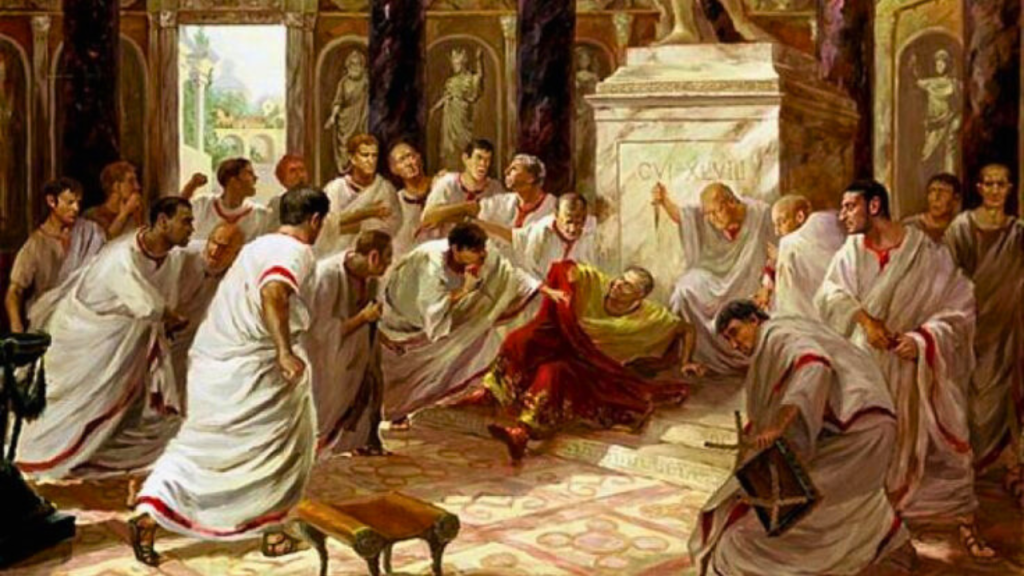
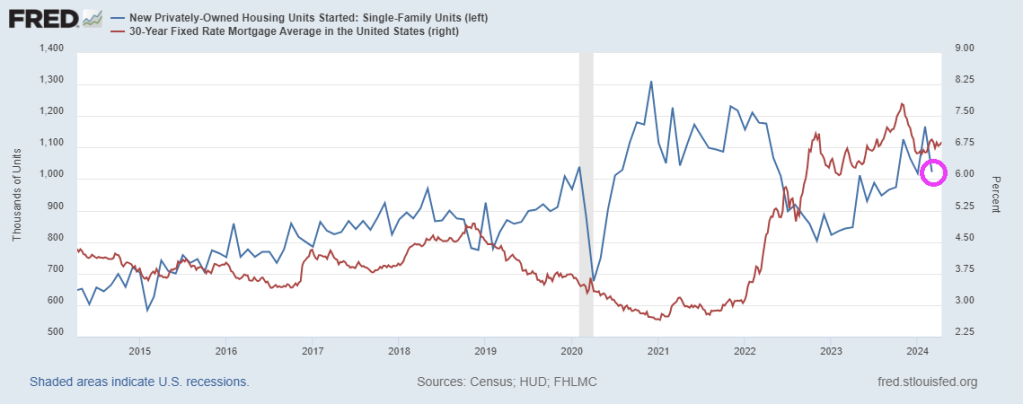
Foul Powell on the prowl! Even previous rate hikes couldn’t slow down house price growth. So I guess rate cuts might do something.

Well, it’s official: Powell came, saw, and unlike two years ago when, with with CPI rising almost double digits the uber-hawkish Fed chair warned of “pain” to come, this time he couldn’t be more dovish.

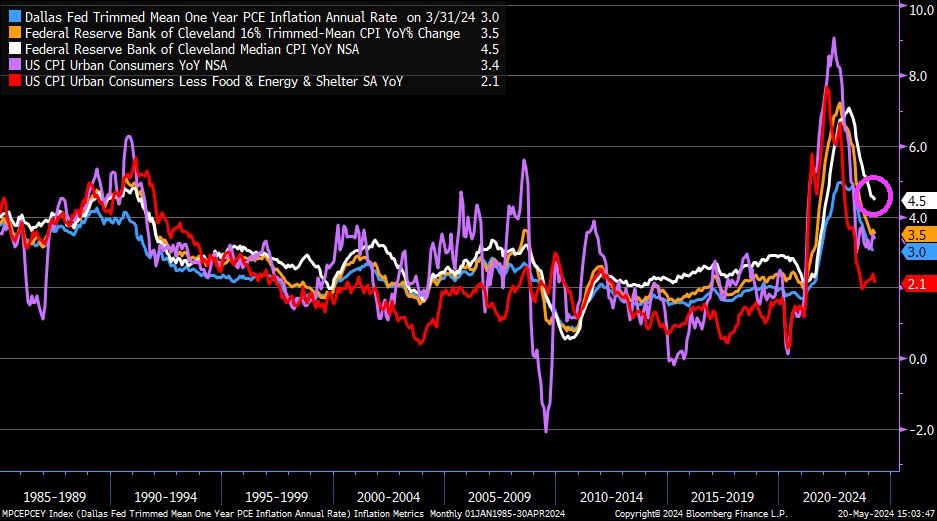
Having put inflation fully in the rearview mirror, the “Powell payrolls pivot” is now complete because as the Fed chair said, “the cooling in labor market conditions is unmistakable” even if it was quite mistakable to the Biden admin’s presstitutes as recently as one month ago.

Which is also why it was imperative for the Biden labor department to admit the truth about the deteriorating labor market: without that -818K revision earlier this week, the Fed would have some pushback to turning fully dovish. But now that we know that a third of the job gains in the last year of Bidenomics were bogus…well, please come save us Chairman Fed.

Or, as TradeStation head of strategy David Russell said, “here comes the punchbowl. Jerome Powell came out swinging today with a litany of dovish signals. He said inflation is on a sustainable path lower and talked about how the job market has cooled to pre-pandemic levels. He drove the point home with a clear call for adjusting policy.”

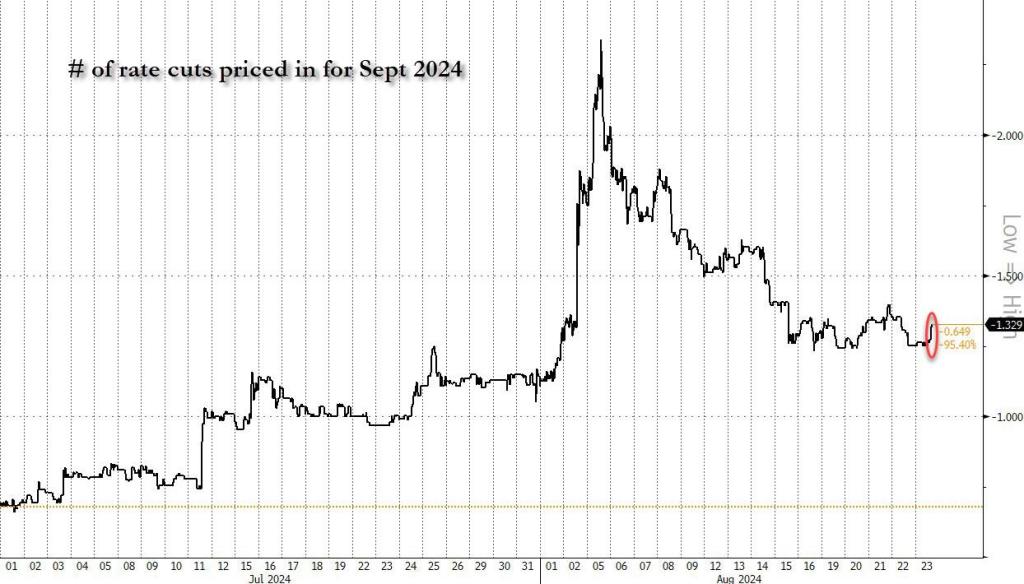
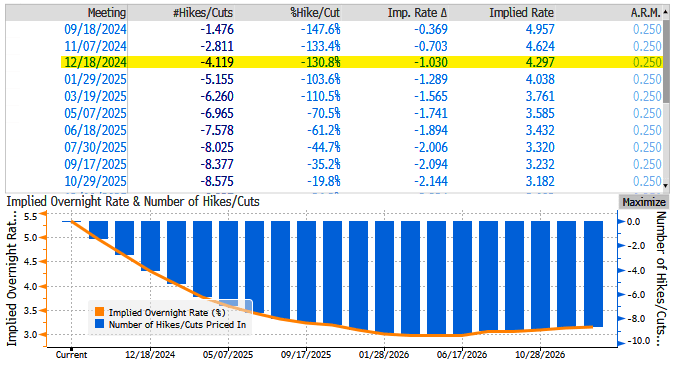
The market agreed, and quickly cemented at least one rate cut while also pricing in as much as 33% odds of a 50bps rate cut.

Which is all great: after all as we have long said, with the November elections looming, the Fed will do everything to make sure the establishment candidate isn’t distracted by such trivial things as a market crash.

There are just four small problems with this.

First: the Fed will end its tightening cycle and starts the next easing cycle with stocks at all time highs, something that has never before happened in the history of capital markets!

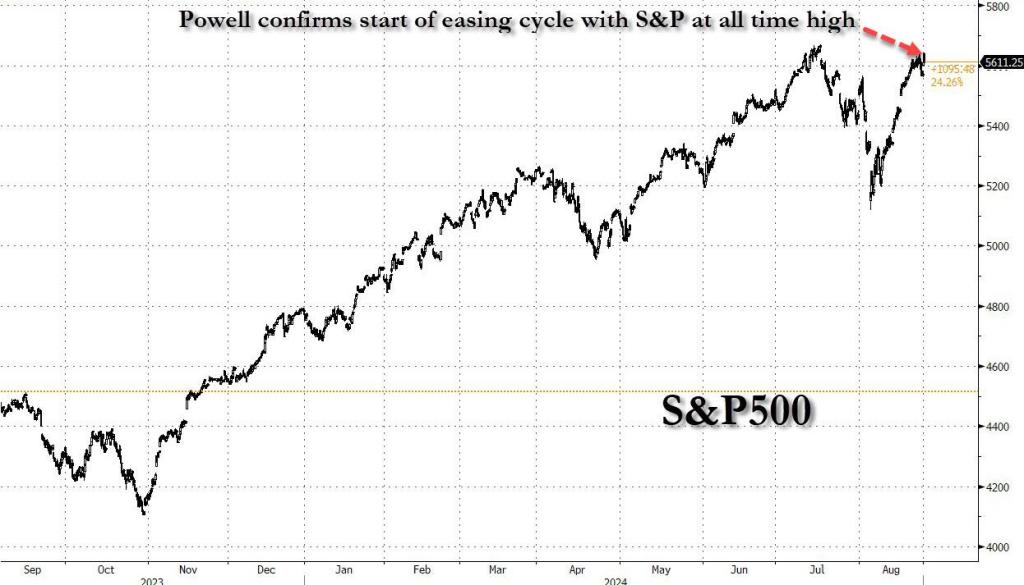
It means that, unless the current expansion ends in a gruesome recession which crushes the economy, the S&P is about to enter a full-blown bubble, which in turn will burst in even more spectacular fashion and force the Fed to not only cut back to ZIRP, but activate NIRP (just like Japan did years ago) and also go right back to QE and buying bonds ETFs. For now, however, as in the next three months ahead of the elections, all shall be well and should serve the all time high in the market to Kamala Harris on a silver platter…. which is precisely why the Fed is doing what it is doing.

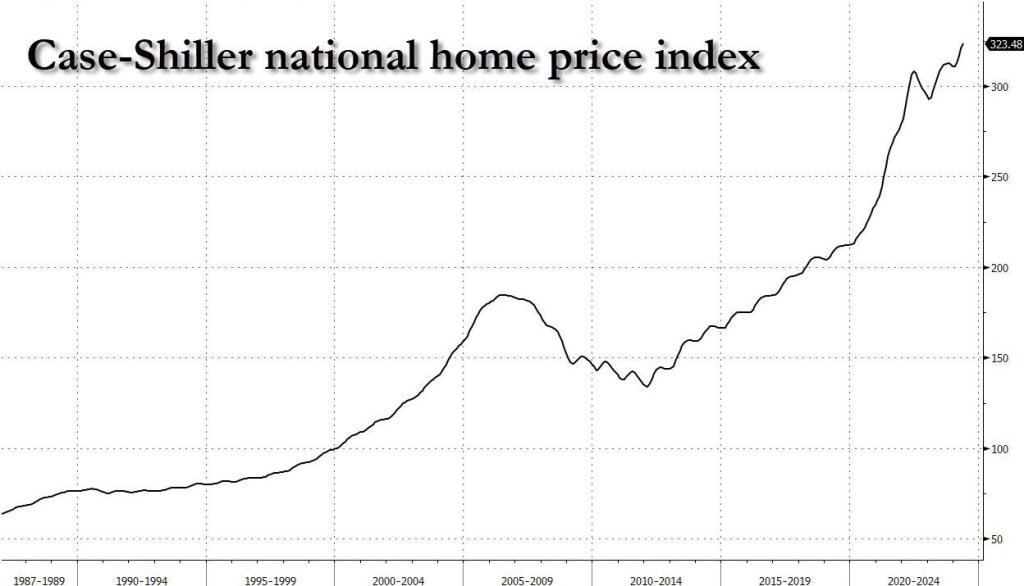
Second, this is also the first time in history when the Fed has aborted a tightening cycle having achieved zero home price easing. Indeed, one look at the case-shiller index shows that home prices are the highest they have ever been…

… as are actual asking rents according to Zillow (not that delayed aberration known as Owner-Equivalent Rent).

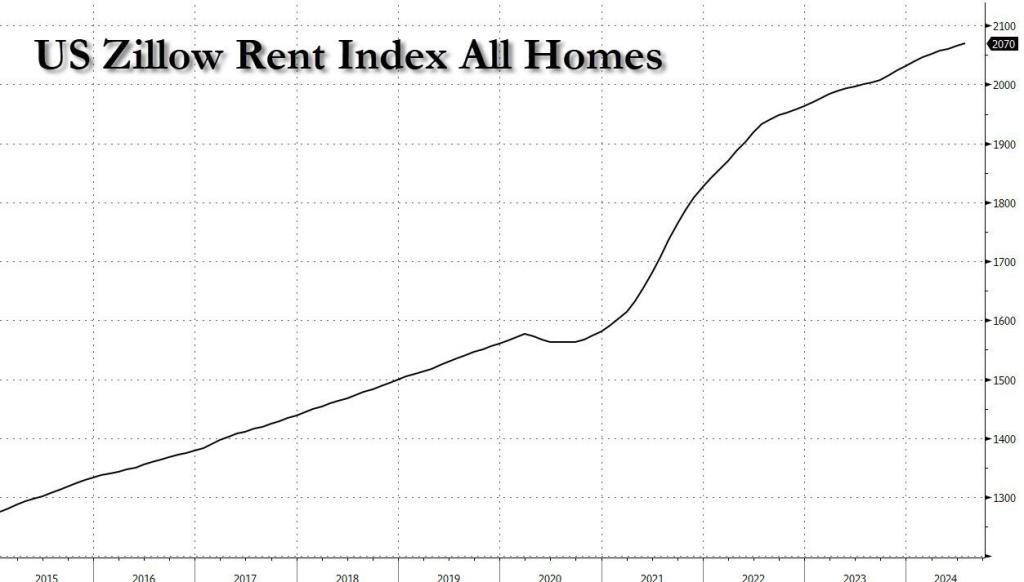
And then you have Kamala’s promise to provides $25,000 in new home purchase subsidies, which will go straight to the asking price, sending prices even higher.

In short, both home prices and rents, already at record high, are about to go record-er…

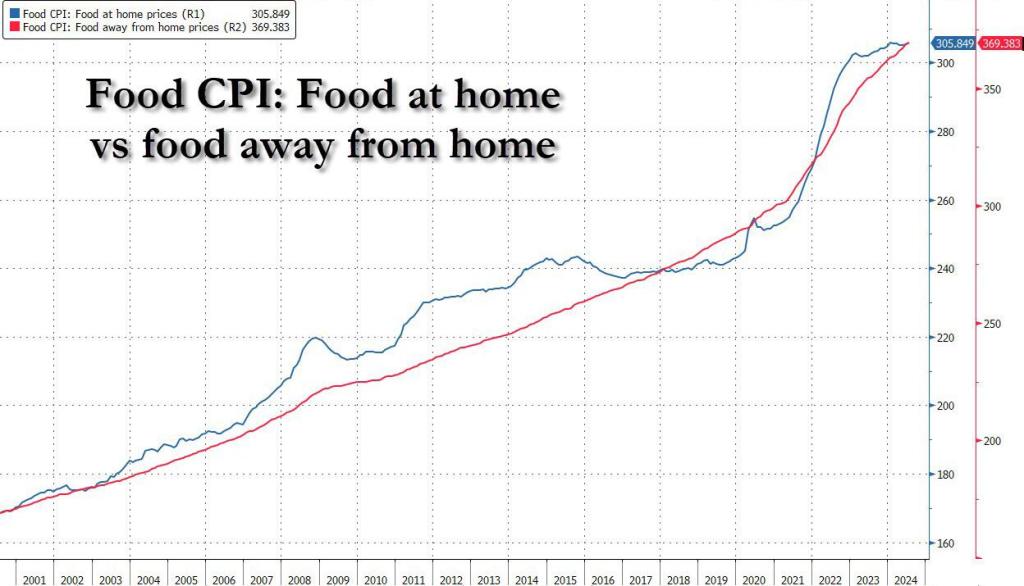
Third, while one can technically live without housing or rent, one still needs to eat. And here we find another problem, because not only did the Fed’s rate hikes not contain stock, home or rent prices, but food prices – both at home and away from home – are also at all time high! And guess what cutting rates and stimulating the economy will do to food prices from this point on…

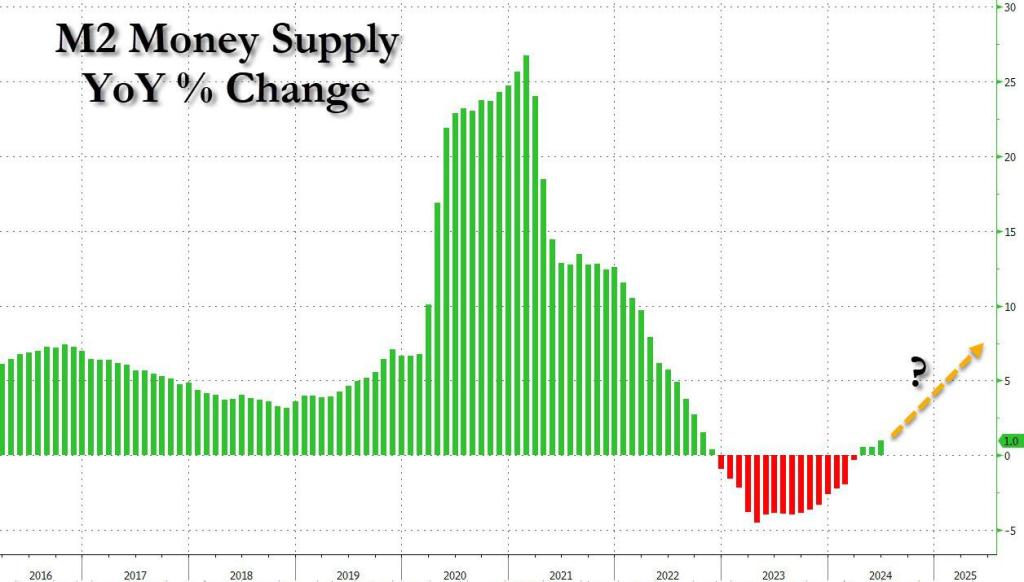
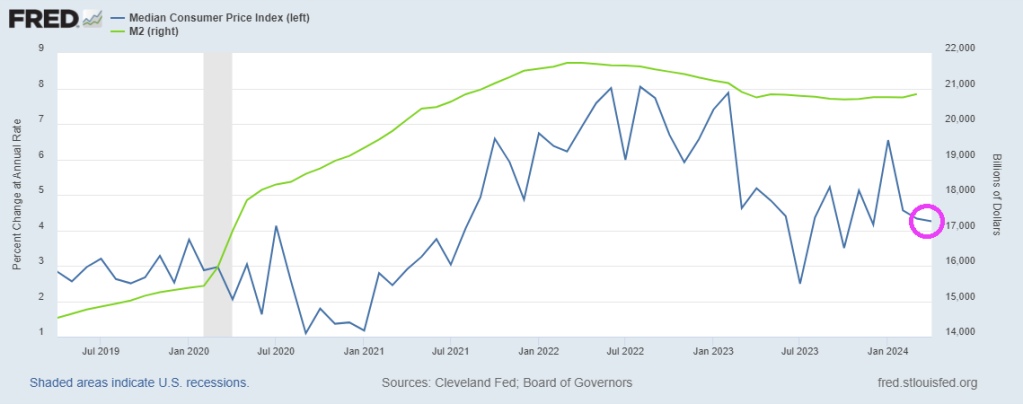
Fourth, and final, the seeds of the next inflationary bubble are already set, because even as the Fed kept conditions tight (or even exceptionally tight), M2 – the broadest money aggregate tracked by the Fed – is once again rising after declining for the past three years.

Of course, there are countless other examples, because besides the above case studies, prices are at all time highs pretty much everywhere else too. But you get the message. The only question is what can possibly go wrong with the Fed launching an easing (i.e., monetary stimulus) cycle with prices for pretty much everything, stocks and homes included, at all time highs and rising.

Goin’ Down! Traders Expect Fed’s To Cut Four 25bps By End Of Year And More Cuts In 2025 (Mortgage Rates Will Fall!)

Freddie King said it best! Interest rates are goin’ down!

Yes. traders expect The Fed to cut their target rate from 5.50% (current rate) tp 4.297% by the December meeting. That is a whopping 120 basis points.

And expect another 100 basis points of cuts by the September 2025 Fed FOMC meeting. Down to 3.232%.

Mortgage rates will fall.

Like the Roman Empire. Et tu Kamala?

Sign Of The Times! Mortgage Purchase Demand (Applications) DOWN -2% Since Last Week, DOWN -11% Since Last Year (VA Mortgages Prepaying The Fastest)

It’s a sign of the times under Bidenomics!

Mortgage applications increased 1.9 percent from one week earlier, according to data from the Mortgage Bankers Association’s (MBA) Weekly Mortgage Applications Survey for the week ending May 17, 2024.

The Market Composite Index, a measure of mortgage loan application volume, increased 1.9 percent on a seasonally adjusted basis from one week earlier. On an unadjusted basis, the Index increased 1.1 percent compared with the previous week.  The seasonally adjusted Purchase Index decreased 1 percent from one week earlier. The unadjusted Purchase Index decreased 2 percent compared with the previous week and was 11 percent lower than the same week one year ago.

The 30-year fixed mortgage rate declined for the third straight week, dropping to 7.01 percent – the lowest level in seven weeks. Thus, the Refinance Index increased 7 percent from the previous week and was 21 percent higher than the same week one year ago.

VA-insured mortgages prepay the fastest, followed by FHA-insured mortgages then conventional mortgages.

I know a place where the housing market is hot! Florida and Texas!

Sundown? Inflation Slowing, But Still At 4.5% (Fed Still Printing Zads Of Dollars!)

I learn something new everyday. Like Biden yesterday claimed has was VP during Covid (uhm, Covid was in 2020 and Biden left the office of VP in 2017). But nothing gets in the way of Biden and a good story! Like his whopper that he inherited 9% inflation from Trump (even CNN fact-checked this whopper and found it was false. It was only 1.4%!)

But inflation is still at 4.5%, according to the Cleveland Federal Reserve.

Now, there are many measures of inflation to choose from, from Core CPI of 2.1% YoY to Cleveland Fed’s Median CPI of 4.5%.

Is it sundown for the US economy and its middle class? Or the wreck of the USS Economy under Biden?

Stop! Stop! Stop! US Public Debt Will Reach $60 Trillion By End Of 10-year Budget Window

Stop! Stop! Stop! … all the printing!

These people have to be stopped!

We are talking about the nation’s unhinged monetary politburo domiciled in the Eccles Building (The Federal Reserve), of course. It is bad enough that their relentless inflation of financial assets has showered the 1% with untold trillions of windfall gains, but their ultimate crime is that they lured the nation’s elected politician into a veritable fiscal trance. Consequently, future generations will be lugging the service costs on insuperable public debts for years to come.

For more than two decades these foolish PhDs and monetary apparatchiks drove the entire Treasury yield curve to rock bottom, even as public debt erupted skyward. In this context, the single biggest chunk of the Treasury debt lies in the 90-day T-bill sector, but between December 2007 and June 2023 the inflation-adjusted yield on this workhorse debt security was negative 95% of the time.

That’s right. During that 187-month span, the interest rate exceeded the running (LTM) inflation rate during only nine months, as depicted by the purple area picking above the zero bound in the chart, and even then by just a tad. All the rest of the time, Uncle Sam was happily taxing the inflationary rise in nominal incomes, even as his debt service payments were dramatically lagging the 78% rise of CPI during that period.

Inflation-Adjusted Yield On 90-Day T-bills, 2007 to 2022

The above was the fiscal equivalent of Novocain. It enabled the elected politicians to merrily jig up and down Pennsylvania Avenue and stroll the K-Street corridors dispensing bountiful goodies left and right, while experiencing nary a moment of pain from the massive debt burden they were piling on the main street economy.

Accordingly, during the quarter-century between Q4 1997 and Q1 2022 the public debt soared from $5.5 trillion to $30.4 trillion or by 453%. In any rational world a commensurate rise in Federal interest expense would have surely awakened at least some of the revilers.

But not in Fed World. As it happened, Uncle Sam’s interest expense only increased by 73%, rising from $368 billion to $635 billion per year during the same period.  By contrast, had interest rates remained at the not unreasonable levels posted in late 1997, the interest expense level by Q1 2022, when the Fed finally awakened to the inflationary monster it had fostered, would have been $2.03 trillion per annum.

In short, the Fed reckless and relentless repression of interest rates during that quarter century fostered an elephant in the room that was one for the ages. Annualized Federal interest expense was fully $1.3 trillion lower than would have been the case at the yield curve in place in Q4 1997.

Alas, the missing interest expense amounted to the equivalent of the entire social security budget!

So, we’d guess the politicians might have been aroused from their slumber had interest expense reflected market rates. Instead, they were actually getting dreadfully wrong price signals and the present fiscal catastrophe is the consequence.

Index Of Public Debt Versus Federal Interest Expense, Q4 1997-Q1 2022

Needless to say, the US economy was not wallowing in failure or under-performance at the rates which prevailed in 1997. In fact, during that year real GDP growth was +4.5%, inflation posted at just 1.7%, real median family income rose by 3.2%, job growth was 2.8% and the real interest rates on the 10-year UST was +4.0%

In short, 1997 generated one of the strongest macroeconomic performances in recent decades—even with inflation-adjusted yields on the 10-year UST of +4.0%. So there was no compelling reason for a massive compression of interest rates, but that is exactly what the Fed engineered over the next two decades. As shown in the graph below, rates were systematically pushed lower by 300 to 500 basis points across the curve by the bottom in 2020-2021.

Current yields are higher by 300 to 400 basis points from this recent bottom, but here’s the thing: They are only back to nominal levels prevalent at the beginning of the period in 1997, even as inflation is running at 3-4% Y/Y increases, or double the levels of 1997.

US Treasury Yields, 1997 to 2024

Unfortunately, even as the Fed has tepidly moved toward normalization of yields as shown in the graph above, Wall Street is bringing unrelenting pressure for a new round of rates cuts, which would result in yet another spree of the deep interest rate repression and distortion that has fueled Washington’s fiscal binge since the turn of the century.

As it is, the public debt is already growing at an accelerating clip, even before the US economy succumbs to the recession that is now gathering force. And we do mean accelerating. The public debt has recently been increasing by $1 trillion every 100 days. That’s $10 billion per day, $416 million per hour.

In fact, Uncle Sam’s debt has risen by $470 billion in the first two months of this year to $34.5 trillion and is on pace to surpass $35 trillion in a little over a month, $37 trillion well before year’s end, and $40 trillion some time in 2025. That’s about two years ahead of the current CBO (Congressional Budget Office) forecast.

On the current path, moreover, the public debt will reach $60 trillion by the end of the 10-year budget window. But even that depends upon the CBO’s latest iteration of Rosy Scenario, which envisions no recession ever again, just 2% inflation as far as the eye can see and real interest rates of barely 1%. And that’s to say nothing of the trillions in phony spending cuts and out-year tax increases that are built into the CBO baseline but which Congress will never actually allow to materialize.

What is worse, even with partial normalization of rates, a veritable tsunami of Federal interest expense is now gathering steam. That is because the ultra-low yields of 2007 to 2022 are now rolling over into the current market rates shown above—at the same time that the amount of public debt outstanding is heading skyward. As a result, the annualized run rate of Federal interest expense hit $1.1 trillion in February and is heading for $1.6 trillion by the end of the current fiscal year in September.

Finally, even as the run-rate of interest expense has been soaring, the bureaucrats at the US Treasury have been drastically shortening the maturity of the outstanding debt, as it rolls over. Accordingly, more than $21 trillion of Treasury paper has been refinanced in the under one-year T-bill market, thereby lowering the weighted-average maturity of the public debt to less than five- years.

The apparent bet is that the Fed will be cutting rates soon. As is becoming more apparent by the day, however, that’s just not in the cards: No matter how you slice it, the running level of inflation has remained exceedingly sticky and shows no signs of dropping below its current 3-4% range any time soon.

What is also becoming more apparent by the day is that the money-printers at the Fed have led Washington into a massive fiscal calamity. It is only a matter of time, therefore, until the excrement hits the fan like never before.

And with Bidenomics killing off household excess savings, we won’t be going down to the nightclub anymore.

US Treasury Bond Issue Set To Increase To $1.9 Trillion In 2024 As Personal Saving Rate Crashes To Near Low Since 2010 (Goverment Displacing Households)

Joe Biden could barely eat his dinner at the White House Correspondents’ Dinner. And we think he is calling the shots in The White House?? Oh well. Perhaps it is Treasury Secretary Janet Yellen or Klaus Schwab of the World Economic Forum.

In any case, Treasury bond issuance in 2024 is expected to hit $1.9 TRILLION. Surpassing levels seen even during the 2008 financial crisis.

And with inflation, the US personal saving rate is near the lowest level since Obama (2010).

And with the core inflation rate still higher than anytime since 2010, households are paying more for … everything depleting their savings.

With Biden and Congress spending like drunken sailors on shore leave, and no end in sight, this will eventually explode. Ukraine, foreign aid, no border security, virtually no money for Maui fire, E. Palestine Ohio is still a wreck, etc. They always have money for someone else. And if Trump is elected in November, watch CNN and MSNBC and Biden/Congress blame Trump.

Commodities are a way to protect yourself against the government and their insane spending and debt.

My point? Gold keeps rising!

The leading foreign holder of US debt is Japan, which is following the insane path as the US and resembles a banana republic.

Former Fed chair under Obama and current Treasury Secretary Janet Yellen under Biden is Doctor Wonderful. NOT!!

I don’t know what Biden thinks is so funny. Maybe it is because House “Majority” Leader Mike Johnson (RINO-LA) gave Biden and Schumer everything they wanted (Ukraine, Israel funding but nada for security our borders). Life is good when you are stupid and mean-spiritied like Joe Biden!

Biden is so vain: capped teeth, hair plugs, constant tan, face lifts, etc.

The Green Slime! Ford Lost $132,000 On Every Electric Vehicle Sold In Q1 (Hertz Ups Sales Of EVs To 30,000 As China Dumps US Treasuries)

The Green Slime! The global movement towards Green Energy (or global Marxist movement) is really The Green Slime! Or maybe it should be renamed “The Red Slime.”

Ford lost $132,000 on every electric vehicles they sold in Q1. It was so bad that even CNN reported it!

And then we have Hertz dumping its inventory of EVs. A slew of used Teslas have hit the Hertz car sales website after the company announced Thursday it planned to sell off 10,000 more electric vehicles from its fleet than originally planned, bringing the fire sale’s total to 30,000. Perhaps one of the reasons you can get such a good deal on a Tesla at Hertz right now is that the outlook for EV value retention is pretty grim at the moment.

Given the incidents of electric cars catching fire, perhaps saying its a fire sales is a bad choice of words. But what it says is that DESPITE massive incentives to buy EVs, consumer demand stinks. Although Transportation Secretary Pete Buttigieg will claim the market is booming.

How bad is the trainwreck that is the Biden Regime? China is bailing on US Treasuries.

Then we have the harpies on The View claiming that the solar ecilpse is caused by … global warming. Also earthquakes. Sunny Hostin must have taken different courses that I did in college.

The Biden Regime is hereafter known as The Green Slime, given their horrible policies. Unfortunately, The Green Slime is here already … and Hertz knows customers don’t want them at least on a temporary basis.

Stagflation Alert? Bidenomics Is REALLY COVID-Related Spending (Q1 Real GDP Was 2.97% YoY, 1.6% QoQ While The Federal Government Spending Was 4.21% YoY, Core PCE Price Index Rose 3.7%!)

COVID was a gift to Biden. The furious Federal spending of Q2 2020 through Q1 2021 helped keep GDP growth above recession levels.

Ignore Biden’s demented rants/lies about cutting the debt in half. Biden has claimed he cut the $34+ trillion national debt by $7 billion, $1.4 trillion, $1.7 billion, $1.7 trillion, and “in half,” depending on the day he rants. He did no such thing. He is confused and is talking about the BUDGET DEFICIT (don’t look to Snopes to fact check “Trucker Joe”, they really only fact check Trump).

Not surprisingly, the Federal deficit spiked with the Covid lockdowns. But when the economy reopened, the budget deficit shrunk because … the economy was open and Federal tax receipts soared. But we are back to rising deficits again.

Today, Q1 GDP numbers were released and it looks great. Real GDP year-over-year was 2.97% while Federal government expenditures YoY were 4.21%. But the US is still processing the tidal wave of COVID-related spending out of Washington DC (red line). The YoY growth in Federal spending was 86.4% in Q2 2020, 48.9% in Q3 2020, 22.4% in Q4 2020, and 67.8% in Q1 2021. Like The Titanic trying to avoid the iceberg, it takes a while for massive Federal spending to work itself through the economic system.

On a QoQ basis, US GDP increased by only 1.60%. Here are the contributions to GDP.

GDP QoQ was up 1.6% while Core PCE Price Index rose 3.7%. Yikes!

Are we entering Stagflation with the worst GDP print in 2 years as prices soar. As COVID stimulus seems to be wearing out.

The election campaign for Biden should be Lloyd Price’s “Stagger Lee.” Redone as “Stagflation Joe.”

US Housing Starts Collapsed In March – Biggest Drop Since COVID Lockdowns (1-Unit Housing Starts Decline)

Come feel the noise! After steady growth in 1-unit housing starts under Trump, housing starts have been eratic under Biden despite the foreign invasion force of millions … of low wage workers.

The roller-coaster ride in housing permits, starts, and completions in the last few months is set to continue today… and ‘surprise’ they did. After a big (+10.7%) surge in February, Starts crashed 14.7% MoM in March (massively worse than the 2.,4% drfop expected). Building Permits also plunged (-4.3% MoM vs -0.9% exp)…

For context, this is the largest MoM drop in housing starts since the COVID lockdowns…

Source: Bloomberg

It was a bloodbath across the board with Rental Unit Starts plummeting 20.8% MoM…

Source: Bloomberg

That pushed total multi-family starts SAAR down to its lowest since COVID lockdowns

The plunge in permits was less dramatic and driven completely by single-family permits down 5.7% to 973K SAAR, from 1.032MM, this is the lowest since October. Multi-family permits flat at 433K

Intriguingly, while starts and completions plunged in March, the BLS believes that construction jobs surged to a new record high…

Source: Bloomberg

Finally, just what will homebuilders do now that expectations for 2024 rate-cuts have collapsed?

Source: Bloomberg

One thing is for sure – do not trust what homebuilders ‘say’ (as NAHB confidence jumped to its highest since May 2022 at the same time as housing starts crashed)…

Source: Bloomberg

If they build them, will homebuyers come?

Source: Bloomberg

Debtflation Nation! Fed Gov’t Spending $2 Billion PER DAY, Debt To GDP Headed To 200%, Electricity Costs SOARING

Biden and Congress have never met a project that they weren’t willing to fund (except a border wall with Mexico, of course).

Inflation is heating up again as the Federal government continues to spend.

4-5% by November…

US CPI on trend for 4-5% at US election in November.

Source: BofA

Above 5%…?

Strong CPI raises market probability of YE25 rates above 5%.

Source: Goldman

Cyclical inflation remains too elevated

“Our measure of cyclical inflation–which should capture the impact of excess demand on prices–appears to be stuck at around 5%, which is too elevated”

Source: Safra

US alone

The US is the only economy in the G10 where the latest inflation print surprised to the upside.

Source: Goldman

200% of GDP

Under current policies, government debt outstanding will grow from 100% to 200% of GDP.

Source: Apollo

Close to $9 trillion in maturities

That’s a significant amount of government debt maturing within the next year.

Source: Apollo

Every year a deficit

OMB forecasts 5% budget deficit every year for the next 10 years.

Source: Apollo

A billion per day….is long gone

US government interest payments per day have doubled from $1bn per day before the pandemic to almost $2bn per day in 2023.

Source: Apollo

Biggest Story of 2020s…Ugly End of 40-year Bond Bull

Chart shows long-term US government bond (15+ year) rolling 10-year annualized returns, %.

Source: Flow Show

Highest yields in 15 years

The intermediate part of the yield curve still offers the highest yields in over fifteen years.

Source: Piper Sandler

Finally, electricity costs keeps rising, ESPECIALLY with the misnamed Inflation Reduction Act (IRA). The real name of the IRA should have been the Large Green Donor Increase Act (LGDIA).