Mortgage Rates in the U.S. Soar to the Highest Since March 2020 (3.45% Nominal Rate, -3.59% REAL Rate)

Mortgage rates in the U.S. rose for a third straight week, reaching the highest point in almost two years. 

The average for a 30-year loan was 3.45%, up from 3.22% last week and the highest since March 2020, Freddie Mac said in a statement Thursday.

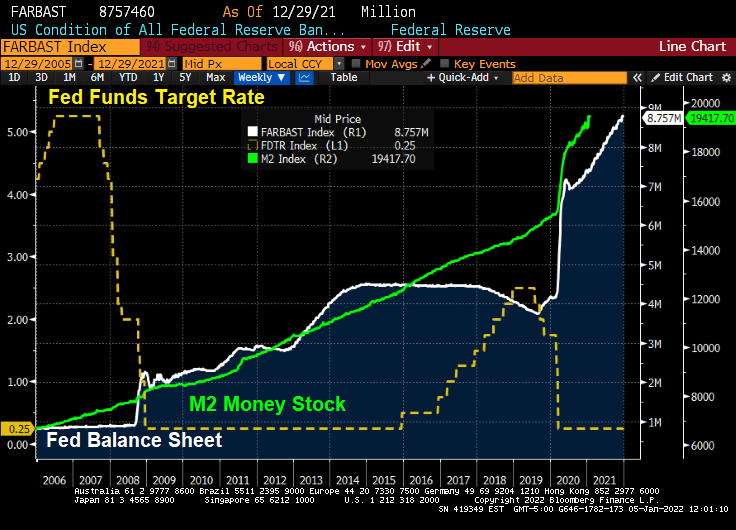
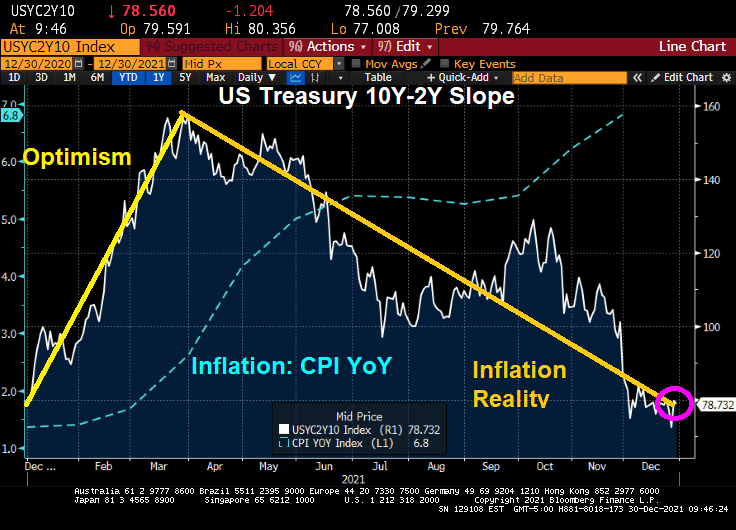
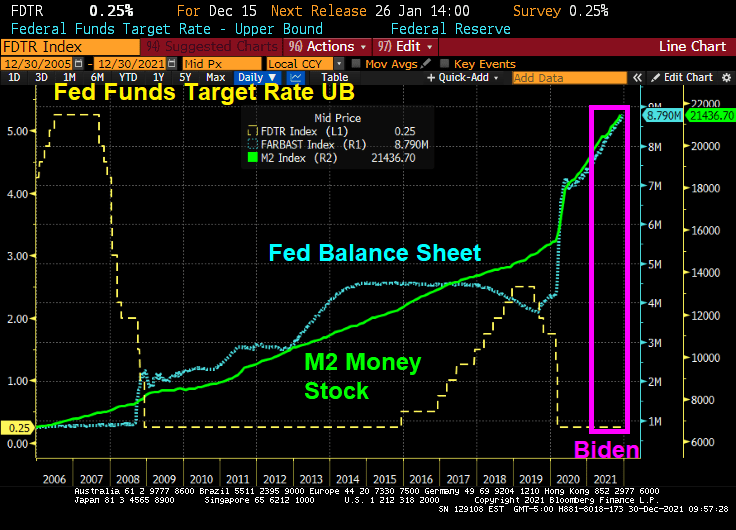
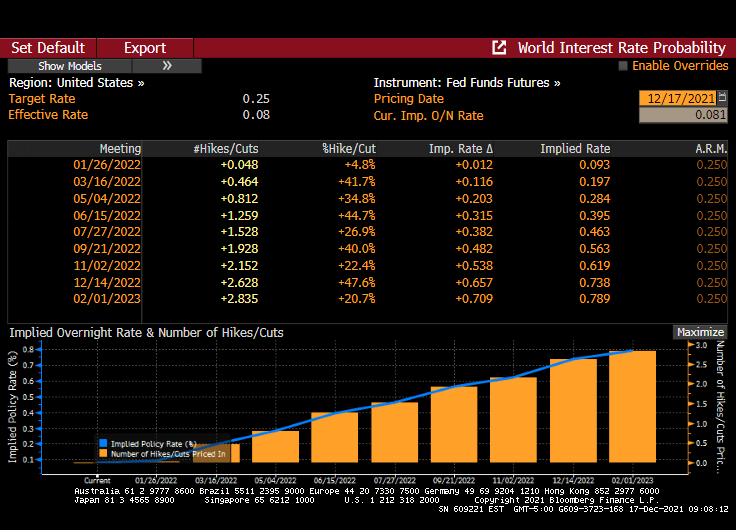
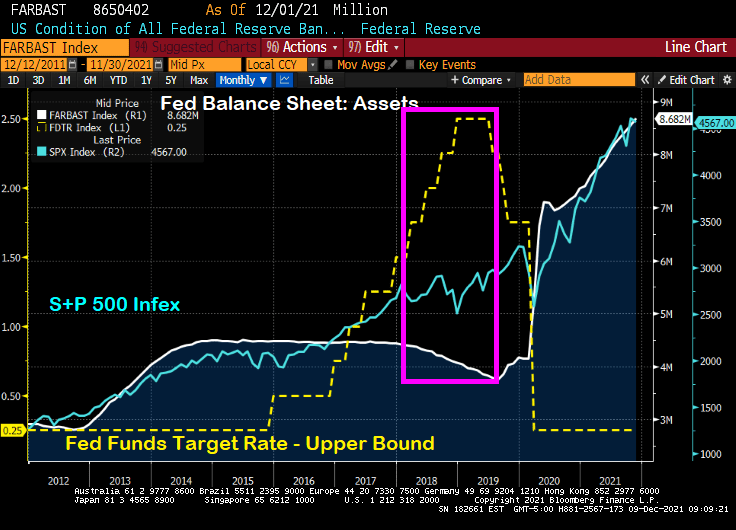
Rates tracked a jump in yields for 10-year Treasuries, which climbed to levels not seen since early 2020, before the pandemic roiled financial markets. Signs point to borrowing costs rising further as the job market improves and the Federal Reserve steps up its efforts to tame inflation.

That would increase the burden on homebuyers who are already stretching to afford a purchase. Rates for 30-year mortgages tumbled to a record low of 2.65% a little more than a year ago.

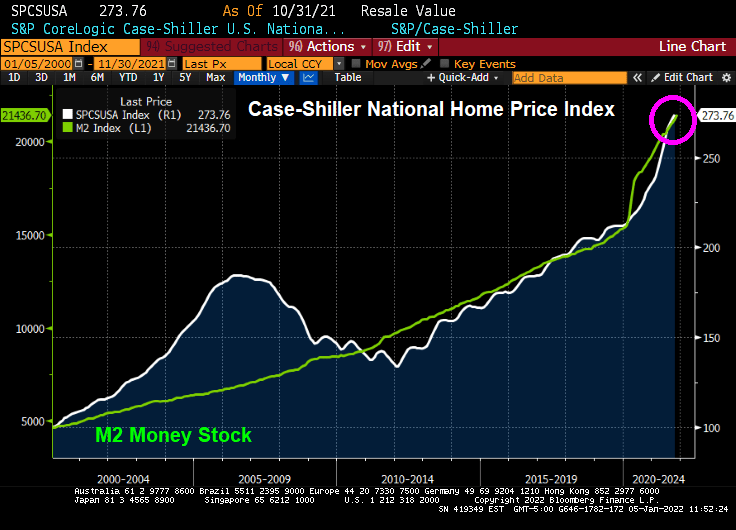
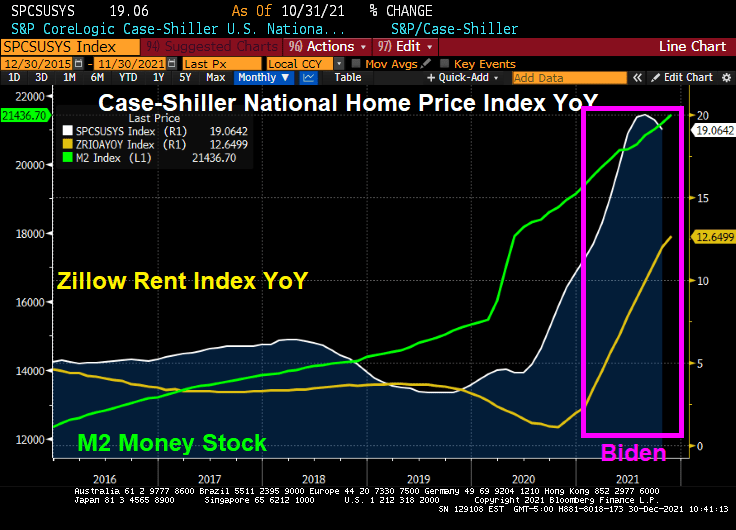
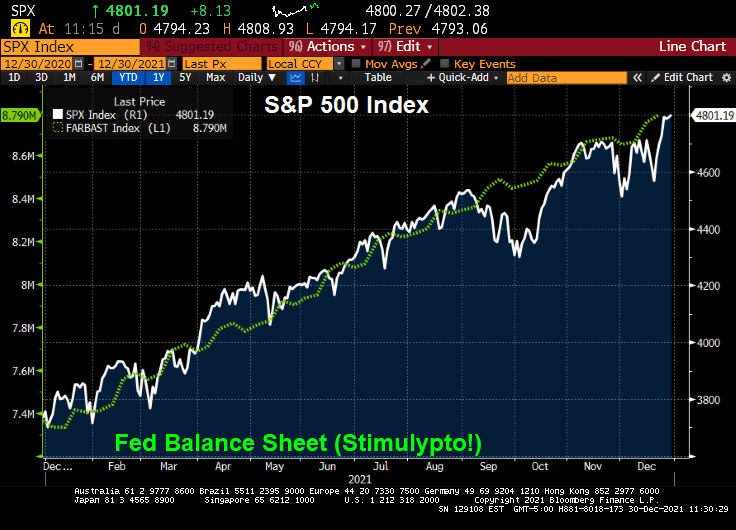
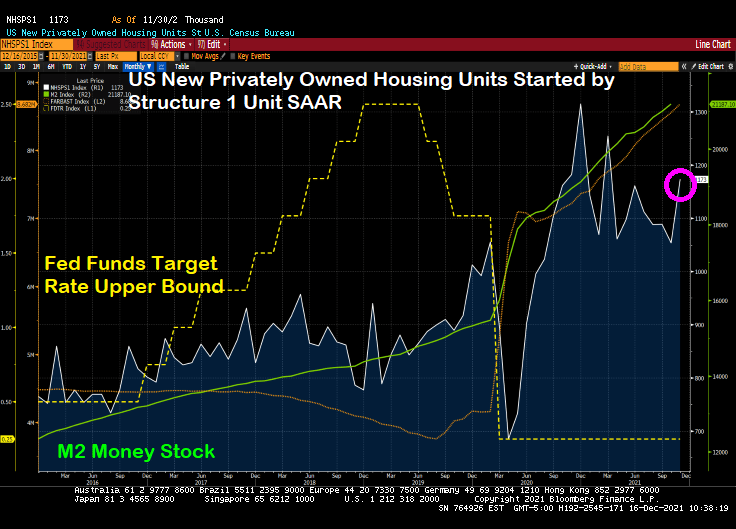
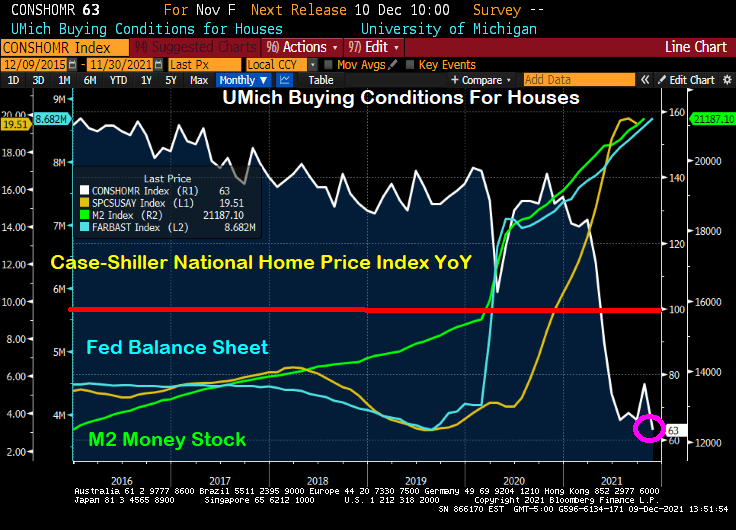
Cheap loans have helped fuel a housing rally that’s still running hot even as home prices soar out of reach for many Americans.

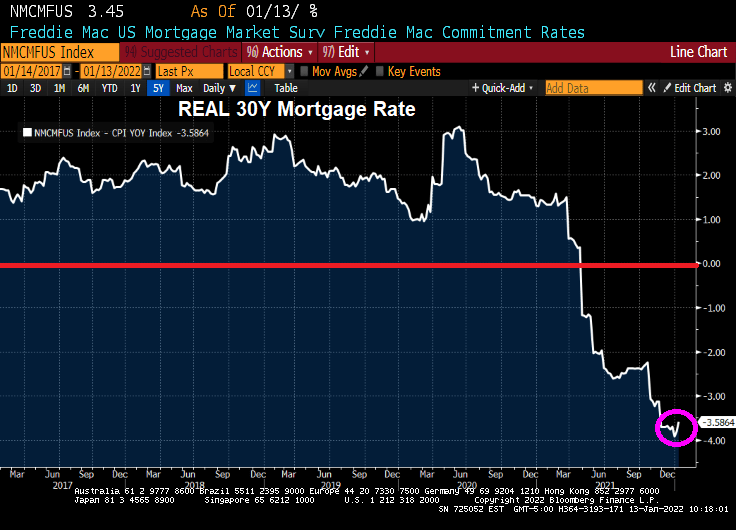
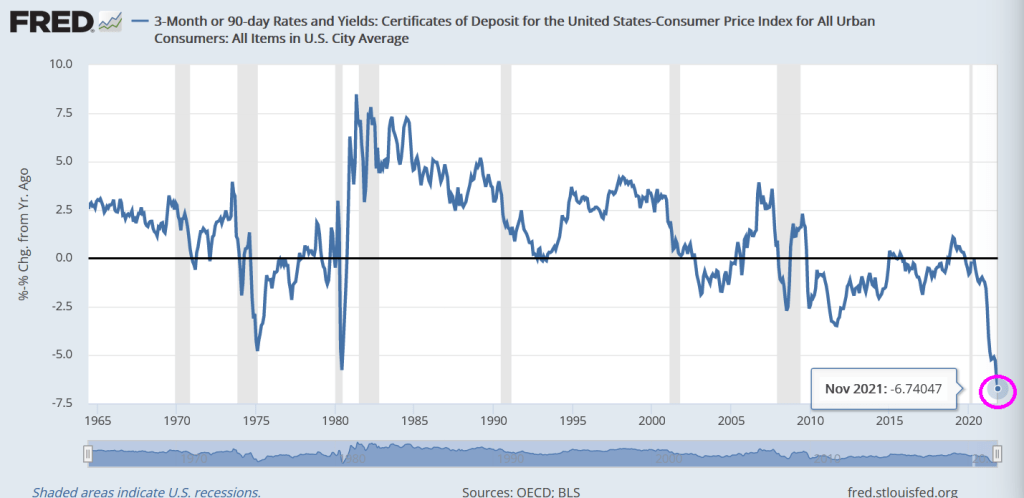
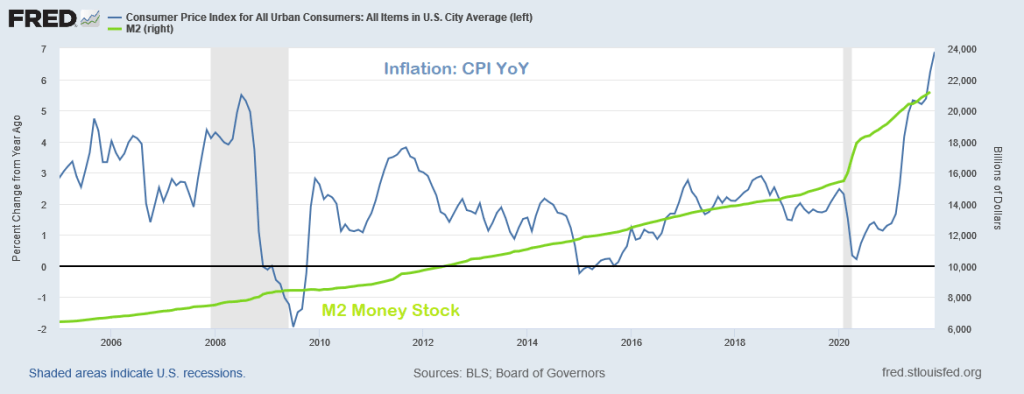
But wait! The REAL 30-year mortgage rate (nominal 30-year rate – CPI YoY) is -3.59%.

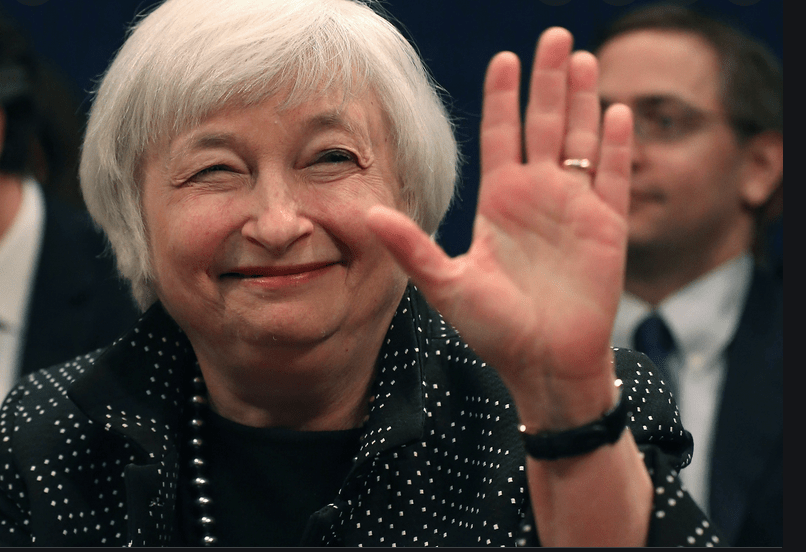
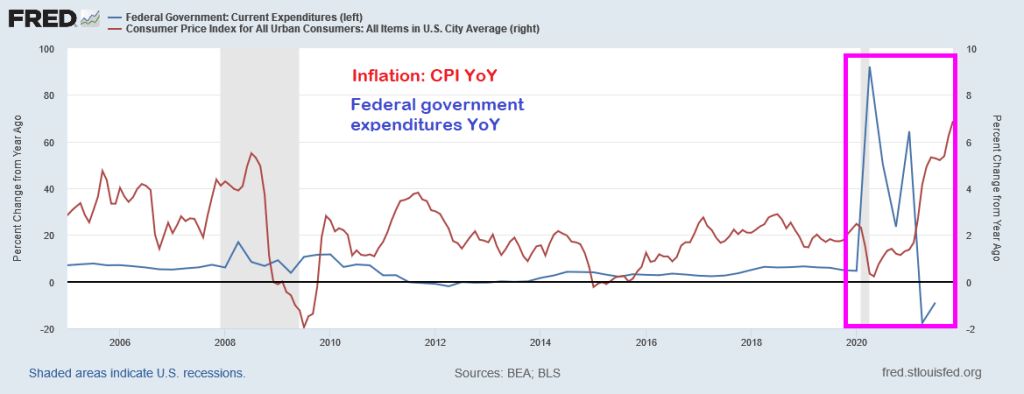
Lael Brainard, Biden’s nominee to be Vice Chairman of The Federal Reserve, has been one of the “inflation is transitory” crowd. US Senator Toomey is questioning Brainard in today’s hearing. From Toomey’s opening statement:

Last year, Governor Brainard repeatedly insisted that inflation was transitory. We have now had nine consecutive months where inflation has been more than two times the Fed’s 2% target. That makes it pretty clear that inflation is not transitory. Yesterday’s CPI release of 7.0%—the highest in 40 years—confirms that.

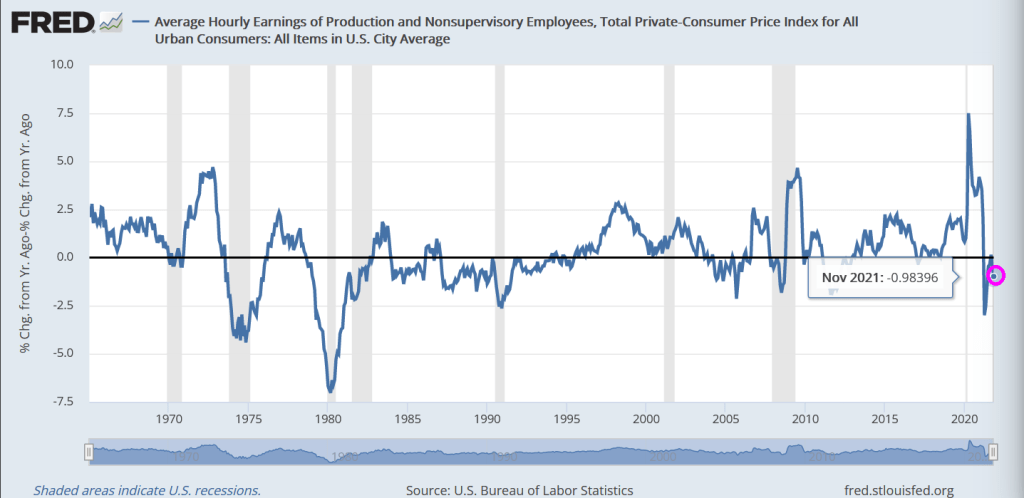
Inflation is a tax that is eroding Americans’ paychecks every day. Even though wages are growing, inflation is growing faster and causing workers to fall further and further behind.

At least the REAL mortgage rate is negative!

I hope Senator Toomey shows Brainard this chart of “transitory” negative wage growth.

Negative wage growth and negative REAL mortgage rates. What a total mess!

Tiny Or BIG Bubbles? Buffett Indicator, Shiller CAPE At Dangerous Levels Thanks To Fed And Their Champagne Policies

The Federal Reserve Open Market Committee meeting should have a Lawrence Welk bubble machine operating, particularly for their announcements.

When we look at the Buffett Indicator, we can see how The Federal Reserve’s loose monetary policies (or follycies) are driving up stocks to unsustainable levels that may not survive without The Fed’s “Do Ho Big Bubble Policies.”

How about the Shiller CAPE (Cyclically-adjusted Price/Earnings) ratio? While not up to dot.com levels yet, the Shiller CAPE ratio is climbing with the assistance of The Fed and their insane money printing.

How about house prices? The Case-Shiller National home price index is far above the level last scene during the housing bubble of 2005-2007. Again, with a little help from The Federal Reserve.

I can’t wait to see how the equity market and housing market reacts IF The Fed actually follows through with reducing monetary stimulus. Probably not just adding more stimulus, just reinvesting the Treasury and MBS proceeds (aka, not shrinking the balance sheet).

Speaking of Lawrence Welk and his Champagne Music Makers, watch the blazing-hot electric guitar work worthy of Steve Morse or Jimmy Page in this video.

Here is the new logo for The Federal Reserve.

US Treasury Yield Curve Now Back Where It Stated With Biden At The Helm (Inflation Crushing America And The Yield Curve)

It has been almost a year since Joe Biden has been President of the United States and a Democrat majority took control of The House and Senate. And what has happened to the US Treasury yield curve slope over the past year?

The yield curve is back where it started. There was the “honeymoon effect” where the curve slope rose. After all, Biden was Obama’s Vice President for 8 years and The Democrats has promised so much in the 2020 election. But by early April, the reality of the massive Federal spending (combined with Fed Stimulypto) began showing what was feared: inflation (blue line) started to grow at a rapid rate of speed. With inflation now at 6.8% YoY,

In fairness to Biden, The Federal Reserve has been overstimulating the economy since The Federal Reserve since Ben Bernanke and the Fed Open Market Committee (FOMC) dropped the hammer on The Fed Funds Target Rate once the rate hit 5.25% in September 2007. They kept cutting it reached 25 basis points (or 0.25%) in December 2008. In August 2008, Bernanke and Company began their “Quantitative Easing” or asset purchasing programs. Between The Fed’s Target Rate and QE, The Fed has continued to overstimulate markets ever since. Under Biden, The Fed Funds Target Rate remains at 0.25% and The Fed’s Balance sheet has grown to $8.79 Trillion (bigger than the entire economies of Japan and Germany put together!).

How about housing? Home prices are growing at 19% YoY while rents are growing at 12.65% YoY.

Energy prices have risen dramatically under Biden. Gasoline is up 46% despite a slight reprieve recently. WTI crude prices are up 64%.

How about food? Beef prices are up 20% and chicken prices are up 10%.

On a positive note, the S&P 500 index has soared … thanks has soared during Biden’s term thanks to Fed stimulus and Federal spending on COVID.

The Build Back Better Act if passed (in its entirety or on a piecemeal basis) will lead to even MORE inflation.

Perhaps Biden’s spokesperson Jen Psaki can recreate the Biden Administration as a lovable, hilarious family like the comic strip Gasoline Alley with old Joe Biden as Skeezix. And insider-trading star, House Speaker Nancy Pelosi as the family matriarch.

Inflation And Fed Crushing Savers (REAL 3M CD Rate At -6.74%)

The Federal Reserve’s zero-interest rate policies (ZIRP) has The Fed Funds Target Rate at a measly 25 basis points or 0.25%. While this is great for some, it is disastrous for savers. Once we subtract off the inflation rate (CPI YoY), we find that the REAL 90-day Certificate of Deposit (CD) rate is a horrifying -6.74%.

I don’t think that Congress or the Biden Administration really think about how their spending may contribute to inflation and crush savers. Or the American worker who is seeing NEGATIVE real average hourly earnings growth (yes, Biden said that Americans have more money this holiday season … but not if we account for reduced spending power, also known as inflation.

Here is US Treasury Secretary Janet Yellen singing “Goodbye Savers.”

Goodbye Savers
Will we ever meet again
Feel sorrow, feel shame
Come tomorrow, feel lots of pain

Transitory? Temporary? What Happens When The COVID Stimulus Is Removed? GameStop, Bitcoin, Ethereum, Gold And M2 Money

I love how The Federal Reserve talking heads, the media, economists like Paul Krugman, all refer to inflation as “transitory” and excessive liquidity as “temporary.”

Let’s look at a variety of alternative investments to the S&P 500, GameStop, Bitcoin, Ethereum and Gold after The Federal Reserve’s and Federal government massive (over)reaction to COVID in early 2020. Gold is the first asset to surge after M2 Money surged, but has declined since. Game Stop had a big surge (likely due to positive vibes on Reddit), but has been volatile and generally falling since “The Surge.” Bitcoin had a delayed surge as did Ethereum. Despite fear about government regulation, Ethereum in particular remains elevated.

The “temporary” stimulus has resulted in the lowest M2 Money velocity in history. And we will have to see if the “temporary” excess liquidity in the financial system is truly temporary.

Here is a chart to show the “Stimulytpo” effect on commercial and industrial loans which surged (including PPP loans) but have simmered down to pre-COVID levels.

The earnings for GameStop were terrible (down 39.7% YoY). But at least Christmas season is upon us and maybe GameStop will surge with a good retail spending season.

But what happens to markets if the Federal government “stimulypto” is removed? If it ever is.

What’s Wrong With This Picture? Fed Reverse Repo Usage Continues To Grow Along With Fed’s Balance Sheet (Reverse Repos At All-time High)

I love listening to Fed talking heads (or Fear The Talking Fed). They mostly seem to acknowledge that inflation is a problem and that the excessive monetary stimulus should be reduced.

But then I see the chart of The Fed’s balance sheet and The Fed’s reverse repo operations.

Then we have Federal Reserve Governor Christopher Waller saying that Th Fed could start raising interest rates as early as its March 15-16 meeting, after deciding to end asset purchases sooner than planned. My question is … why wait until the March meeting?

Is it fear of the Omincron Variant (which sounds like a Frederick Forsyth thriller)? Does The Fed not want to rock the boat prior to the Christmas season? The US is at or near full employment, so what is the real reason for delaying a rate increase until March or June? Or the fear that Congress won’t pass Biden’s Build Back Better Act?

Fed Funds Futures infer that one rate hike will occur at the June Fed Open Market Committee (FOMC) meeting and one at the November meeting.

So will Powell get back in the saddle again and actually do his job?

Fire! U.S. November Housing Starts RISE 11.8% MoM (Powell Is The God Of Hellfire!)

Fed Chair Jerome Powell is the God of Hellfire!

The Federal Reserve’s massive stimulus combined with Federal spending has led to US housing starts rising 11.8% in November. Housing starts remain elevated compared to pre-COVID levels.

1-unit starts rose 11.29% while 5+ (multifamily) starts rose 12.1% in November. All areas in the US saw growth except for the Midwest where starts fell by 7.27%.

Yes, with Powell leaving rates untouched … again … in The Fed’s effort to … not scare markets. Inflation be damned. Powell is the God of Hellfire!

The Fed Is the Main Inflation Culprit (But Federal Government’s Spending Spree Was The Icing On The Inflation Cake)

There was an interesting op-ed in The Wall Street Journal entitled “The Fed Is the Main Inflation Culprit”.

If price stability is squandered, financial stability is put at risk. If financial stability is lost, the economy is imperiled and the social contract is threatened.

During the past several quarters, U.S. inflation has surged—now running about triple the Federal Reserve’s 2% target. The surge in prices is unlikely to reverse on its own. The longer that prices are unstable, the greater the challenge to the conduct of macroeconomic policy. The last thing the country needs is its third major economic upheaval in a decade and a half.

The consequences of inflation—and the attendant risks—have long been understood. In 1898 economist Knut Wicksell explained: “Changes in the general level of prices have always excited great interest. Obscure in origin, they exert a profound and far-reaching influence on the whole economic and social life of a country.”

I agree with the op-ed, but as Paul Harvey liked to say, “And now for the rest of the story.”

The Federal Reserve is only half of The Federal government “Stimulypto.” Starting in late 2008, The Fed crashed their target rate to 25 basis points and began their quantitative easing (QE) program where The Fed purchased Treasuries and Agency Mortgage-backed Securities (MBS) amongst other assets. Notice in the chart below that QE was adjusted, but never went away and The Fed’s target rate only was increased once before Trump’s election as President, then raised eight times then decreased five times. And no rate increases under Biden. So The Fed scorecard is Obama/Biden: 1 rate increase. Trump: 13 rate changes. And The Fed’s balance sheet has gone bananas since the COVID outbreak.

Inflation, as measured by the Consumer Price Index (CPI) didn’t really take-off until March 2021 as a result of STIMULYPTO (excessive monetary stimulus + Federal government spending).

Here is the Federal government spending surge that helped generate the highest inflation in a generation.

So while the op-ed author blames inflation solely on The Federal Reserve, The Fed was unable to achieve its inflation goal for much of the post-financial crisis period. It was the double whammy of Fed monetary stimulus + Federal government stimulus (spending) that pushed inflation to 6.8%.

Following Paul Harvey’s “The Rest of the Story,” I choose baseball player Whammy Douglas to represent the double whammy of Fed + Fed government stimulus to produce inflation. THAT is the rest of the story.

Throw in the Biden Administration’s war on fossil fuels (driving up energy costs by over 50%) and we have a TRIPLE WHAMMY!!

The WSJ op-ed author was focused only blaming The Fed. Sorry, it was a Double Whammy.

UMich Buying Conditions For Housing PLUNGES To 63 Due To Outrageous Home Price Growth & Lessons From The Yellen Pivot

Just look at this chart of the University of Michigan Buying Conditions For Houses index. It was positive (meaning above 100) until shortly after COVID struck and The Federal Reserve rode to the rescue. National home price growth was already at 4.57% YoY in March 2020, then ballooned to 19.51% YoY at the last reading.

Here is the same chart with the broader M2 Money stock and The Fed’s Balance sheet. Same results, just not as dramatic as M1.

We will soon find out if The Federal Reserve will announce a rate hike or taper news. They are likely to confirm tapering, particularly if they believe that tapering won’t roil markets. After all, then Fed Chair Janet Yellen and the FOMC decided to let the Fed’s balance sheet taper (white line) while, at the same time, increasing the Fed’s target rate (yellow line). The S&P 500 index rose 9.5% over the taper/rate increase period of 12/29/2017 to 8/30/2019.

But since Stimulypto (2/28/2020 to 11/30/2021), the Fed’s balance sheet doubled+ from $4,158,637 to $8,681,771. And The Fed Funds Target Rate (UB) immediately fell from 1.75% in February 2020 to 0.25% in March 2020 … and has stayed there ever since. The S&P 500 index rose 54.6% over this Stimulypto period.

But The Fed’s upcoming decision on December 15, 2021 may be a Yellen-pivot (taper balance sheet, but raise The Fed Funds Target rate). But, then again, maybe not. The Fed is getting really bad about forward guidance and choose instead to surprise us. Hence, this is why an a-political rule is preferred (such as the Taylor Rule).

Unfortunately, the Taylor Rule infers a Fed Funds Target rate of 15.50% (using CPI YoY running at 6.20% YoY. If The Fed raises their target rate by 25-50 basis points at the December 15th meeting, color me surprised.

So, the Powell Pivot may just be the Yellen Pivot after all.

Is The US Engaged In A Monetary Cold War With Russia? (Or Will The US Become A Tightener Rather Than A Loosener?)

Is the US engaged in a monetary cold war with Russia? It looks that way if we consider the Index of Global Easing and Tightening from the Council of Foreign Relations.

Russia and Brazil are tightening along with Mexico, Colombia, Peru, Argentina and Chile. Add Pakistan, The Czech Republic and Poland to the list of tighteners.

The looseners? The US, of course, with Canada, Australia, China, India, Western Europe, Turkey and Nigeria. New Zealand is the quickest loosener.

This looks very cold war-like. But a monetary cold war.

Let’s see if The Fed becomes a tightener rather than a loosener.