Trying to survive high inflation is difficult, but surviving The Federal Reserve’s counterattack to inflation is even more difficult.
Two people who constantly appear in the business are ARK’s Cathie Wood and TSLA’s Elon Musk. A third we can add is Sam Bankman-Fried of FTX and Alameda Research infamy.
So which one was the best at surviving inflation and The Fed’s counterattack? Answer? None of them.
Since the same day last year, we have seen M2 Money growth plunge and The Fed Funds Target rate rise rapidly from 25 basis points to 4.50%, a rapid increase. But over the last year, Cathie Wood and ARK fell -68.4%, Elon Musk’s Telsa fell -68.9% and Bitcoin fell -65.1%
So, ARK, Tesla and Bitcoin were demolished in 2022 thanks to inflation and The Fed’s counterattack. But the NASDAQ index was down too, but only -35.2% YoY.
Do I detect a trend in the US Leading Economic Indicator data?
The Conference Board’s US Leading Economic Indicator was released this morning and it wasn’t pleasant. The US Leading Index was down -1% MoM in November.
On a year-over-year basis, it is down -4.5% YoY as The Fed withdraws its massive monetary stimulus.
The good news … for military contractors … is that Biden and Congress have given Ukraine’s Zelenskyy ANOTHER $47 BILLION.
Like the Mel Gibson movie “Apocalypto!”, we are seeing the US middle class and low-wage workers being economically sacrificed by The Federal Reserve, the Biden Administration and Congress.
Despite the rhetoric that Fed stimulus (aka “Stimulypto!”) is being removed, the US remains plagued by NEGATIVE real 10-year Treasury yields, NEGATIVE real Fed Funds Target rate and NEGATIVE real average hourly earnings growth under Inflation Joe.
This chart demonstrates the Stimulytpo problem. Prior to Covid, US wage growth was consistently higher than headline inflation. But starting in March 2021, three months after Biden became President, headline inflation became higher than wage growth.
Even with all these negative REAL rates, the US economy is forecast to have almost no growth in 2023.
To quote Peggy Lee, Is That All There Is? Trillions in Federal spending and Fed monetary stimulus and all we get it 0.50% Real GDP??
Apparently, despite the denials from the Biden Administration, someone at Bureau of Labor Statistics or someone in Congress or the Federal Reserve or the Biden Admininstration itself likely tipped the wink on the soft CPI report on Tuesday.
Treasuries were well on the front-foot in the lead up to the below-estimate November CPO print, as a surge of buying took place seconds before the official 8:30 am New York release time. Over a 60 second period before the data, 13,518 March 10-year futures traded as the contract moved from 114-04+ up to 114-22. Gains were then extended up to 115-11 session highs once the data was released.
On the equity side, stock futures suddenly spiked more than 1%. Trading in Treasury futures surged, pushing benchmark yields lower by about 4 basis points. Those are major moves in such a short period of time — bigger than full-session swings on some days. And they should get scrutinized by regulators, long-time market observers say, even if a leak is only one of several possible explanations for why traders suddenly started buying right before the report was published.
Remember that current Treasury Secretary Janet Yellen was accused of leaking information to a NY hedge fund ahead of the Fed Open Market Committee meeting? And then we have the Wolf of Wall Street.
I wonder if the REAL Wolf of Wall Street did this?
Central bankers won’t ride to the rescue when growth slows in this new regime, contrary to what investors have come to expect. They are deliberately causing recessions by overtightening policy to try to rein in inflation. That makes recession foretold. We see central banks eventually backing off from rate hikes as the economic damage becomes reality. We expect inflation to cool but stay persistently higher than central bank targets of 2%.
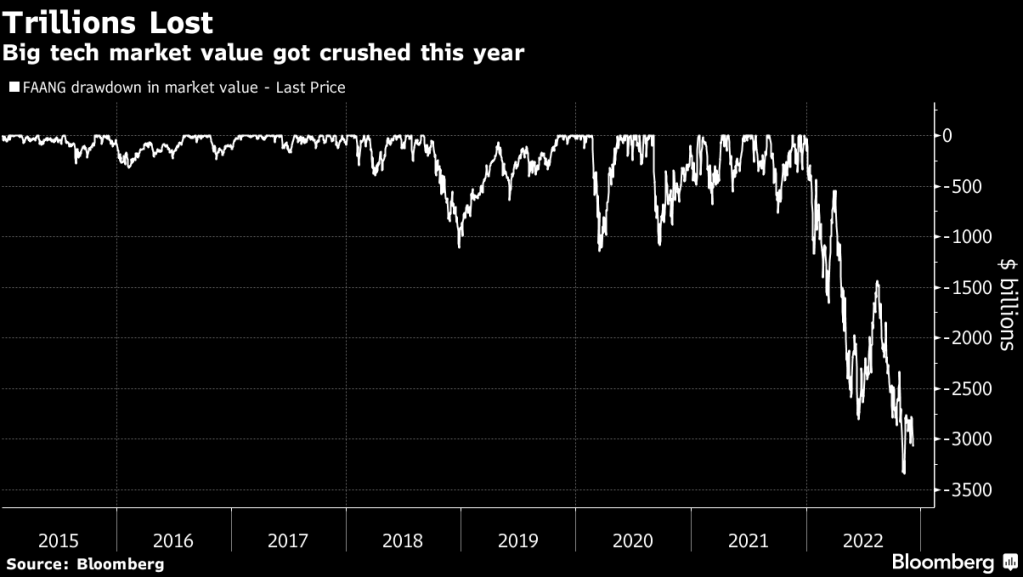
For some investors, this year’s rout in high-flying technology stocks is more than a bear market: It’s the end of an era for a handful of giant companies such as Facebook parent Meta Platforms Inc. and Amazon.com Inc.
Those companies — known along with Apple Inc., Netflix Inc. and Google parent Alphabet Inc. as the FAANGs — led the move to a digital world and helped power a 13-year bull run. And FAANG drawdown have reached over $3 trillion.
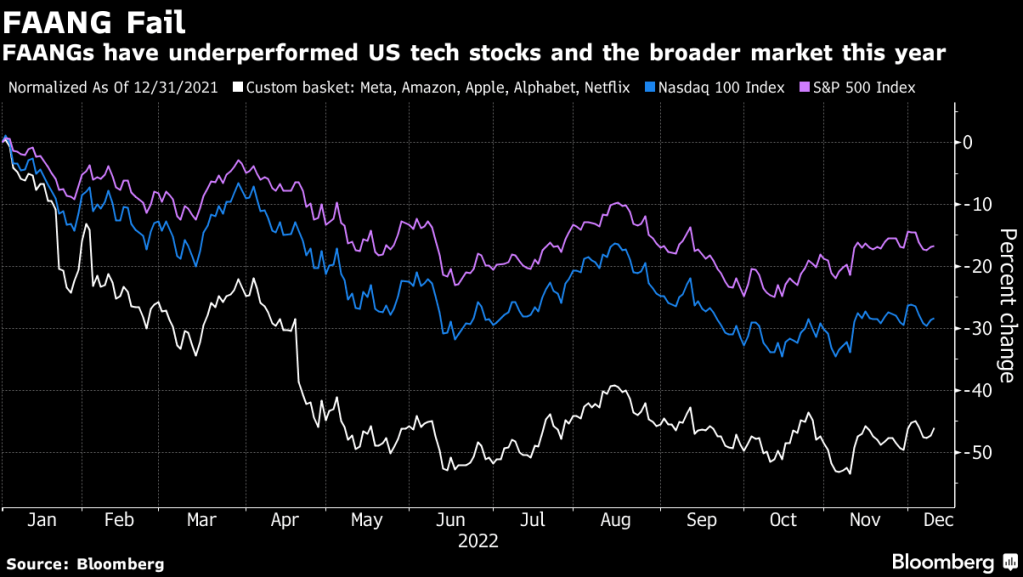
FAANGs (Meta, Amazon, Apple, Alphabet, Netflix) are getting clobbered in 2022.
Typically, when The Fed prints too much money, such as 10% or higher (red line), inflation follows. Particularly when The Fed prints at 25% YoY in Q4 2020, it was followed by the highest inflation rate in 40 years. But if M2 Money continues to slow, inflation will likely slow, but not to The Fed’s target of 2%.
Despite what Minneapolis Fed’s Neal Kashkari said about The Fed having infinite printing resourses, The Fed is going to fight inflation THAT THEY HELPED CAUSE. Biden’s energy policies (did you see that Elon Musk has a car that uses plentiful hydrogen?), and excessive Federal spending by Biden/Pelosi/Schumer, are culprits in creating the supply chain problems facing America. BUT after the 25% surge in M2 Money in 2020 and 2021, we saw M2 Money VELOCITY crash and burn to its lowest level in history. Which means the “bang for the buck” for printing more money is negligible.
Of course, big tech firms got caught influencing the 2020 Presidential election (see Musk’s release of Twitter files) and engaged in restriction of the 1st Amendment (Freedom of Speech). How much will that impact FAANG stocks going foward?
And yes, the US Treasury yield curve is inverted pointing to a recession in 2023.
And yes, apparently Biden was complicit in the Twitter fiasco.
The good news for Americans? The global slowdown is helping to lower US Treasury yields which, in turn, helps to help to lower US mortgages rates. Kind of a perverse “good news” story when you think about it.
The bigger picture is the slowdown caused by 1) a global economic slowdown and 2) the tightening of Fed monetary policy to fight inflation.
Look at the Case-Shiller national home price growth YoY (blue line) against M2 Money growth YoY (green line). Just move the green line to the right and it covers home price growth. Both are slowing down with anticipated Fed rate hikes (red line) now at 50 basis points for the December 14th FOMC meeting. And note that The Fed’s balance sheet (orange line) has barely budged.
The Fed has signaled the terminal rate will likely be around 5% — we think an upper bound of 5% — reached in early 2023. To get there, the central bank will likely raise rates by 50 basis points at its December 2022 meeting, followed by two more 25-bp hikes in 2023. We then see it holding at 5% throughout the year. Markets have priced in a similar amount of tightening.
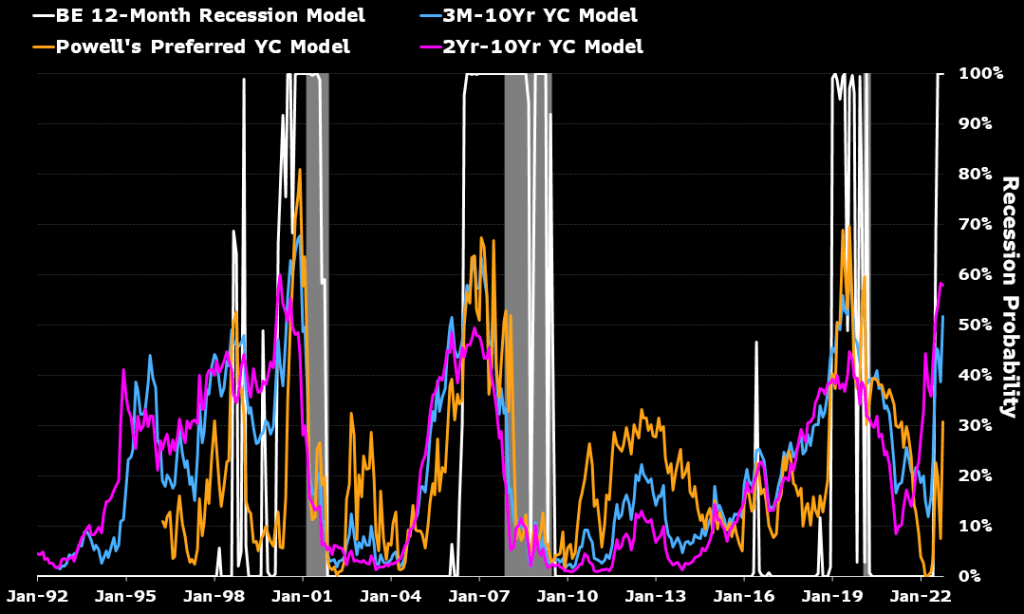
Controlling inflation comes at a cost to growth. Yield curves have inverted. A Bloomberg Economics model shows a 100% probability of recession starting by August 2023. Take that — like all model forecasts — with a grain of salt. But the basic view that aggressive Fed tightening will very likely tip the economy into a downturn is correct.
While various measures of impending US recession show a good chance of a 2023 recession, Powell’s preferred measure of the yield curve shows only a 30% chance.
What Might the Recession Look Like?
We project a 0.9% GDP contraction in 2H 2023, driven by an investment downturn as firms pare inventories amid a downshift in consumption. Residential investment will also contract with real interest rates likely to rise steadily throughout 2023 as nominal rates stay high and inflation moderates.
An Inventory-Led Downturn
Resilient consumption should help put a floor under demand.
Households have enough of a cash buffer — extra savings built up over the course of the pandemic, rising COLAs for Social Security recipients, ongoing state and local government stimulus and solid 2022 wage income growth — to sustain consumption during the recession. Our base case is for real spending to grow at a quarterly annualized pace of about 0.5% in 2023, with strength concentrated in services.
By one measure, households may still have $1.3 trillion in the coffers, based on flows within the personal income report through September. At the current rate of drawdown, that’s enough to last around 15 months, or through the end of 2023. Funds may dry up faster as job losses mount and the unemployed fall back on their savings.
$1.3 Trillion Extra Savings to Keep Spending Positive
The labor market remained exceptionally tight into the end of 2022. We expect it to soften significantly next year, with the unemployment rate rising to 4.5% by the end of 2023. The pace of hiring will slow markedly as support from catch-up hiring dissipates and the effects of restrictive monetary policy settle in. We estimate only 20%-30% of total employment is still in sectors experiencing labor shortages, implying demand for labor is falling fast.
Avoiding a Hard Landing Depends on Inflation, Fed
Extreme circumstances — the pandemic, Russia’s invasion of Ukraine — have made a recession more likely than not. Extreme circumstances can change, and so can policy makers’ response Whether the US can stick a soft landing depends substantially on how external conditions develop and how the Fed responds.
Not our base case, but we can envision a scenario in which the central bank opts to ease rates in 2023, boosting the chances of a soft landing.
One way that could happen is inflation falling faster than expected. Currently, our baseline is for headline CPI to drop to 3.5% and the core to 3.8% by the end of 2023. The most important assumption there is that energy prices remain flat next year from 2022.
In an alternative scenario, inflation fall faster as China maintains Covid controls and growth stumbles. A Bloomberg Economics model attributes the recent fall in oil prices entirely to a drop in demand — mainly from China. If China’s growth falls off the cliff, perhaps amid a sharp rise in Covid cases and resumed lockdowns, commodity prices could tumble sharply.
A warm winter in Europe and the US could also keep energy prices in check. Lower demand from Europe for US liquefied natural gas would help stem the increase in domestic electricity prices.
In that scenario, US energy prices could fall 20% in 2023 and headline inflation may drop to 2% by the end of the year. Lower gasoline prices would work to soften inflation expectations, easing pressure on the Fed to hold rates at higher level. A rate cut could then come in 2H 2023, raising the possibility of a soft landing.
Scenarios of CPI Inflation in 2023
The risk cuts both ways. A quick and successful pivot to reopening in China could boost oil and other commodities prices. A colder winter in Europe and the US would generate upward pressure for electricity and utility prices. Assuming China is fully open by mid-2023 — the base case for our China team — energy prices could increase by 20% in the year. In that case, headline US CPI would hit a bottom of 3.9% in midyear before surging to 5.7% by year-end.
In that scenario, the terminal fed funds rate would most likely top 5%, possibly closing 2023 near the upper end of St. Louis President James Bullard’s estimated restrictive range of 5%-7%.
Bloomberg Economics US Forecast Table
Thanks to Yellen’s legacy of too low interest rates for too long, The Fed is playing catch-up by finally raising rates.
We are truly living in Strange Days under Joe Biden. And with Elon Musk’s release of Twitter’s suppression of the Hunter Biden laptop scandal, they call Joe Biden the Sleaze.
As The Federal Reserve tries to crush Bidenflation, we are seeing Fed Remittances to the US Treasury soaring (white line). At the same time, we see the Biden Administration draining the Strategic Petroleum Reserve (orange dashed line). And as The Fed tightens, M2 Money growth crashes (green line).
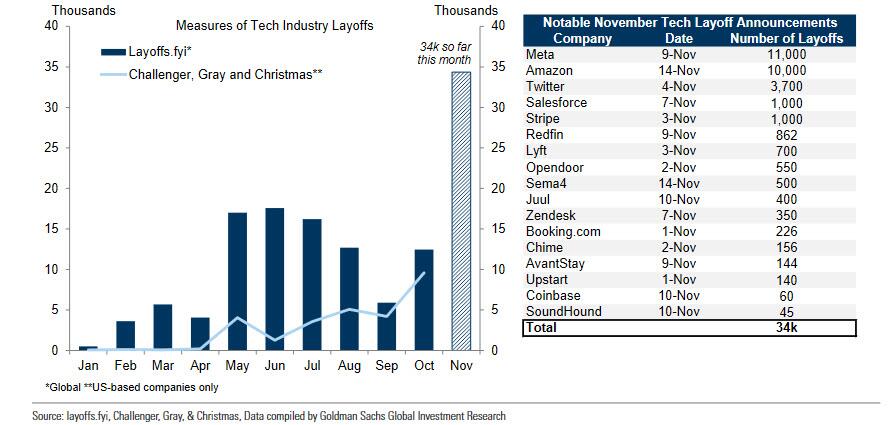
And with tech layoffs, I predict that 2023 job growth will be pretty bad.
As I have discussed before, I am a fan of ADP’s job reports and not a fan of the BLS NFP reports. As M2 Money growth slows, we can see declining ADP jobs added (yellow line), but BLS’s NFP report shows huge spikes.
Lastly, we have Sam Bankman-Fried and FTX. SBF should be in custody for being involved in one of the biggest fraud cases in history, but like Hunter Biden, is roaming free and trying to raise MORE funds. Why are these lapses in justice occuring with “10% for The Big Guy” Biden?
Yes, The US Treasury 10Y-2Y yield curve remains inverted, for the 104th straight day. And Bankrate’s 30-year mortgage rate has dropped -57 basis points since November 3, 2022.
This comes after a gruesome Pending Home Sales and mortgage applications reports today.
The hawkish drumbeat from central bankers is raising fears of a downturn, with global bonds joining US peers in signaling a recession, as a gauge measuring the worldwide yield curve inverted for the first time in at least two decades.
The US Treasury 10Y-2Y yield curve, on the other hand, has been inverted for 107 straight months.
And in Europe, 10-year sovereign yields are dropping like a paralyzed falcon.
The world and US yield curves are pointing to trouble. And drums along the Potomac (DC) and East River (NYC).


You must be logged in to post a comment.