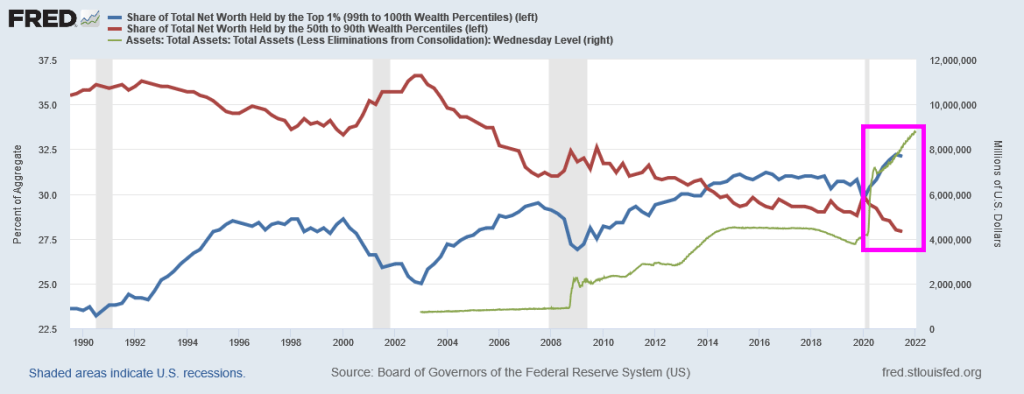
Since the 2020 Covid outbreak, the top 1% have been on the Stimulypto gravy train. The top 1% in terms of share of total net worth (blue line) is near the all-time high while the bottom 50% share of total net worth (red line) is at the all-time low.
So, you thought all that Covid relief spending along with Fed monetary stimulus would help the bottom 50%?
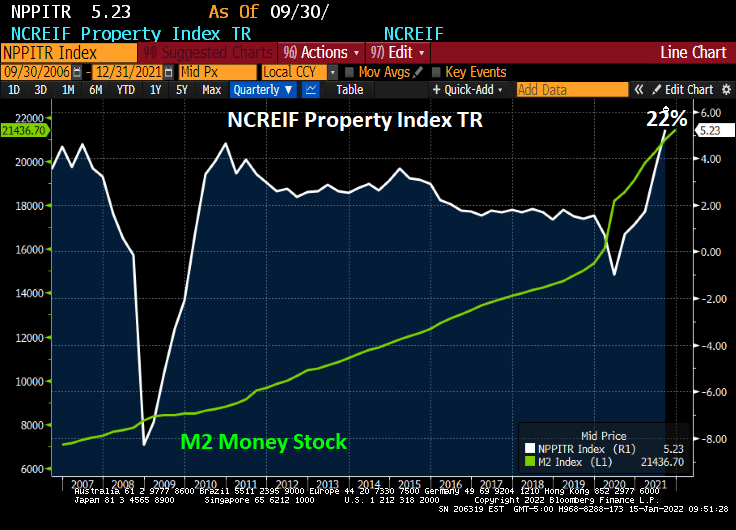
Inflation is burning out of control. While home price growth has been off the cherts (as Jean-Ralphio would say), commercial real estate has jumped incredibly at 22% YoY. The Bloomberg charting function hasn’t updated for the Q4 NCREIF report yet so I had to manually write-in 22% on the following chart.
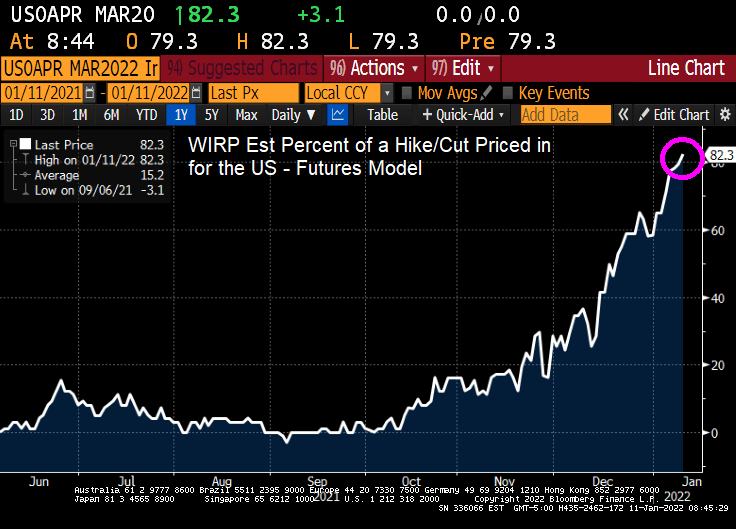
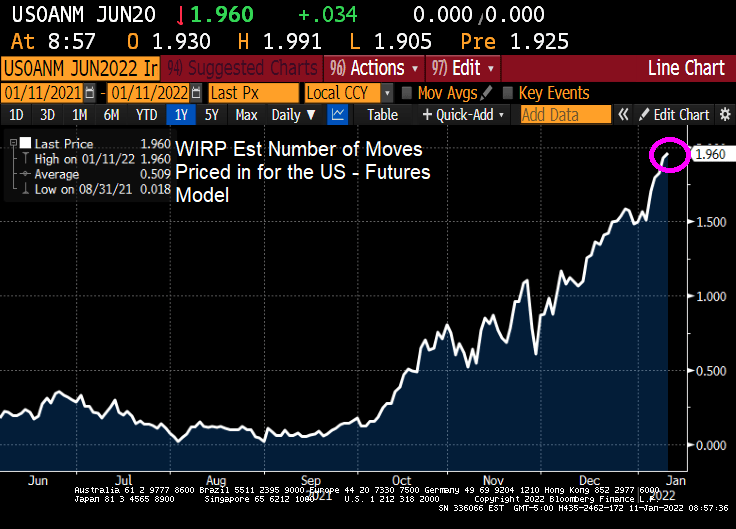
So, what will happen IF The Fed follows through with its monetary stimulus reduction? JPMC’s Jaime Dimon warns that The Fed could hike 7 times in 2022 and not be ‘sweet and gentle’.
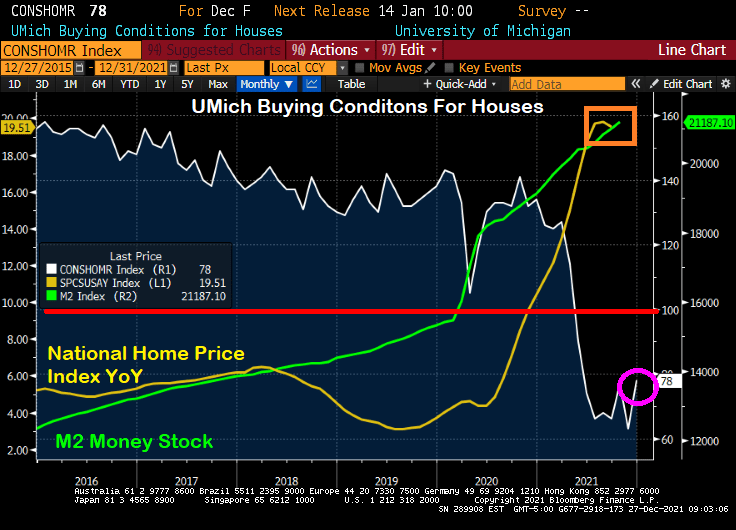
Start with the UMich Buying Conditions for Houses. It “rose” to 83. Unfortunately, 100 is the baseline and any number below 100 is bad. The reason? The massive increase in US home prices since 2020.
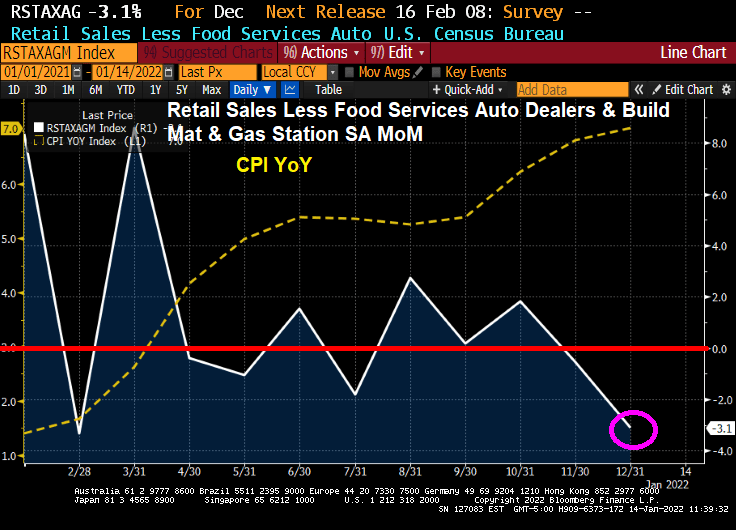
But retail sales are hurting thanks to higher prices. Retail sales less food services and auto are DOWN 3.1% MoM.
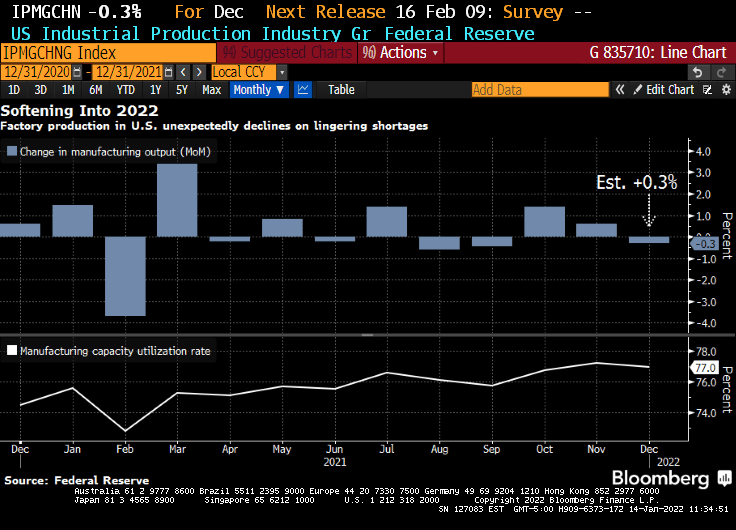
Meanwhile, US industrial production fell to -0.3%.
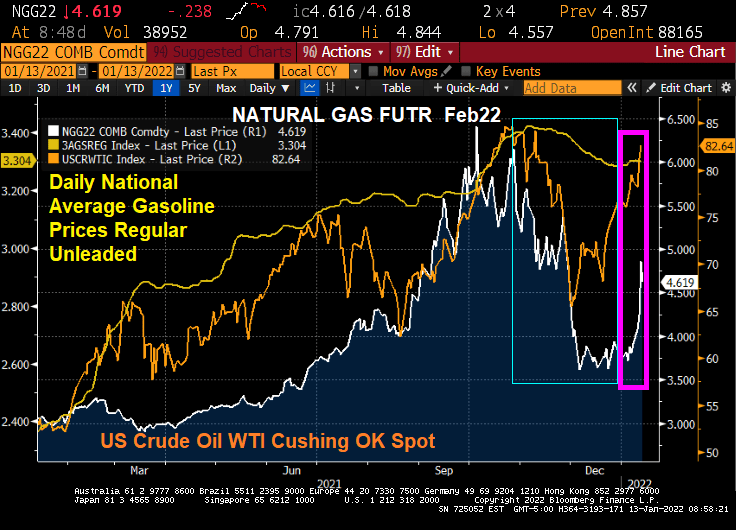
Ever wonder why prices are rising so fast? One reason is that with rapidly rising energy prices under the Biden Administration, the costs are getting passed-through to consumers in the form of higher prices.
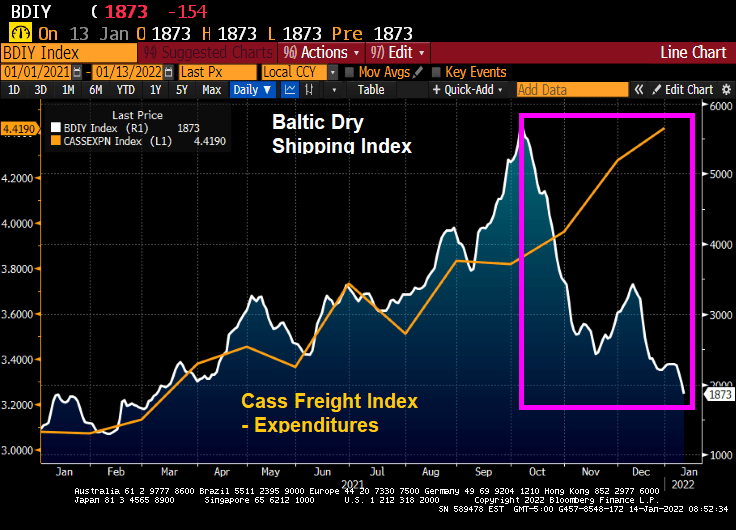
According to the Cass Corp Freight Index, the total spent in December on shipping goods to their customers in the US spiked by 43.6% from December 2020 to December 2021. Not surprising since energy prices over the past year have soared by almost 50%.
But at the same time, the Baltic Dry index (The Baltic Dry Index (BDI) is a shipping and trade index created by the London-based Baltic Exchange. It measures changes in the cost of transporting various raw materials, such as coal and steel) is crashing thanks to FEAR created by Omicron.
And yes, energy prices are surging again in 2022 after cooling off in Q4 2021.
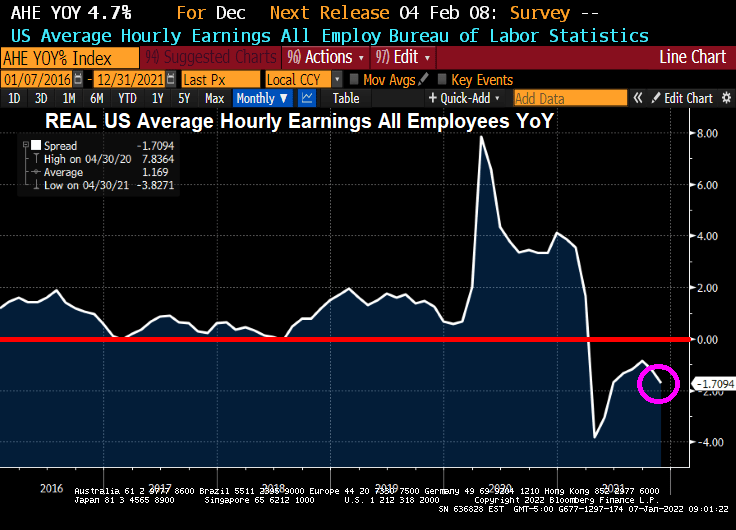
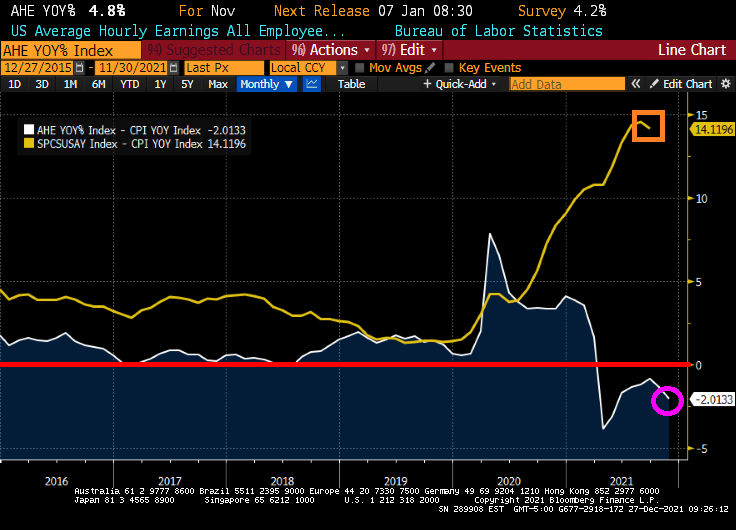
The November jobs report is out and the highlight is that US Average Hourly Earnings GREW at a rate of 4.7% YoY. Unfortunately, inflation is still raging resulting in REAL US Average Hourly Earnings DECLINING at a rate of -1.71% YoY.
REAL US home price growth is slowing and is at 12.856% YoY as REAL average hourly earnings slowed to -1.7094% YoY.
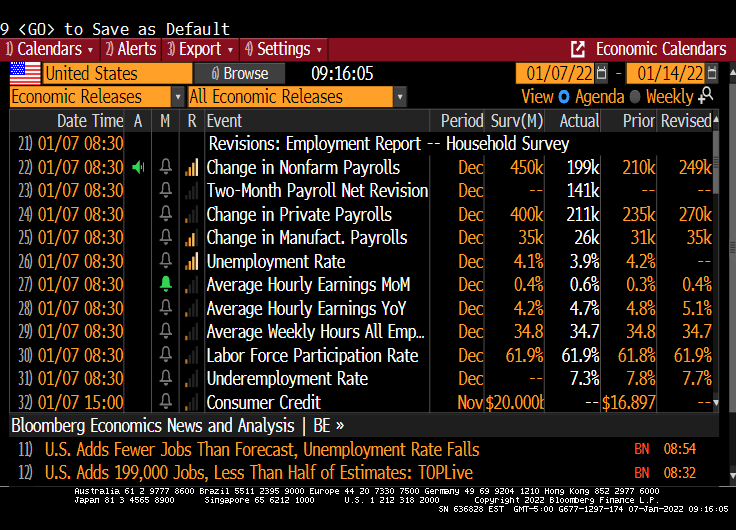
The lowlight of the November jobs report is that only 199K jobs were added versus the 450K jobs expected to be added. At least the unemployment rate fell to 3.9%.
WHERE we the jobs added? Leisure and hospitality led the way! Hey bartender.
Yes, REAL wage growth and REAL home price growth are slowing.
When we look at the Buffett Indicator, we can see how The Federal Reserve’s loose monetary policies (or follycies) are driving up stocks to unsustainable levels that may not survive without The Fed’s “Do Ho Big Bubble Policies.”
How about the Shiller CAPE (Cyclically-adjusted Price/Earnings) ratio? While not up to dot.com levels yet, the Shiller CAPE ratio is climbing with the assistance of The Fed and their insane money printing.
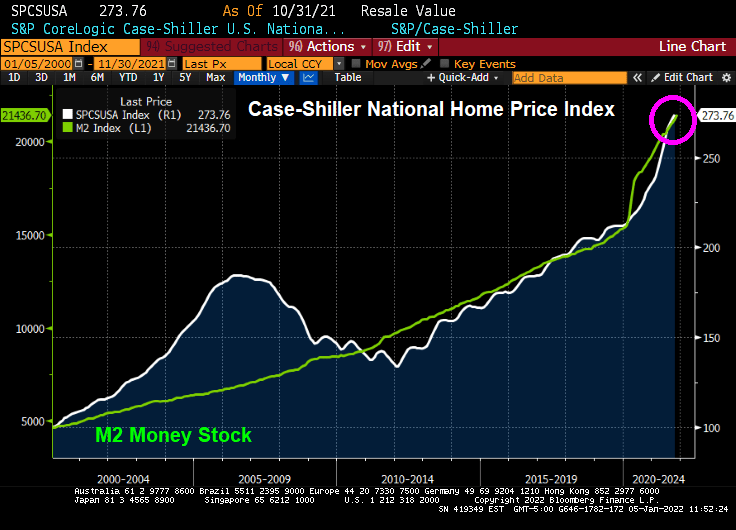
How about house prices? The Case-Shiller National home price index is far above the level last scene during the housing bubble of 2005-2007. Again, with a little help from The Federal Reserve.
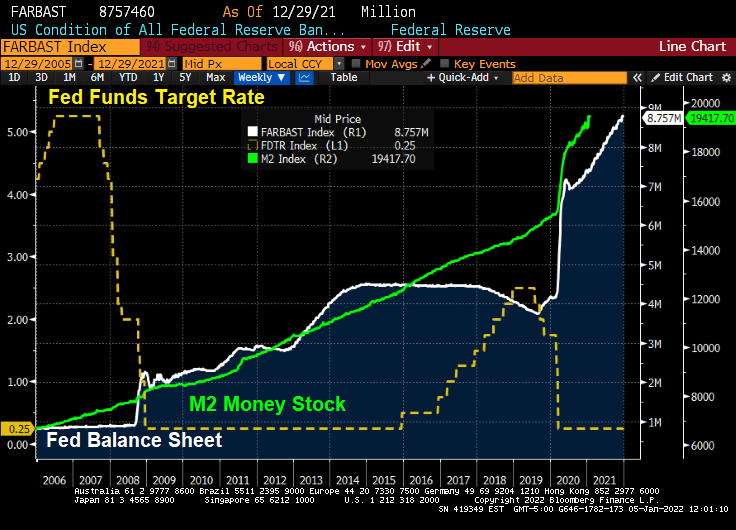
I can’t wait to see how the equity market and housing market reacts IF The Fed actually follows through with reducing monetary stimulus. Probably not just adding more stimulus, just reinvesting the Treasury and MBS proceeds (aka, not shrinking the balance sheet).
Treasury yields rose a second day, with five-year rates hitting the highest since before the pandemic took hold in the U.S., amid increasing conviction that the Federal Reserve will raise rates at least three times beginning in May.
The five-year Treasury note’s yield climbed as much as 3.8 basis points to 1.392%, the highest since Feb. 20, 2020, while 30-year yields bumped up toward their 200-day moving average.
Yields across the curve are rising for a second straight day, after Monday’s selloff lifted the 10-year note’s yield by nearly 12 basis points in its worst start to a year since 2009. The two-year yield topped 0.80% for the first time since March 2020.
At the 10-year mark, we see Canada’s sovereign notes rising 18.7 basis points.
Also at the 10 year mark, we see the US 1-year breakeven inflation rate (red line) surging.
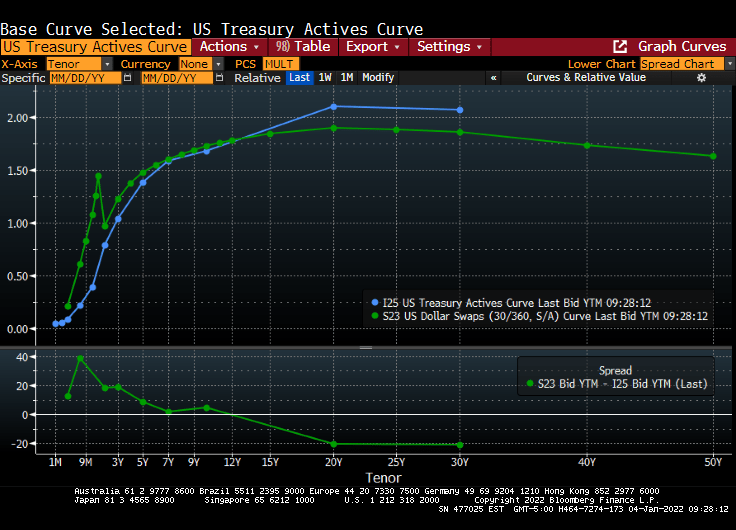
The US Treasury actives curve and Dollar Swaps curve remain steeply upward sloping.
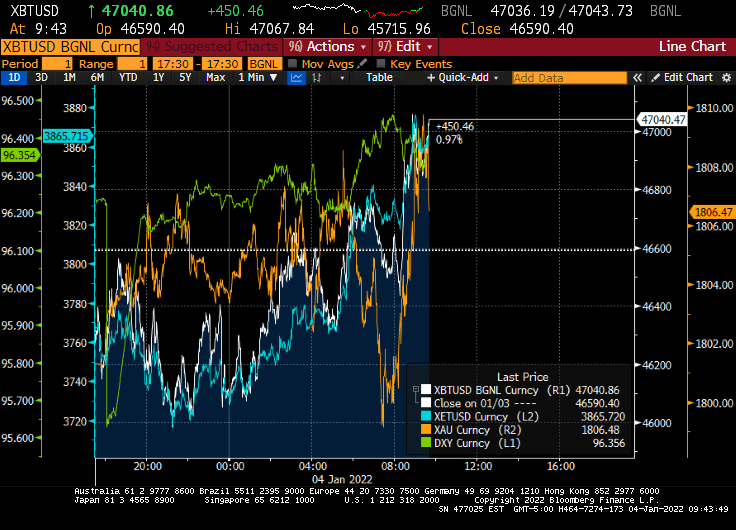
And on the crypto and gold front, gold surged this morning after tanking in the evening, while Ethereum (blue) is doing quite well along with Bitcoin.
My favorite non-bond, non-alt investment chart. The S&P 500 index charted against The Fed’s M2 Money Stock.
Following my friend Jesse’s habit of posting great French food dishes, here is one from my favorite Parisian eatery, Le Duc de Richelieu. Mmmmmmm.
Housing in the US is getting “simply unaffordable.” And it has gotten far worse over the past year. Thanks to BAD government policies.
While wage growth is positive, inflation is sucking the life from consumers. REAL average hourly earnings growth is -2.0133%. Even worse, home prices are rising at a 14.12% pace in REAL terms. So, wages are losing to inflation and housing is pulling away from renters in terms of affordability.`
So it is not surprising that the University of Michigan consumer survey for “Buying Conditions For Housing” remains below 100 (meaning that more people think buying conditions for housing are negative than positive). With the Case-Shiller National home price index growing at a 19.51% YoY pace, it is no wonder that consumers are getting scared of the housing market.
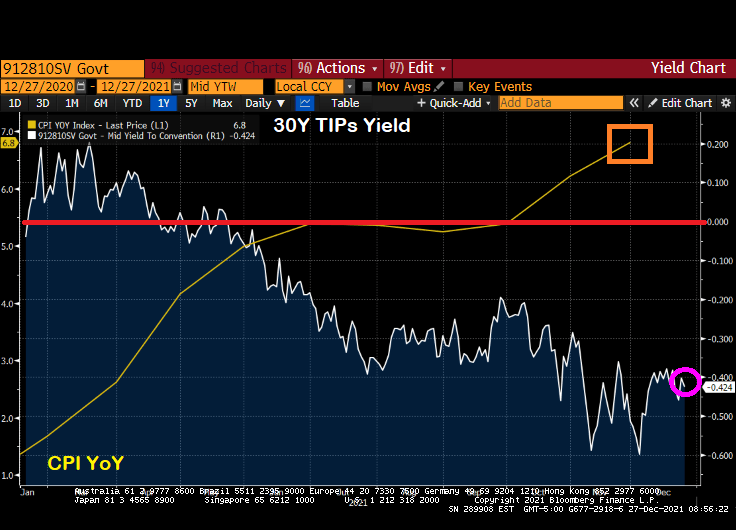
Yes, US inflation is at a 40-year high and the 30-year Treasury Inflation Protected (TIP) yields is at -0.424%. That says quite a bit about the pickle US consumers are in.
US consumer confidence overall has declined to the lowest level since just after the financial crisis and housing bubble burst of 2008-9.
Doctor, Doctor (Yellen), please don’t try to make housing more “affordable” which will result in housing being even LESS affordable.
But I do like how Biden took credit for lowering gasoline prices a little after his anti-energy policies drove up gasoline prices in the first place from $2.20 to $3.40 a gallon, a 55% price increase. Thanks for nothing, Joe!
And with Omicron raging (with few reported deaths), Anthony Fauci, President Biden’s top medical adviser, indicated support for making vaccinations a requirement for domestic fights.
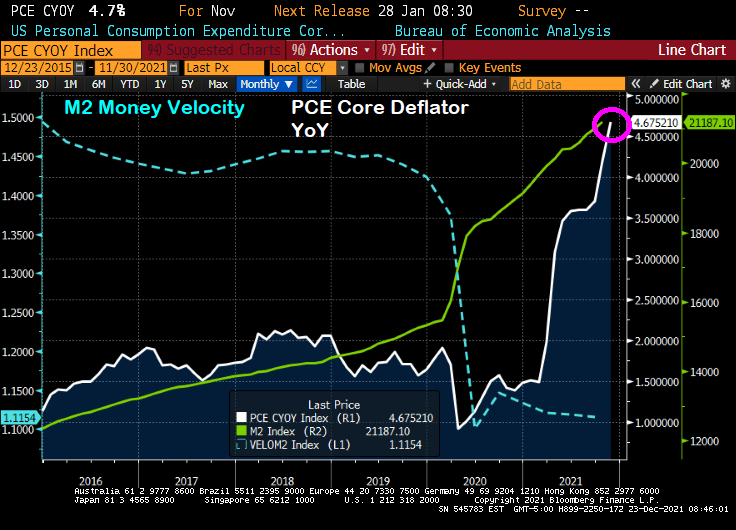
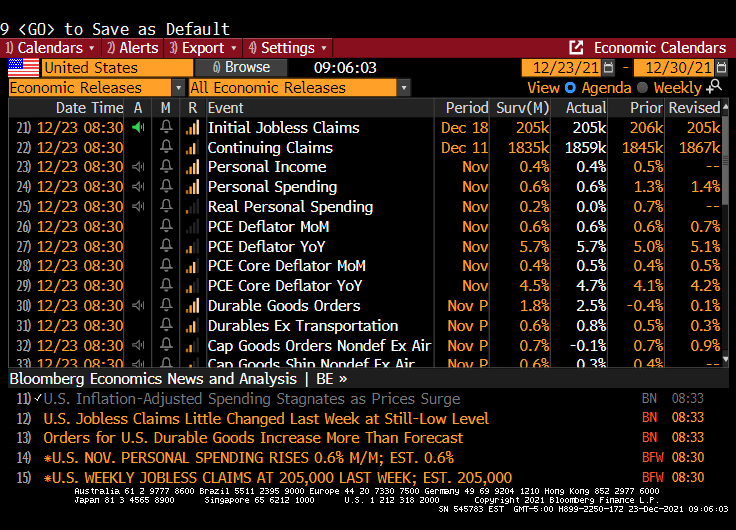
The core Personal Consumption Expenditures (PCE) deflator numbers for November were released this morning and the print was a whopping 4.7% YoY, the highest rate since 1989.
Meanwhile, U.S. consumer spending, adjusted for inflation (aka, REAL personal spending), stagnated in November as the fastest price gains in nearly four decades eroded purchasing power. Stagnated to 0.
Purchases of goods and services, after adjusting for higher prices, were little changed following a 0.7% gain in October, Commerce Department figures showed Thursday.
And as Paul Harvey would say, here is the rest of the story.
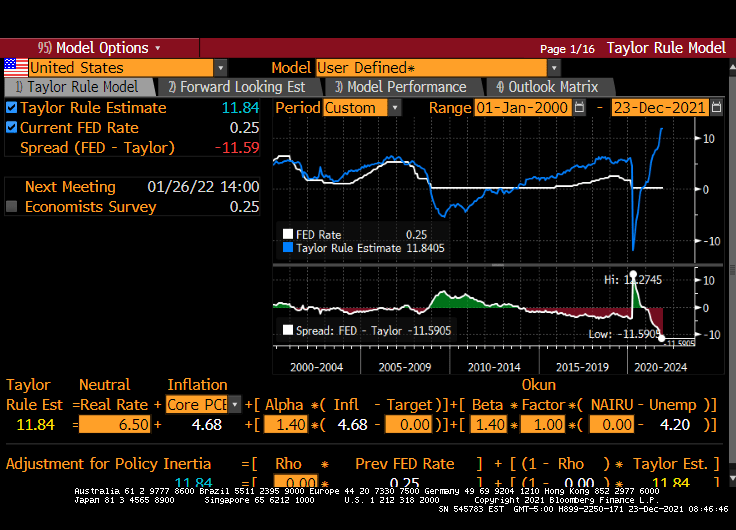
Core PCE growth YoY of 4.68% implies a Fed Funds target rate of 11.84%. Powell and the gang have the target rate at 0.25%. But the Taylor Rule doesn’t take into account the latest FEAR raging in Washington DC … the Omicron variant. Just another excuse for The Fed to do nothing and let asset bubbles blow out of control.


You must be logged in to post a comment.