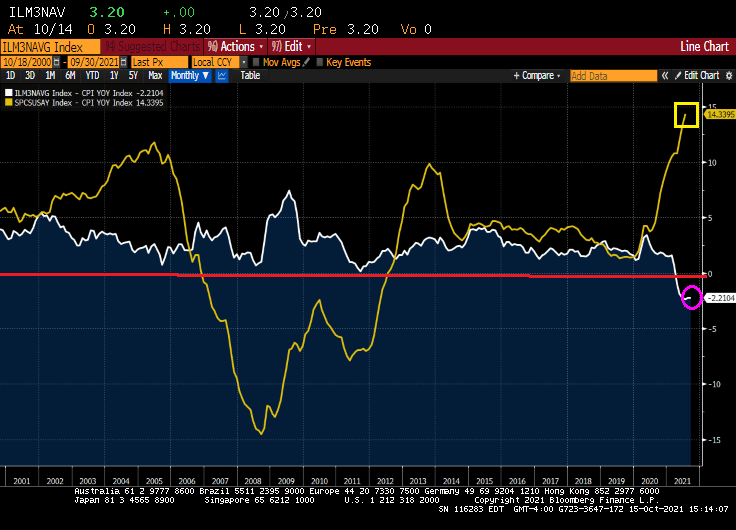
This is a time even unlike the disastrous housing bubble of the 2000s that led to the financial crisis and Great Recession. Even during the housing bubble years, we still had positive REAL mortgage rates: Bankrate 30Y Fixed rate – CPI YoY. But today we have even FASTER REAL home price growth and NEGATIVE mortgage rates!
And yes, REAL home price growth is 14.34% YoY while REAL hourly earnings growth is -0.79%.
The University of Michigan consumer survey came out today and buying conditions for housing improved to 75. Which means that more people were negative than positive due to skyrocketing home prices.
With negative 30Y mortgage rates and rising apartment rents, is it time to buy? Just remember what happened to Leon in Blade Runner.
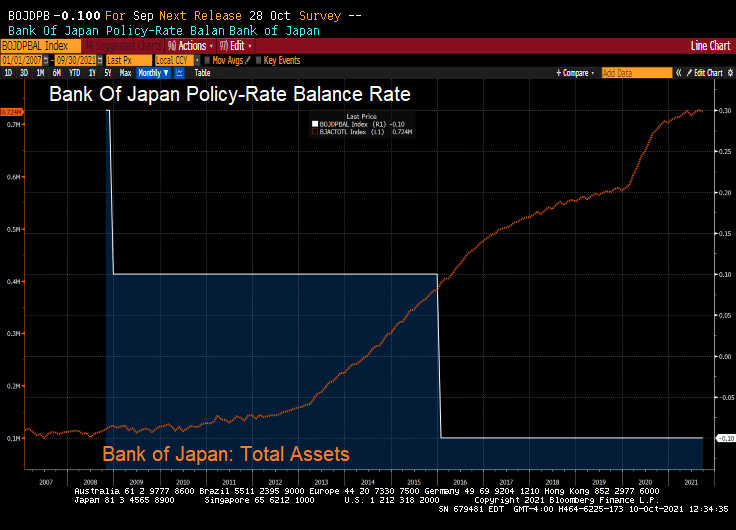
What’s left of it is that the BoJ (and Bank of Japan Governor Haruhiko Kuroda) now holds about half of the huge pile of the central government’s debt. With their target rate at -0.10% and a gargantuan balance sheet, what could go wrong?
But BOJ’s QE has ended. The BoJ’s overall assets stopped growing, and its holdings of government bonds have started to decline.
As of the BoJ’s balance sheet dated September 30, released on Thursday, total assets declined to a still monstrous ¥724 trillion ($6.4 trillion), below where it had been in May 2021.
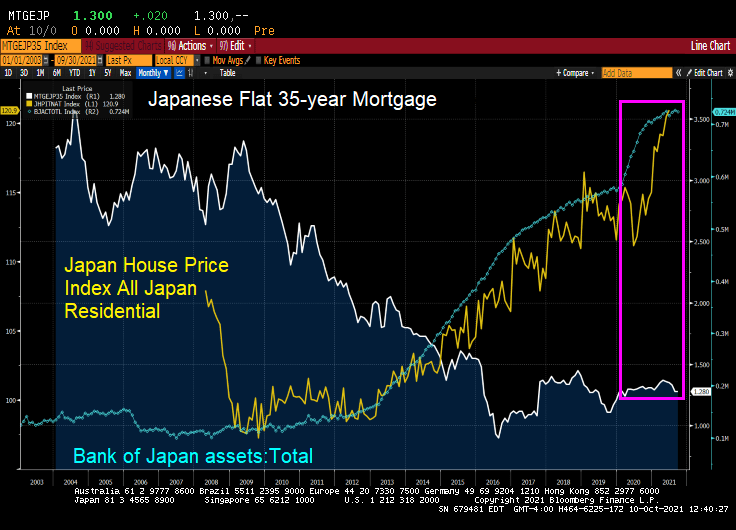
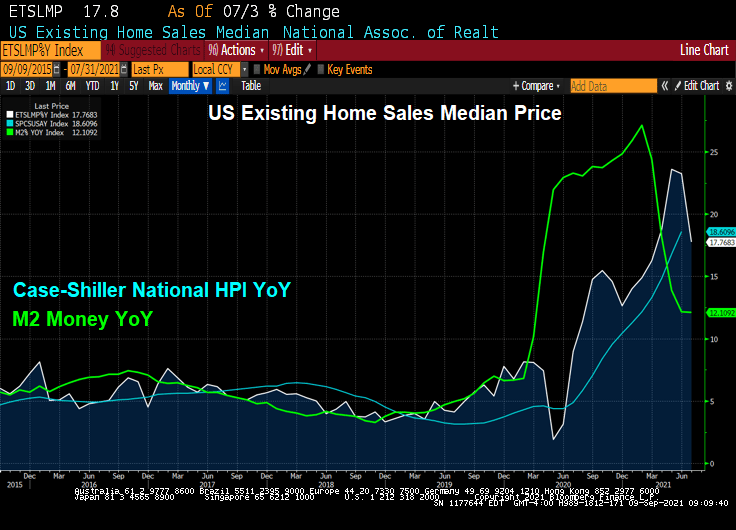
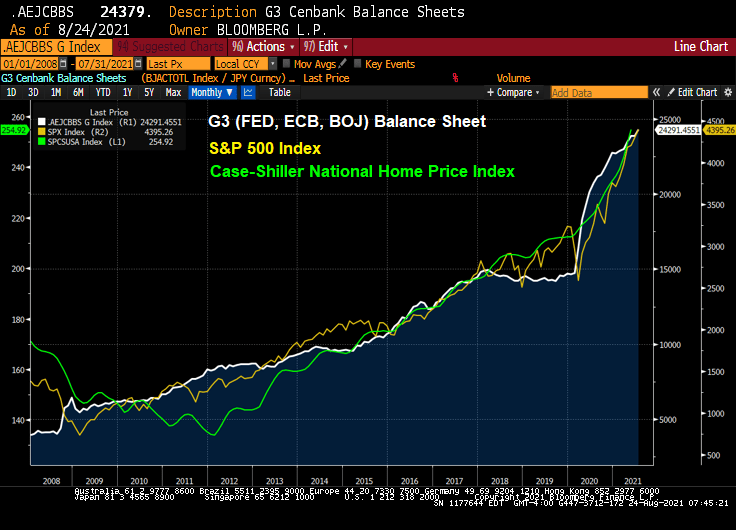
But look at Japanese home prices with the growth of the BOJ’s balance sheet and general decline in mortgage rates. Like the USA, there was a balance sheet spike associated with Covid and a resulting spike in home prices.
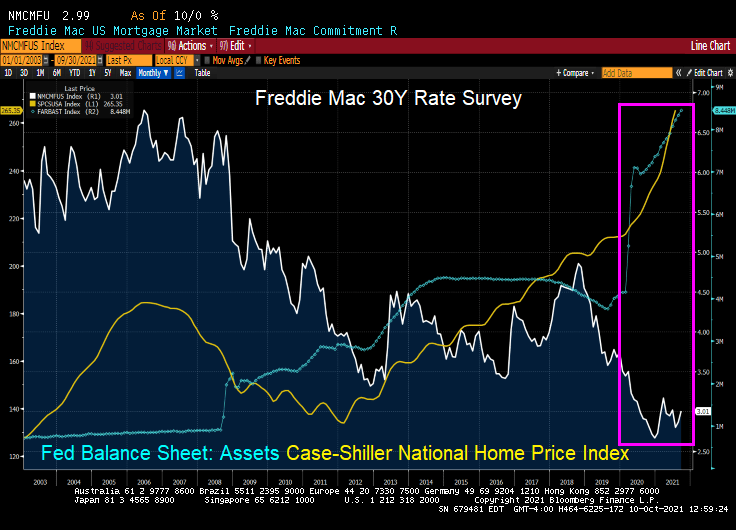
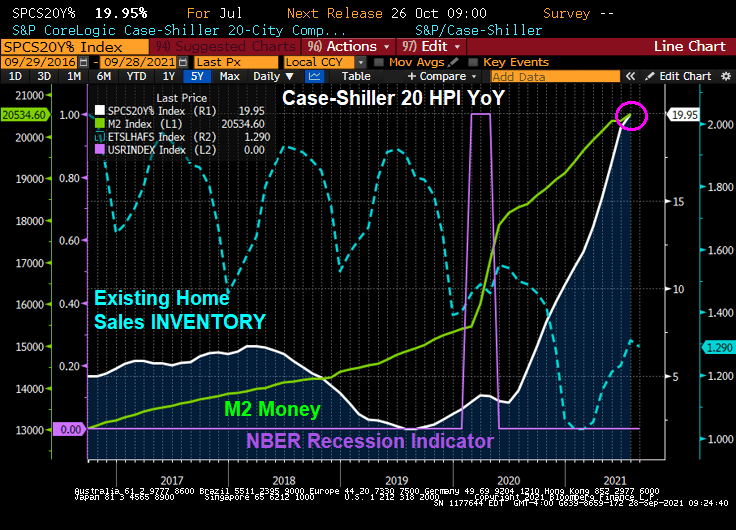
The USA? We also saw a surge in home prices following The Fed’s monetary “stimulypto.”
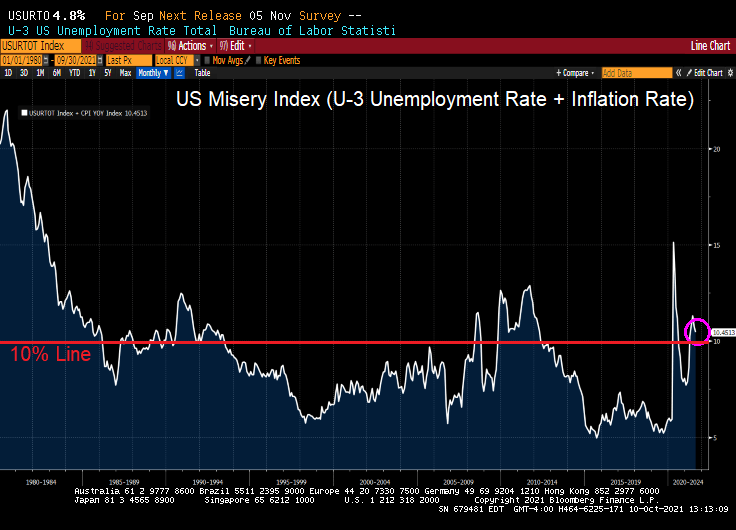
Bear in my that the US Misery Index is above 10% (U-3 unemployment + inflation).
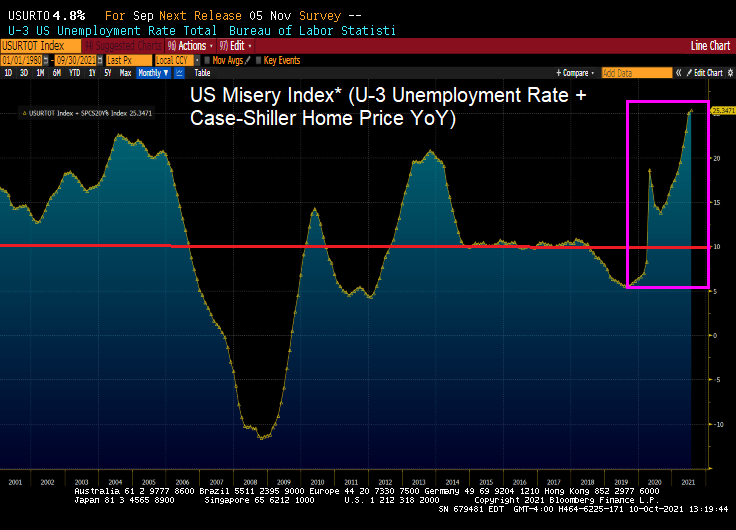
And if I define the US Misery Index as U-3 unemployment + home price growth, we can see we are at record misery rates. Miserable for households that don’t own a home or are trying to move to a higher housing price area).
So much for the transitory inflation that The Federal Reserve keeps spouting on about.
(Bloomberg) — The pace of rent increases is heating up in the U.S.
Rent data for the past two months show no sign yet of the usual seasonal dip at this time of year, following peaks early in the summer, when many lease renewals come due.
A Zillow Group Inc. index based on the mean of listed rents rose 11.5% in August from a year earlier, with some cities in Florida, Georgia and Washington state seeing increases of more than 25%.
Since the start of the pandemic, the median rent for a two-bedroom apartment has soared 13.1% to $1,663, Zumper data show.
But rent on newly-signed leases rose 17% from the previous tenant’s lease.
For the New York market, landlords are raising rent prices as much as 70% now that people are flooding back into the city as offices and entertainment venues open up. In July, the median asking rent in New York City surged to $3,000, compared with the pandemic low of $2,750 in January 2021, data from StreetEasy showed.
Of course, rent surge is not surprising given that home prices have surged since Covid given limited inventory and massive Fed stimulus.
Perhaps if The Fed and Federales (Federal government) start reducing their apocalyptic-level stimulus, THEN we will see inflation as transitory.
(Bloomberg) — The Federal Open Market Committee directed the New York Fed’s Desk to increase the size of the counterparty limit for the overnight reverse repo facility, according to a statement.
Per-counterparty limit increased to $160b/day from $80b/day, with the change taking effect Sept. 23
“The increase in the per-counterparty limit from the current level of $80 billion per day helps ensure that the ON RRP facility continues to support effective policy implementation,” according to statement. “All other ON RRP operation parameters remain the same”
And banks didn’t wait long to park $135.2b overnight at The Fed.
When combined with the ongoing expansion of the Fed’s balance sheet, we are seeing to see the expansion of the United States on Liquidity.
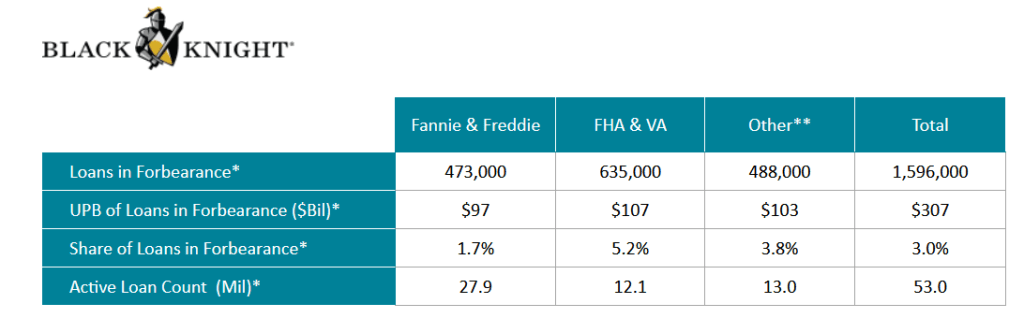
The Covid epidemic hit the single-family mortgage market hard in early 2020, leading mortgage lenders and servicers to offer FORBEARANCE to borrowers who were having trouble making their mortgage payments due to loss of hours or a loss of job.
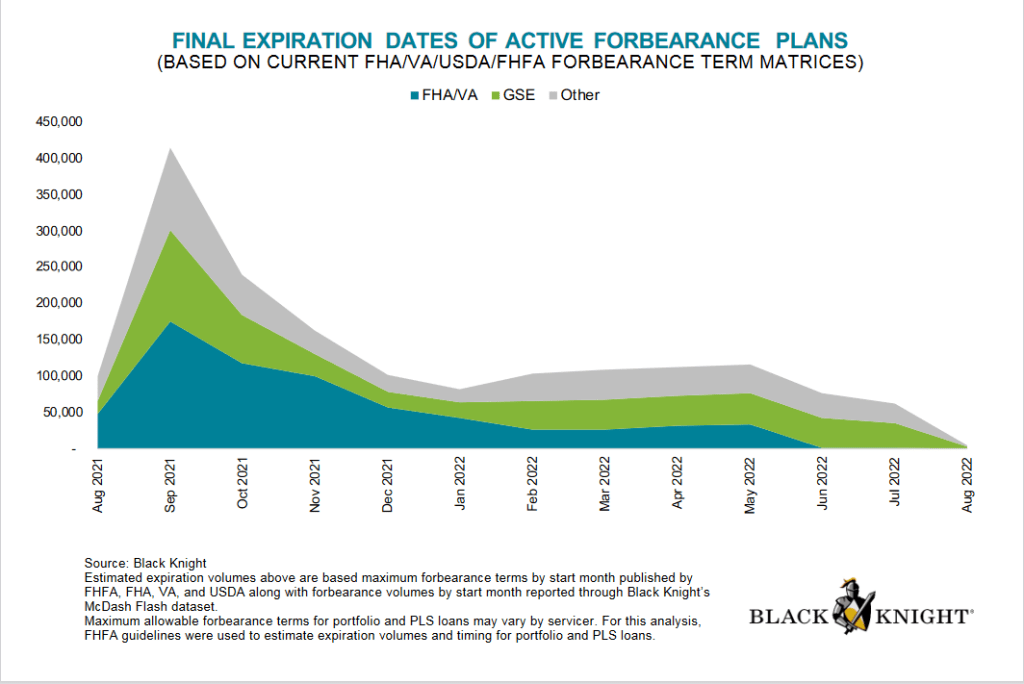
The good news? Active forbearance plans are much lower today than at their peak after the Covid epidemic struck in early 2020 with active forbearance plans peaking in May 2020.
Forbearance plans are due to expire in
What is forbearance, you ask? Forbearance is when a mortgage servicer or lender allows a borrower to temporarily pay their mortgage at a lower payment or pause paying your mortgage. The borrower will have to pay the payment reduction or the paused payments back later.
Despite forbearance, Fannie Mae still reported $7.2 billion in net income in Q2 2021. Notice the difference between single-family SDQ and the SDQ rate without forbearance. Freddie Mac reported $3.7 billion in Q2 2021 net income.
Here is a look at Fannie Mae’s net income over the past year and SDQ rates.
Under the existing seller/servicer eligibility requirements, the Agency SDQ Rate is defined as 100 multiplied by (the UPB of mortgage loans 90 days or more delinquent or in foreclosure for Fannie Mae, Freddie Mac, and Ginnie Mae/Total UPB of mortgage loans serviced for Fannie Mae, Freddie Mac, and Ginnie Mae). Beginning with the financial quarter ending Jun. 30, 2020, the Agency SDQ Rate will include an adjustment for mortgage loans in a COVID-19-related forbearance plan that are 90 days or more delinquent and were current at the inception of the COVID-19-related forbearance plan. The UPB of such mortgage loans shall be multiplied by .30 and added to the UPB for SDQ mortgage loans for the purposes of determining the numerator in the calculation of the Agency SDQ Rate.
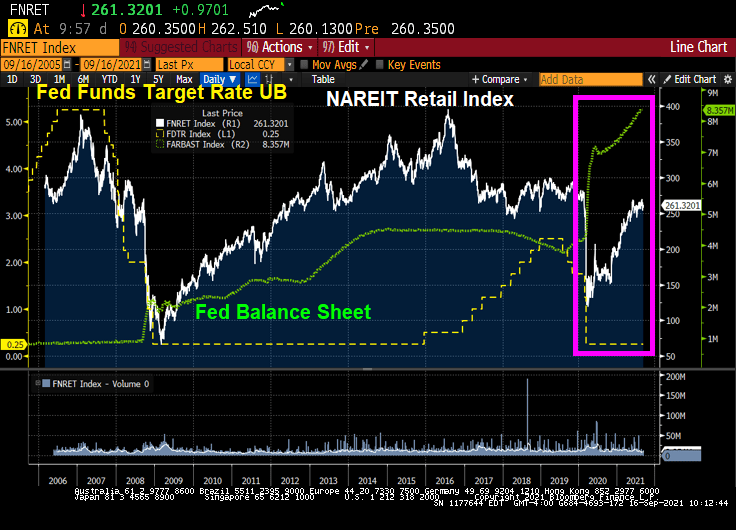
It is tough to operate a retail Real Estate Investment Trust (REIT) in the face of the triple whammy that hit retail shopping. First, there was the housing bubble/subprime crisis of 2008-2009. Then there was the advent of on-line shopping, then COVID.
I look at the NAREIT retail index and two retail REITs for comparison: Simon Property Group and Washington REIT. And as a proxy for online shopping, I compare them to Amazon. Both Washington REIT and the NAREIT retail index were at loft valuations at the peak of the housing bubble, but crashed with the onset of the housing bubble burst and ensuing financial crisis. But following The Great Recession, both recovered by 2016 (along with Simon Property Group which actually far exceeded their pre-Great Recession peak.
ii
But then retail mall disaster struck. In the form of on-line shopping. I use Amazon to represent on-line shopping. While NAREIT Retail and Simon fell from their 2016 peak, Washington REIT got clobbered.
Then Covid struck. When combined with on-line shopping and fear mongering by Anthony Fauci, retail REITs got hit hard. But all three have rebounded slightly since their nadir in 2020.
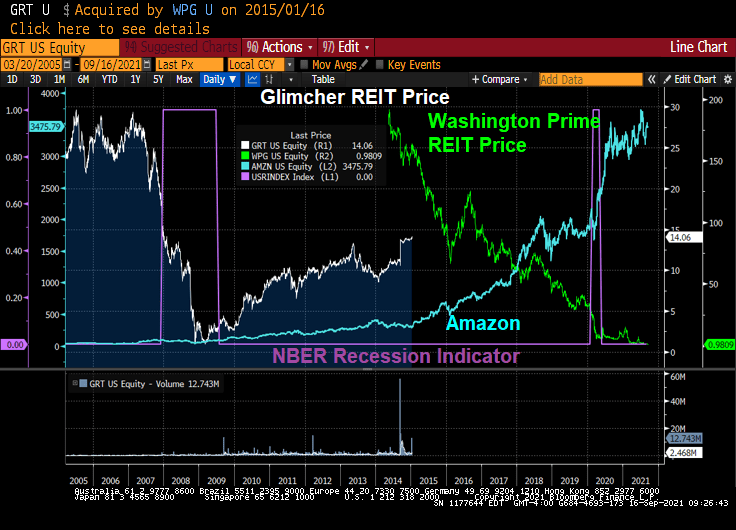
An interesting case study is Glimcher REIT, a formerly privately-held commercial real estate development company from Columbus Ohio. Like other retail REITs, Glimcher was crushed by the financial crisis and Great Recession. Glimcher’s share price fought back to $14.06 per share (down considerably from $29.28 in February 2007).
Washington Prime Group Inc. acquired Glimcher Realty Trust for $4.3 Billion in stock and cash Including the assumption of Glimcher’s debt. Right as on-line shopping took off. And the Covid struck a death blow leaving Washington Prime trading at $0.98. Washington REIT is transforming into a multifamily REIT given the overbuilding of DC area office space and the triple whammy of retail centers.
Retail REITs have almost recovered from Covid, thanks to the massive monetary stimulus from The Federal Reserve. Not to mention fiscal stimulus from DC.
Yup, a triple whammy has hit retail REITs with some faring better than others.
But the NAREIT RESIDENTIAL Index has exploded with Fed stimulus.
(Bloomberg) — Orchard, which offers cash to homebuyers upfront so they can purchase a new residence before selling their old one, raised $100 million to fuel growth in an ultra-competitive housing market that’s pushing shoppers to find new ways to stand out.
The fundraising round values the startup at more than $1 billion, making it the latest unicorn company to tackle the challenge of simplifying the process of buying or selling a home. Boston-based Accomplice led the round, with existing investors FirstMark, Revolution, First American and Juxtapose also participating.
“We can say we’re a unicorn, which feels good for about five seconds, and then it’s back to the real world of building a business,” Chief Executive Officer Court Cunningham said in an interview. “We’re trying to create a modern way to buy and sell homes, and that’s capital intensive.”
Cunningham, previously CEO of online marketing company Yodle, started Orchard in 2017 to take on what he viewed as a ripe opportunity: Consumers were frustrated with the traditional way of buying and selling homes, and the $1.7 trillion U.S. housing market was big enough to make tackling the problem worthwhile.
Orchard focuses on people who are trying to buy their next home while selling an existing one, a nerve-wracking process that can cause a transaction to collapse or result in households carrying two mortgages. In addition to offering cash to help clients buy their next home, the New York-based company provides funds to make light repairs before listing the existing home on the market. Orchard seeks to profit by operating as a brokerage and earning commissions.
There have always been services that purchase homes from you. Typically, there firms simply pay off your mortgage, so if you have a higher mortgage balance relative to you home value, you may not like what you are offered. But Orchard is not that model.
If you “List with Orchard,” and your home doesn’t end up selling on the open market, Orchard will buy your home. Sellers in some markets also have the option to sell immediately to the company. Orchard wants you to list for 30 days before selling to them for their backup cash offer price. If you sell directly to Orchard, you’ll also pay an additional 1% convenience fee on top of the 6% you’re already paying commission.
When home prices have been rising at a 17-18% YoY pace, this seems like a good model. But what if The Federal Reserve removes it massive monetary stimulus and/or The Federal Government slows down it fiscal stimulus? Then Orchard, if they purchase your home, will likely lose considerable amounts. Being aware of this possibility, Orchard is likely to buy homes at a considerable discount.
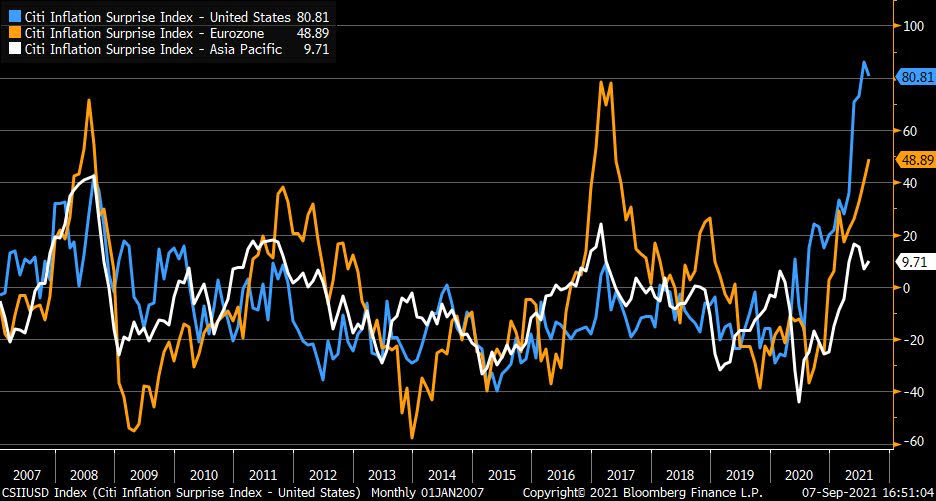
But there is still worries about inflation. Here is the Citi Inflation Surprise index.
Publicly traded companies known as iBuyers are pioneering a high-tech approach to home-flipping intended to make selling properties easier. Those firms include Opendoor Technologies Inc., Redfin Corp., and Offerpad Solutions Inc. A fourth, Zillow Group Inc., recently raised $450 million by issuing bonds, backed by the homes it buys and sells.
Since the original model of The Federal Reserve was to purchase Treasuries and Agency MBS in an effort to push down interest rates, it will be quite difficult to delink the two: taper the balance sheet while not raising short-term rates.
(Bloomberg) — Bond investors may not wait long to start pushing back against Federal Reserve Chair Jerome Powell’s efforts to delink the start of asset-purchase tapering from the countdown to eventual policy-rate hikes.
Since Powell last week said the central bank could begin reducing its monthly bond buying this year, traders have stuck with early 2023 as the likely timing for the Fed’s liftoff from zero interest rates, and Treasury yields have barely budged.
But that calm faces a test starting Friday. The potential for volatility comes from the fact that when Fed officials gather this month, they will release fresh projections for the fed funds rate for the next few years. And with the labor market pivotal for Fed policy now, Friday’s August jobs report is seen as laying the foundation for these forecasts — collectively known as the dot plot — especially as some Fed officials have already been pushing for an early taper.
The upshot is that a robust reading Friday could have investors pulling forward tightening bets regardless of Powell’s efforts last week in his virtual speech at the Fed’s Jackson Hole symposium. The risk is traders will prepare for a repeat of June, when a hawkish signal via the dot-plot took markets by surprise and triggered an abrupt unwinding of wagers on a steeper yield curve.
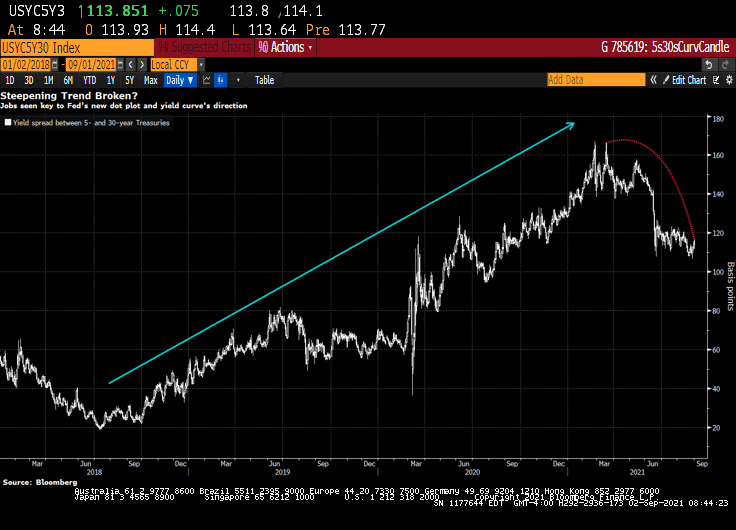
If the employment report is “even deemed acceptable, regional presidents will be back on the tape in a flash,” sounding hawkish again, said Jim Vogel, an analyst at FHN Financial. “And you may have more officials penciling in a 2022 hike. And that would have to flatten the yield curve.”
Expectations for a hawkish shift would lift 5-year Treasury yields in particular, shrinking the gap with 30-year rates, Vogel said. That spread was around 114 basis points Wednesday, down from about 140 just before the Fed met in mid-June.
Dots Math
Officials’ June quarterly forecasts not only showed a median funds rate projection of two hikes in 2023 — after the March dot plot indicated no tightening until at least 2024 — but that seven participants saw at least one increase next year. This time around, it will take just three officials to raise their dots for 2022 for a full hike to be the new median for next year, assuming everyone else keeps their projections where they were.
Traders responded to the Fed’s June rate projections by driving 5-year yields up the most in almost four months. That was even as Powell said in his press conference that the dot plot should be taken with a “big grain of salt” and discussion about raising rates would be “highly premature.”
Powell last week said “the timing and pace of the coming reduction in asset purchases will not be intended to carry a direct signal regarding the timing of interest rate liftoff, for which we have articulated a different and substantially more stringent test.”
But the leadup to the Fed decision on Sept. 22 may culminate in a dot-plot unveiling that yet again presents a communication challenge for policy makers, as has been seen several times since the Fed introduced the projections in 2012.
“There’s information in the dots, and generally it’s good information,” said Shahid Ladha, head of Group-of-10 rates strategy for the Americas at BNP Paribas SA. It makes sense for the Fed, regarding tapering and rate hikes, “to try to separate them, but I don’t think they’ll be ultimately successful in separating them.”
Trouble Ahead
Even some Fed officials are wary of being able to disentangle the tapering from rate hikes, minutes from the July Fed meeting showed.
Kevin Flanagan, head of fixed-income strategy at WisdomTree Investments Inc., which runs exchange-traded funds with assets of $75 billion, sees trouble for the Fed.
His view is that the labor market will keep gaining ground in its rebound from the pandemic, and that the median September dot may show a hike in 2022. That bodes for higher yields, a flatter curve and makes floating-rate notes appealing, he said.
The median of economists’ projection is for a gain of 725,000 jobs in August, a slowdown from June and July but well above the average for 2021. Of course, with millions still out of work relative to pre-pandemic levels, the Fed may prove to take longer to lift rates than traders expect, especially given the central bank’s “broad and inclusive” maximum-employment goal. But the market may be about to challenge that approach.
Note: Yesterday’s ADP jobs gain was forecast to be 625k jobs added in August, but only 374k jobs were actually added.
Fed Faces ‘Ugly Fight’ Over Jobs Goal in Next Big Policy Debate
“We are going to be all of a sudden talking about rate hikes potentially next year, and that is where the focus of the bond market is going to go,” Flanagan said. “The dot plot will be the Fed’s initial message for its forward guidance on rates. And then it will begin to come from Fedspeak — which is when the rubber will really meet the road.”
And with the stock market, particularly technology stocks, rising with Fed asset purchases, I wonder if The Fed forecasts that assets prices will keep going if they withdraw the punch bowl?
Let’s see if Powell and The Gang can forecast the stock market if they taper the balance sheet and raise rates.
At the annual Jackson Hole (aka, J-Hole) Economic Symposium, Federal Reserve Chairman Jerome Powell reiterated that the Fed is in no hurry to either taper asset purchases immediately or aggressively. Additionally he made crystal clear that even when the Fed does eventually start tapering asset purchases (likely November or December), it should not be taken as signaling interest rate hikes will follow on some preset course. Indeed, Fed Chairman Powell continues to claim that inflation is transitory. Finally, he said that part of the mandate (employment) is still far from being achieved. So, expect more SNAKE JUICE.
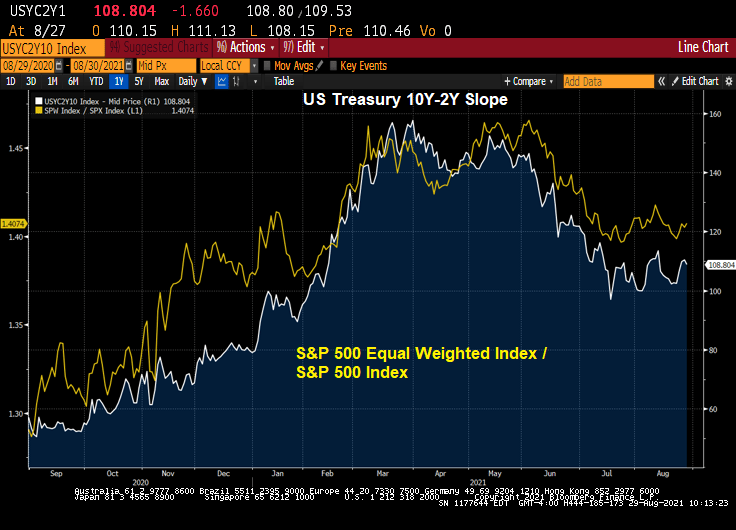
The shape of the yield curve has been highly influential recently in relative performance trends between various areas of the market. From last summer through May of this year, the steepening of the yield curve coincided with healthy outperformance of cyclical stocks. Since May, the flattening of the curve has coincided with more defensive (or at least high quality) leadership out of the tech and health care sectors. The logic goes, therefore, that a re-steepening of the curve should coincide with a shift back to cyclicals. Indeed, that shift may be in the early innings.
Let’s take a look at the US Treasury 10Y-2Y curve slope over the past twelve months against the Citi Economic Surprise Index for the US. You can see curve fatigue starting in April 2021 as the Citi Economic Surprise Index turns negative.
The the more cyclical and smaller skewed S&P 500 equal weight index has started to outperform the S&P 500 again, right on queue with the yield curve re-steepening.
Industrial stocks are under-performing the broader S&P 500 index as the curve flattens.
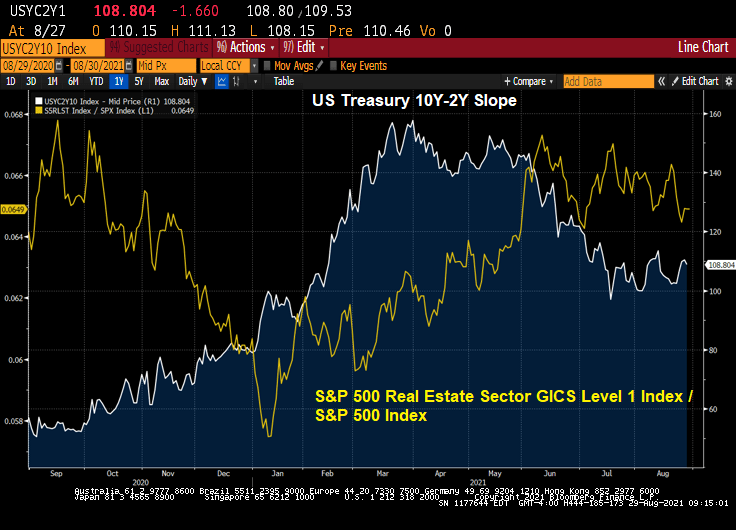
Real estate stocks? They are outperforming the broader S&P 500 index.
Mining stocks like gold mines? They are underperforming the broader S&P 500 index.
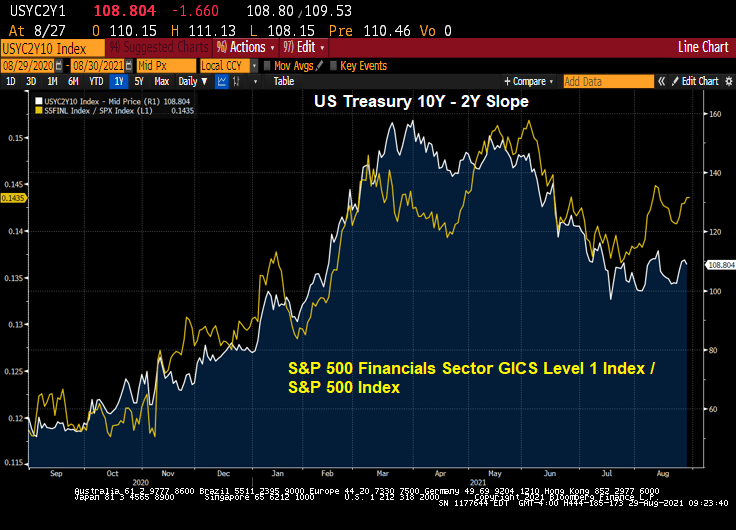
Financial stocks? Not surprisingly, The Fed’s dovish behavior is causing financial stocks to outperform the broader S&P index.
Likewise, information technology stocks are outperforming the broader S&P 500 index.
So, by Powell delaying any balance sheet slowdown and rate increases, we have clear winners (real estate, financials, information tech) and clear losers on a relative basis (industrials, retail, metals and mining).
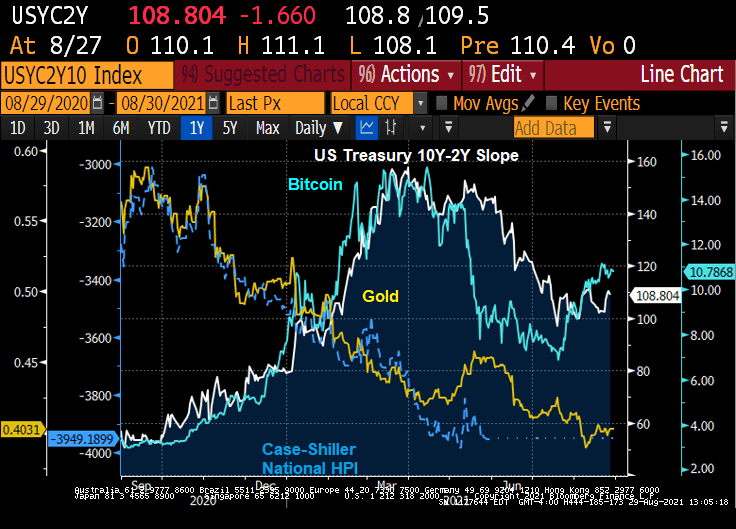
The Others! Due to volatility differences, I wouldn’t over-interpret this chart. But Bitcoin as a ratio of the S&P 500 index is “kicking ass!” Gold and housing as a ratio of the S&P 500 index seemingly can’t keep up with the S&P 500 index.
Powell and The Fed’s policies have veered from their mandate requiring Chairman Powell to meet 350 times with Congress to sell The Fed’s policies.
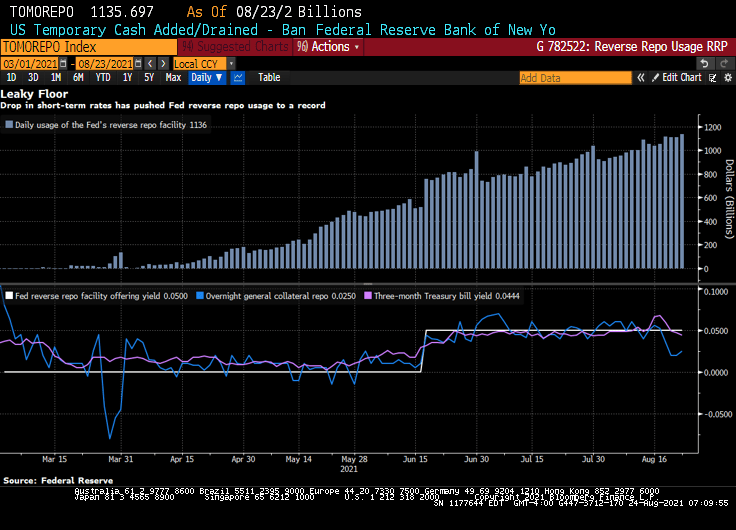
Bloomberg) — The Federal Reserve’s floor for overnight funding markets is proving to be no match for the deluge of cash.
Money-market securities ranging from Treasury bills to repurchase agreements continue to trade below 0.05% — the offering rate on the overnight reverse repo facility, which is supposed to act like a floor for the front end. The Fed at its June meeting had raised the rate by five basis points to help support the smooth functioning of short-term funding markets.
Still, usage of the tool climbed to a record $1.136 trillion on Monday, eclipsing the previous high of $1.116 trillion on Aug. 18.
Demand for the so-called RRP facility has surged as a flood of dollars threatens to overwhelm funding markets. That’s in part a result of the central bank’s long-standing asset purchases and drawdowns of the Treasury’s cash account, which is pushing reserves into the system. As a result, liquidity has been swelling, especially as the Treasury cuts supply to create more borrowing room under the debt ceiling.
The pressure pushing down overnight rates toward zero is proving a major headache for money-market funds. It hampers their ability to invest profitably, and can lead to further disruptions as they begin to waive fees to avoid passing on negative rates to shareholders. A number of firms including Vanguard Group shut down prime money-market funds last year after struggling to cover operating costs in the low-interest-rate environment.
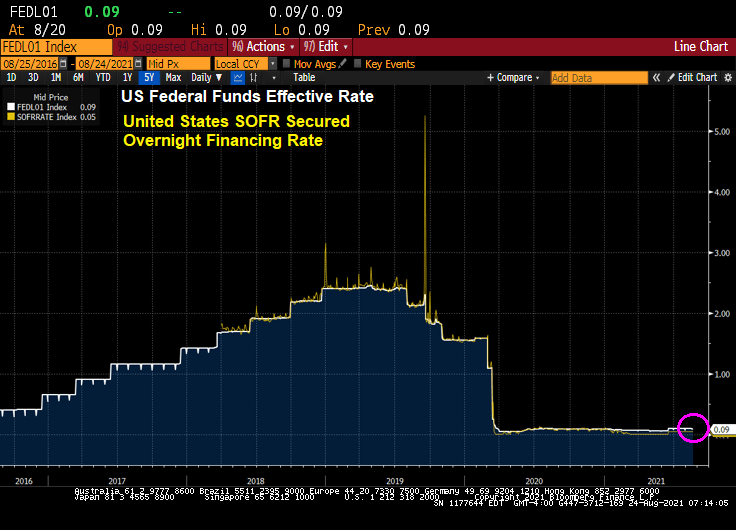
Yes, overnight rates such as the US SOFR rate, are near zero.
Powell’s Charm Offensive in Congress Positions Him to Keep Job
Perhaps that is why Federal Reserve Chair Jerome Powell is acting as a lobbyist with Congress for The Fed’s nontraditional approach to monetary policy.
(Bloomberg) Since he took the helm of the Fed in February 2018, through June of this year, he’s held at least 350 meetings, dinners or phone calls with members of Congress, according to his monthly calendars. That’s almost nine per month, and many of those included more than one lawmaker. The tally doesn’t count at least 16 appearances as chair before numerous congressional committees.
Well, the stock market has zoomed-up since Bernanke and The Fed adopted zero-interest rate (ZIRP) policies and the now famous quantitative easing (QE) policies in late 2008.
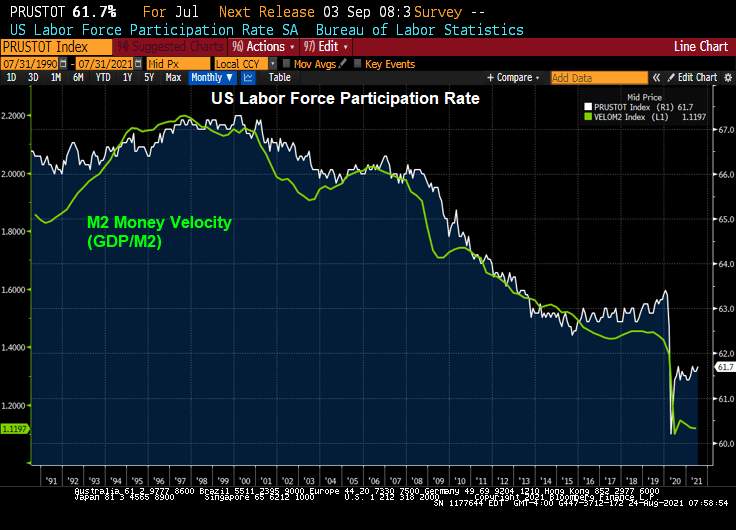
Congress member Alexandria Ocasio-Cortez asked Fed Chair Powell about the Fed helping with US unemployment. We are already at zero rates (on the short-end), and Congress should look at their policies on why labor force participation is slow to recover from the Covid epidemic.
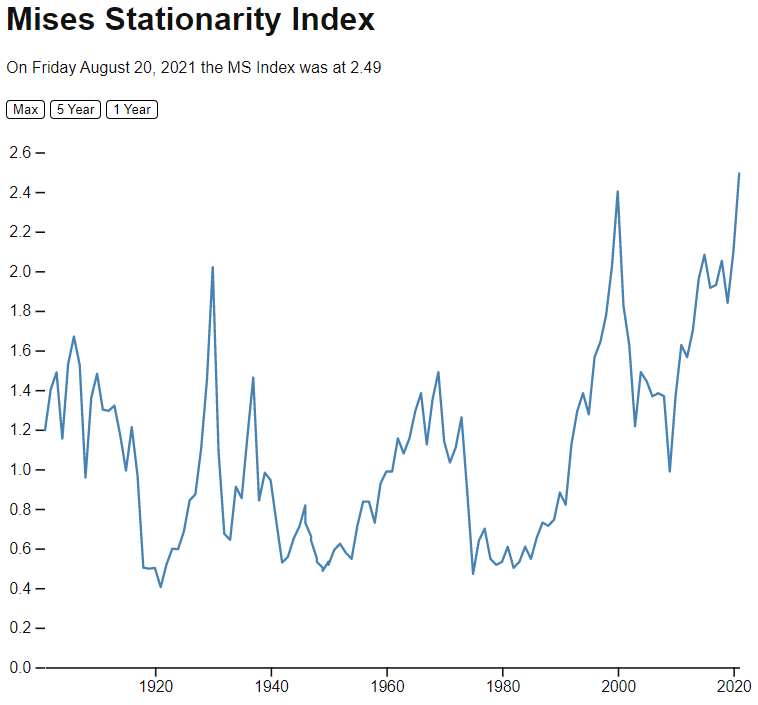
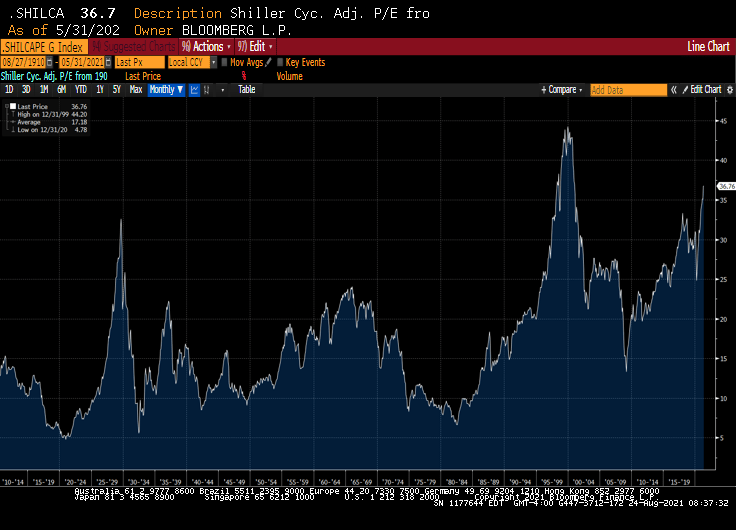
The Mises Stationarity Index is different than the Shiller CAPE index, which is showing equities as being overpriced, but not yet in dot.com bubble zone.


You must be logged in to post a comment.