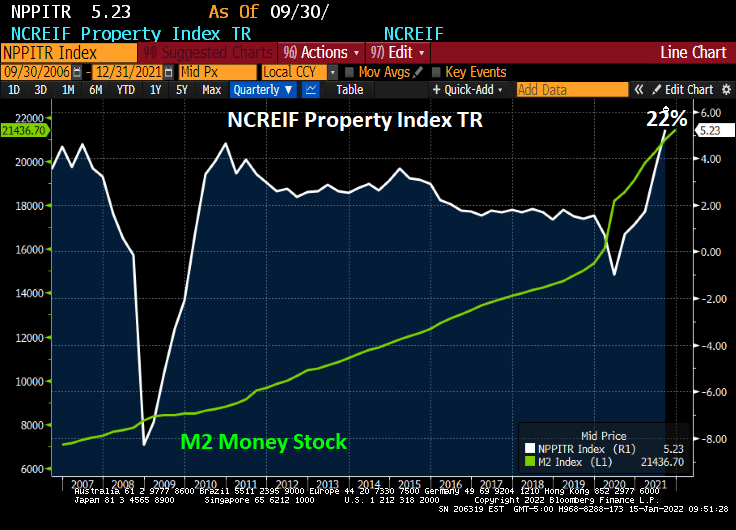
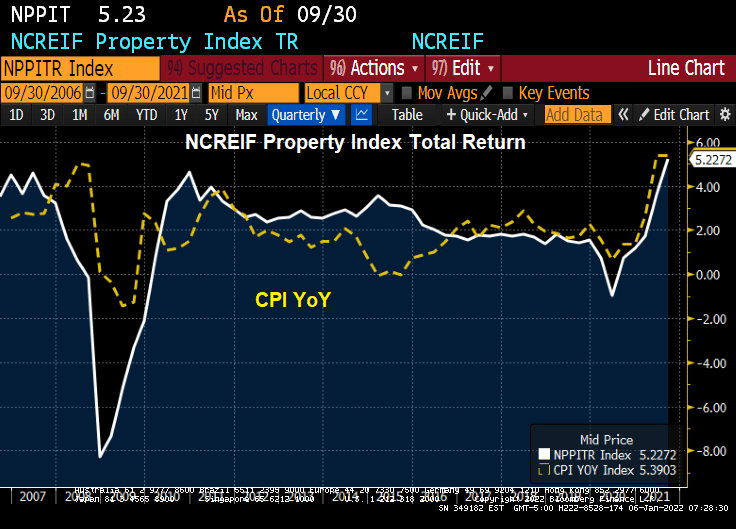
Inflation is burning out of control. While home price growth has been off the cherts (as Jean-Ralphio would say), commercial real estate has jumped incredibly at 22% YoY. The Bloomberg charting function hasn’t updated for the Q4 NCREIF report yet so I had to manually write-in 22% on the following chart.
So, what will happen IF The Fed follows through with its monetary stimulus reduction? JPMC’s Jaime Dimon warns that The Fed could hike 7 times in 2022 and not be ‘sweet and gentle’.
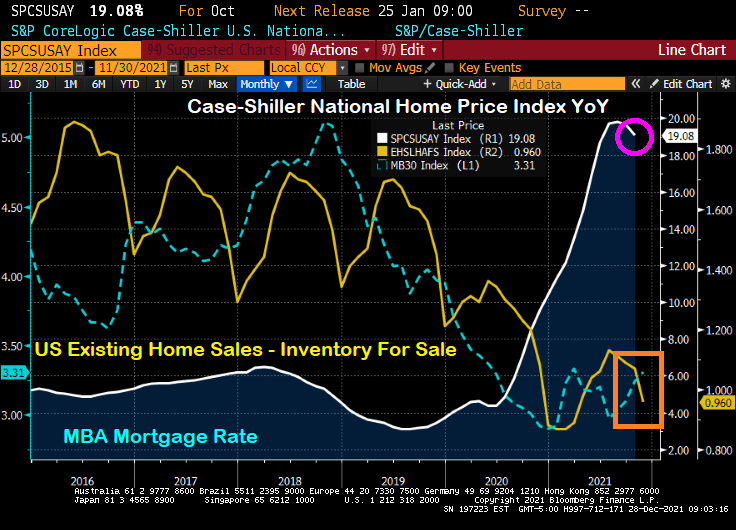
Mortgage rates in the U.S. rose for a third straight week, reaching the highest point in almost two years.
The average for a 30-year loan was 3.45%, up from 3.22% last week and the highest since March 2020, Freddie Mac said in a statement Thursday.
Rates tracked a jump in yields for 10-year Treasuries, which climbed to levels not seen since early 2020, before the pandemic roiled financial markets. Signs point to borrowing costs rising further as the job market improves and the Federal Reserve steps up its efforts to tame inflation.
That would increase the burden on homebuyers who are already stretching to afford a purchase. Rates for 30-year mortgages tumbled to a record low of 2.65% a little more than a year ago.
Cheap loans have helped fuel a housing rally that’s still running hot even as home prices soar out of reach for many Americans.
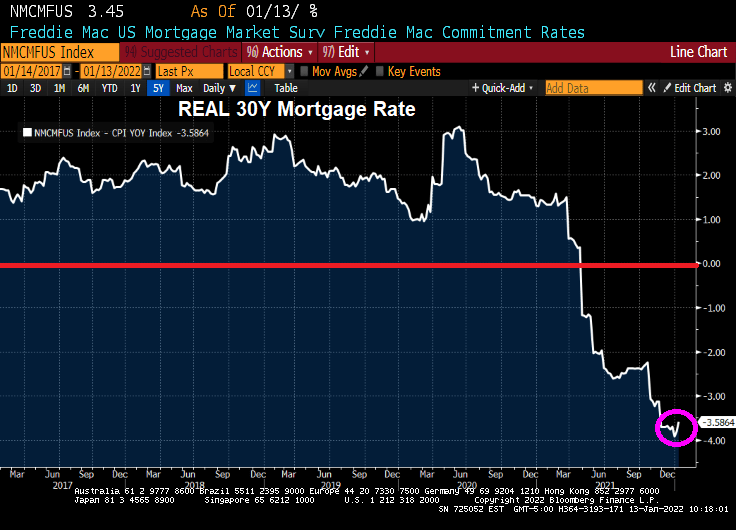
But wait! The REAL 30-year mortgage rate (nominal 30-year rate – CPI YoY) is -3.59%.
Lael Brainard, Biden’s nominee to be Vice Chairman of The Federal Reserve, has been one of the “inflation is transitory” crowd. US Senator Toomey is questioning Brainard in today’s hearing. From Toomey’s opening statement:
Last year, Governor Brainard repeatedly insisted that inflation was transitory. We have now had nine consecutive months where inflation has been more than two times the Fed’s 2% target. That makes it pretty clear that inflation is not transitory. Yesterday’s CPI release of 7.0%—the highest in 40 years—confirms that.
Inflation is a tax that is eroding Americans’ paychecks every day. Even though wages are growing, inflation is growing faster and causing workers to fall further and further behind.
At least the REAL mortgage rate is negative!
I hope Senator Toomey shows Brainard this chart of “transitory” negative wage growth.
Negative wage growth and negative REAL mortgage rates. What a total mess!
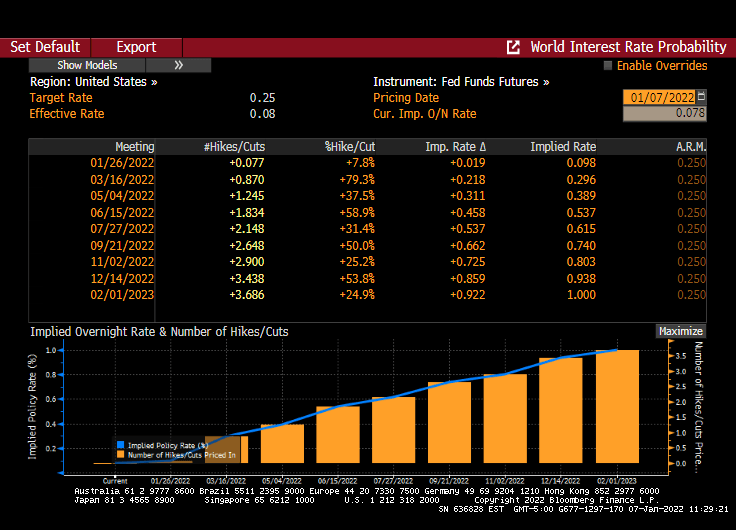
It looks like markets are buying into the prospect of The Federal Reserve raising rates three times (Bob) in 2022. And ceasing COVID monetary stimulus.
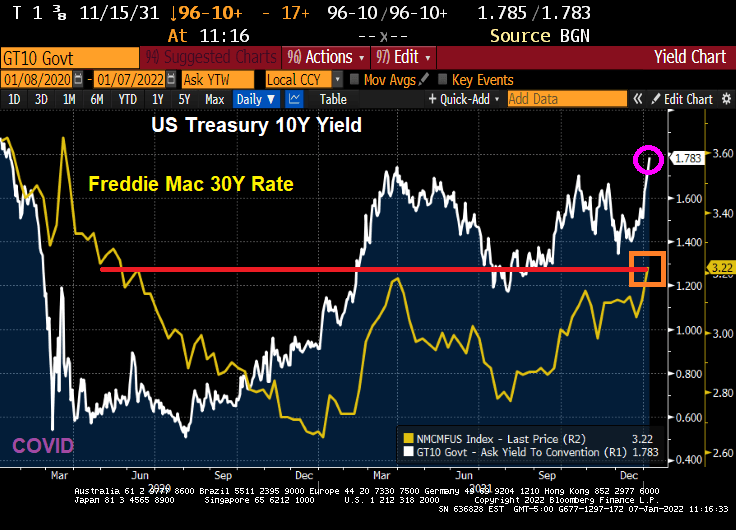
Today, the 10-year Treasury yield rose to PRE-COVID levels of 1.783%. And the Freddie Mac 30-year mortgage commitment rate rose to 3.22%, the highest since May 2020.
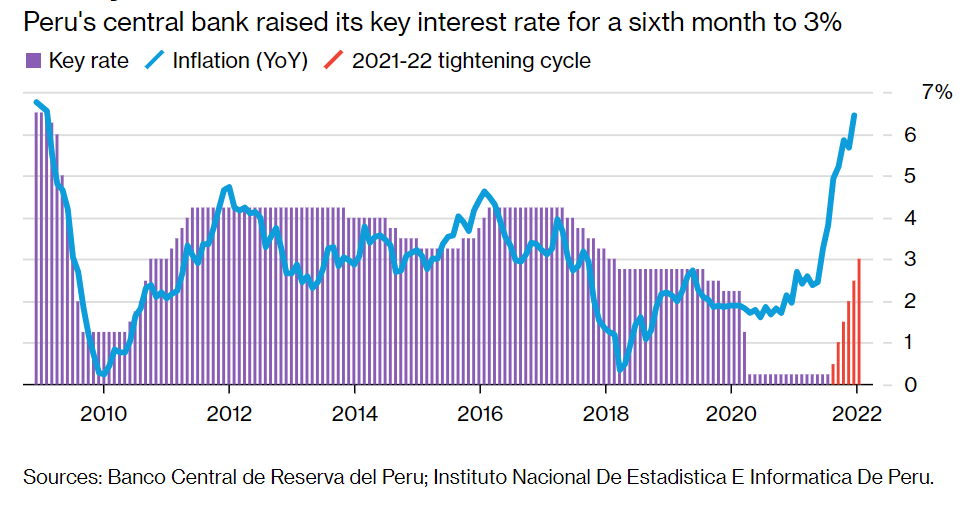
Today’s rising wage rates (although negative in terms of REAL wage rates) will likely put a Peruvian fire under The Fed’s behind. As of this morning, Fed Funds Futures are still pointing to three rate increases in 2022 (May, July and December).
And The Fed is supposed to be winding down the COVID monetary stimulus.
Why a Peruvian fire? Even Peru’s central bank is raising its key interest rate to 3% after soaring inflation.
Let’s see if Powell and The Gang follow through … or reveal themselves to be Peruvian Chickens.
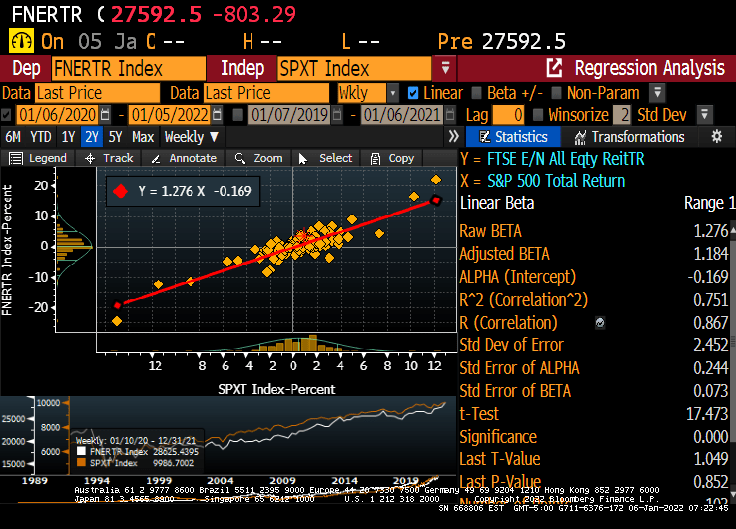
How about real estate investment trusts? The NAREIT all-equity index rose by 35.6% YoY while inflation rose at 6.8%. The S&P 500 index rose 28.9% YoY.
Of course, the NAREIT all-equity index has a beta of 1.276.
How about the NCREIF All-property commercial real estate index? For Q3, the NCREIF property index rose by 5.22%, less than the most recent inflation reading of 6.8%.
So for the past year, housing has beaten the pants-off inflation, REITs have earned a higher return than inflation, and the NCREIF index seems to be rising slower than inflation (but with its lag problems, I anxiously await the Q4 numbers which should be higher.
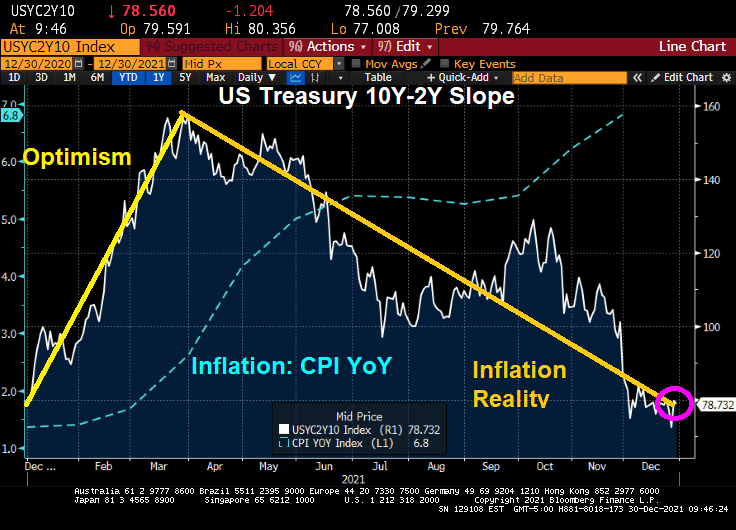
It has been almost a year since Joe Biden has been President of the United States and a Democrat majority took control of The House and Senate. And what has happened to the US Treasury yield curve slope over the past year?
The yield curve is back where it started. There was the “honeymoon effect” where the curve slope rose. After all, Biden was Obama’s Vice President for 8 years and The Democrats has promised so much in the 2020 election. But by early April, the reality of the massive Federal spending (combined with Fed Stimulypto) began showing what was feared: inflation (blue line) started to grow at a rapid rate of speed. With inflation now at 6.8% YoY,
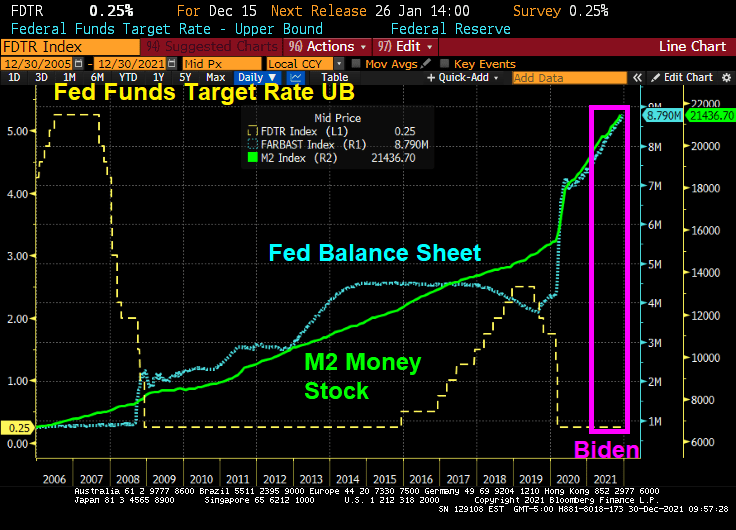
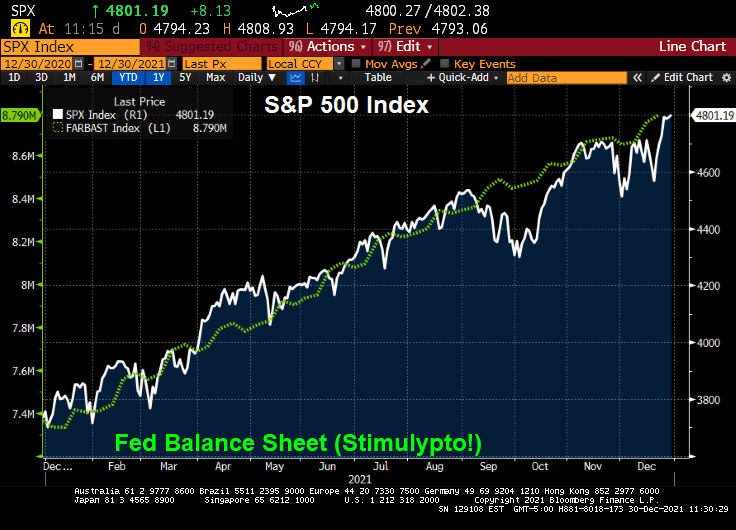
In fairness to Biden, The Federal Reserve has been overstimulating the economy since The Federal Reserve since Ben Bernanke and the Fed Open Market Committee (FOMC) dropped the hammer on The Fed Funds Target Rate once the rate hit 5.25% in September 2007. They kept cutting it reached 25 basis points (or 0.25%) in December 2008. In August 2008, Bernanke and Company began their “Quantitative Easing” or asset purchasing programs. Between The Fed’s Target Rate and QE, The Fed has continued to overstimulate markets ever since. Under Biden, The Fed Funds Target Rate remains at 0.25% and The Fed’s Balance sheet has grown to $8.79 Trillion (bigger than the entire economies of Japan and Germany put together!).
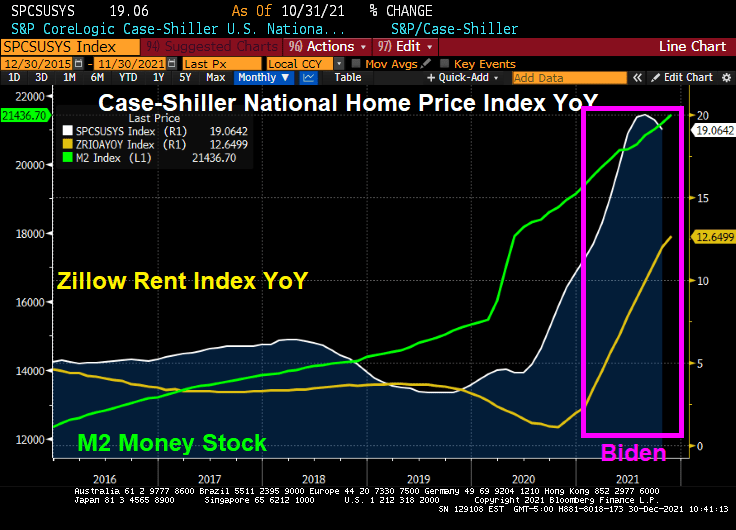
How about housing? Home prices are growing at 19% YoY while rents are growing at 12.65% YoY.
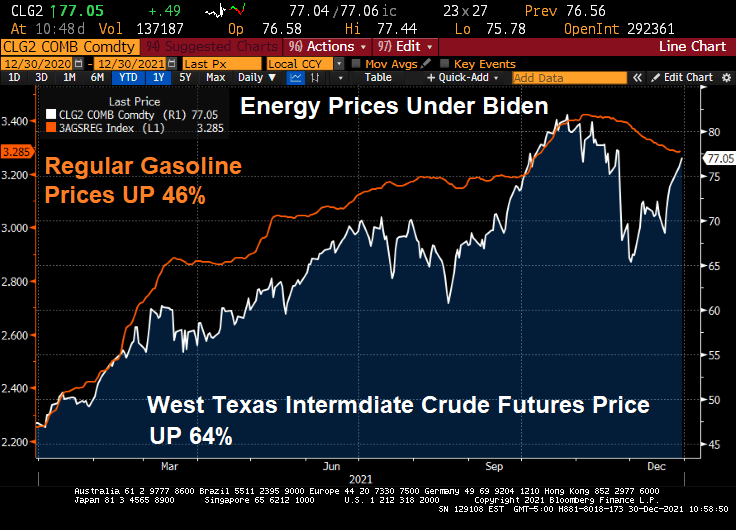
Energy prices have risen dramatically under Biden. Gasoline is up 46% despite a slight reprieve recently. WTI crude prices are up 64%.
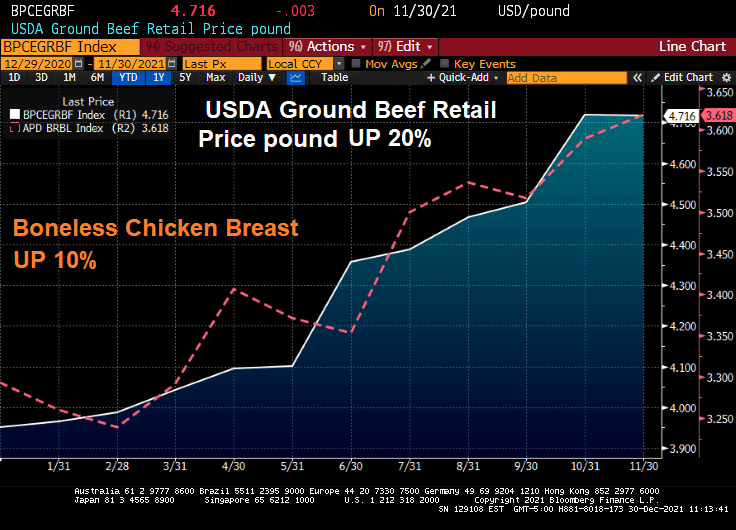
How about food? Beef prices are up 20% and chicken prices are up 10%.
On a positive note, the S&P 500 index has soared … thanks has soared during Biden’s term thanks to Fed stimulus and Federal spending on COVID.
The Build Back Better Act if passed (in its entirety or on a piecemeal basis) will lead to even MORE inflation.
Perhaps Biden’s spokesperson Jen Psaki can recreate the Biden Administration as a lovable, hilarious family like the comic strip Gasoline Alley with old Joe Biden as Skeezix. And insider-trading star, House Speaker Nancy Pelosi as the family matriarch.
There is a lot going on in the US housing market. Excessive monetary stimulus keeping mortgage rates low, historically low inventory available for sale, and FOMO (fear of missing out … on rapidly rising home prices).
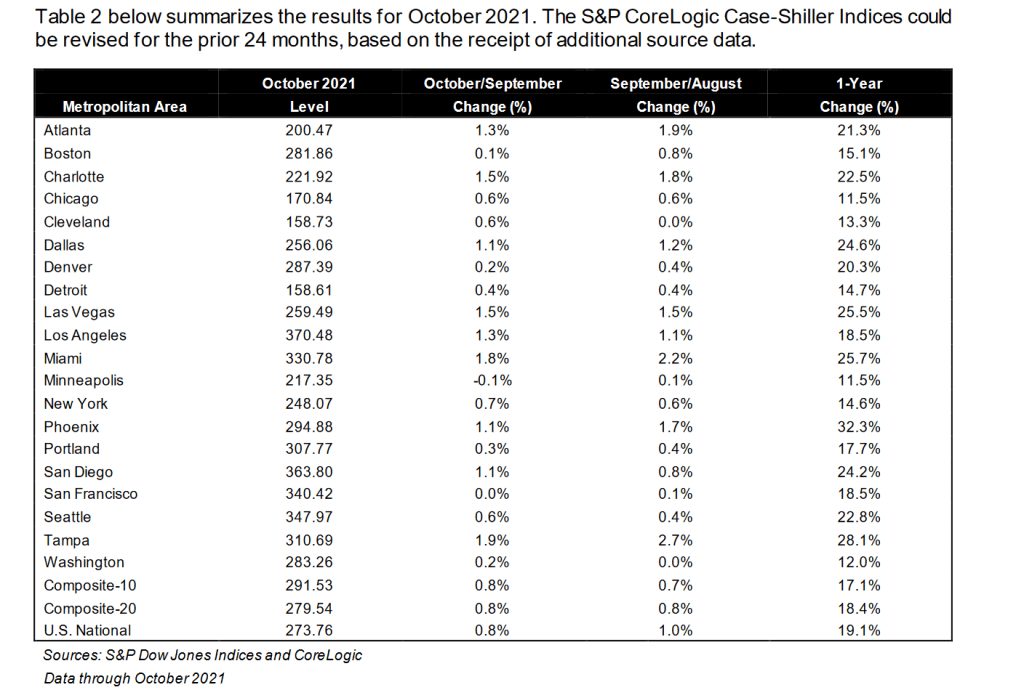
By metro area, Phoenix AZ once again leads with 32.3% YoY. Minneapolis MN is the slowest growing metro area in terms of home prices at 11.5% (tied with Chicago, IL).
Housing in the US is getting “simply unaffordable.” And it has gotten far worse over the past year. Thanks to BAD government policies.
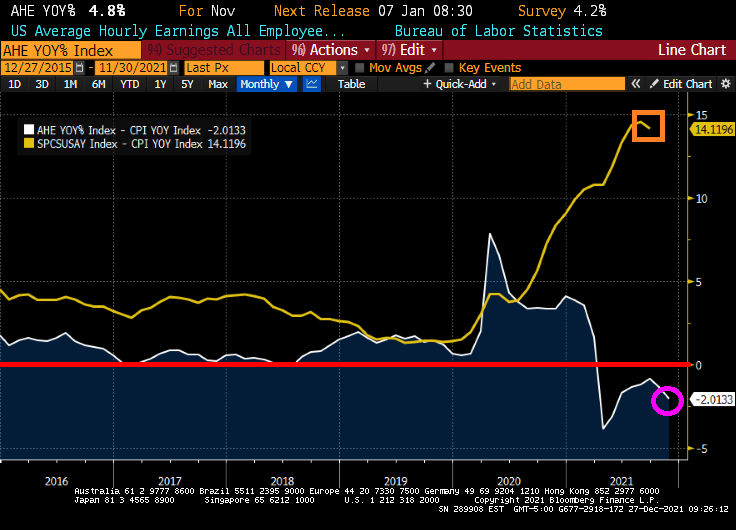
While wage growth is positive, inflation is sucking the life from consumers. REAL average hourly earnings growth is -2.0133%. Even worse, home prices are rising at a 14.12% pace in REAL terms. So, wages are losing to inflation and housing is pulling away from renters in terms of affordability.`
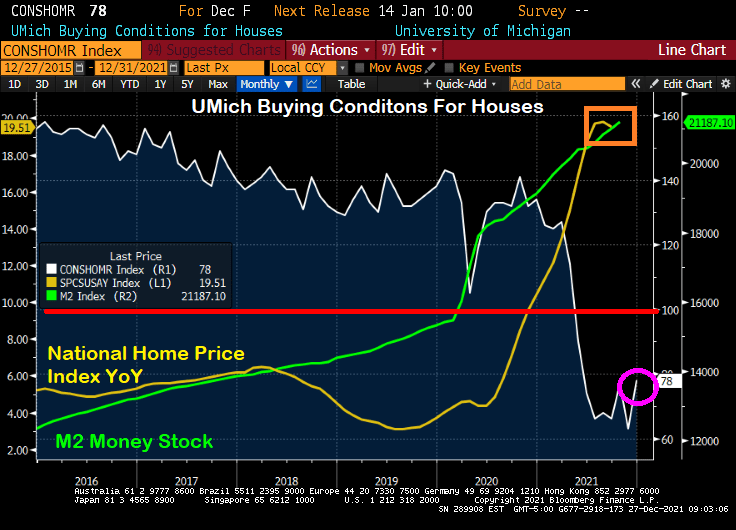
So it is not surprising that the University of Michigan consumer survey for “Buying Conditions For Housing” remains below 100 (meaning that more people think buying conditions for housing are negative than positive). With the Case-Shiller National home price index growing at a 19.51% YoY pace, it is no wonder that consumers are getting scared of the housing market.
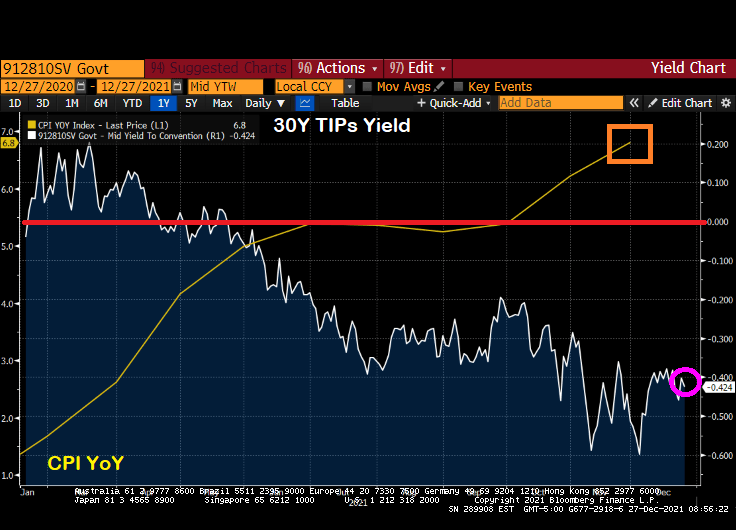
Yes, US inflation is at a 40-year high and the 30-year Treasury Inflation Protected (TIP) yields is at -0.424%. That says quite a bit about the pickle US consumers are in.
US consumer confidence overall has declined to the lowest level since just after the financial crisis and housing bubble burst of 2008-9.
Doctor, Doctor (Yellen), please don’t try to make housing more “affordable” which will result in housing being even LESS affordable.
But I do like how Biden took credit for lowering gasoline prices a little after his anti-energy policies drove up gasoline prices in the first place from $2.20 to $3.40 a gallon, a 55% price increase. Thanks for nothing, Joe!
And with Omicron raging (with few reported deaths), Anthony Fauci, President Biden’s top medical adviser, indicated support for making vaccinations a requirement for domestic fights.
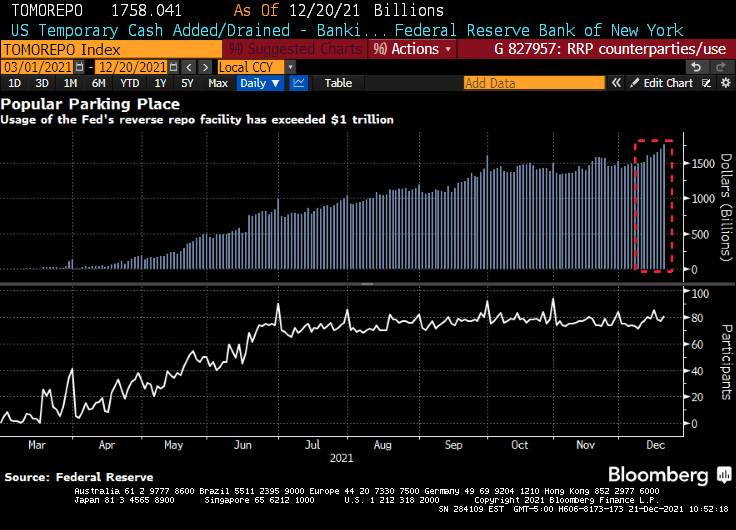
(Bloomberg) — The amount of money that investors are parking at a major central bank facility climbed to yet another all-time high as supply-demand imbalances continue to dog U.S. dollar funding markets.
Eighty-one participants on Monday placed a total of $1.758 trillion at the Federal Reserve’s overnight reverse repurchase agreement facility, in which counterparties like money-market funds can place cash with the central bank. That surpassed the previous record volume of $1.705 trillion from Dec. 17, New York Fed data show.
Demand for the so-called RRP has climbed further as principal and interest payments from government-sponsored enterprises has entered short-end funding markets. However, that cash is expected to exit the overnight space by the end of the week as the Treasury ramps up its issuance of Treasury bills now that Congress has increased the debt limit.
Overall volume has been rising this year as a flood of cash continues to overwhelm the U.S. dollar funding markets due to central-bank asset purchases and the drawdown of the Treasury’s cash account, which is pushing reserves into the system. The larger takeup looks set to persist even as the Fed tapers its asset-purchase program — something it began this month — because the supply-demand imbalances in short-end securities are likely to persist.
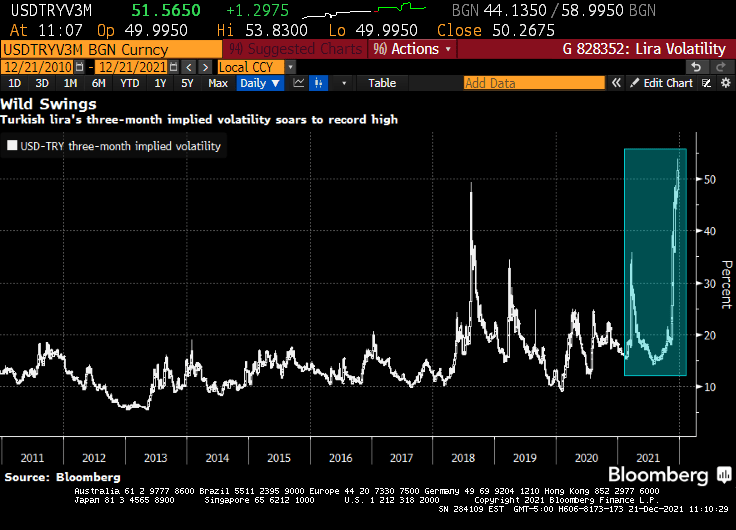
Then we have the Turkish Lira volatility hitting an all-time high.
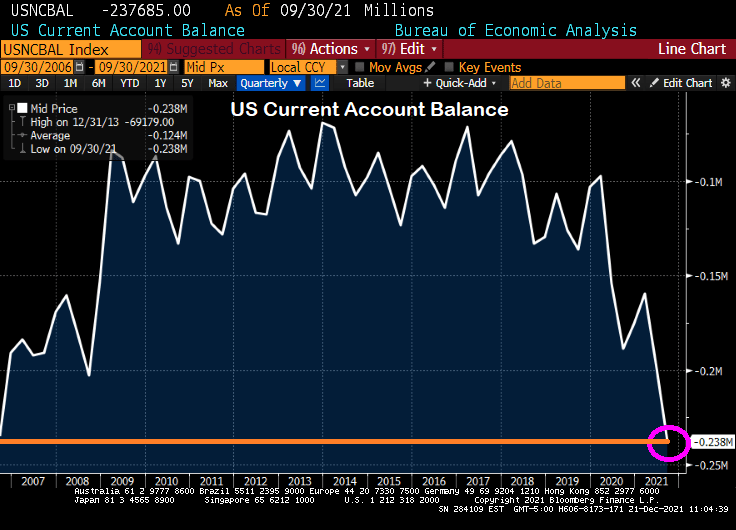
And finally we have the US Current Account Balance rising to levels last seen in 2006 just after the peak of the US housing bubble.
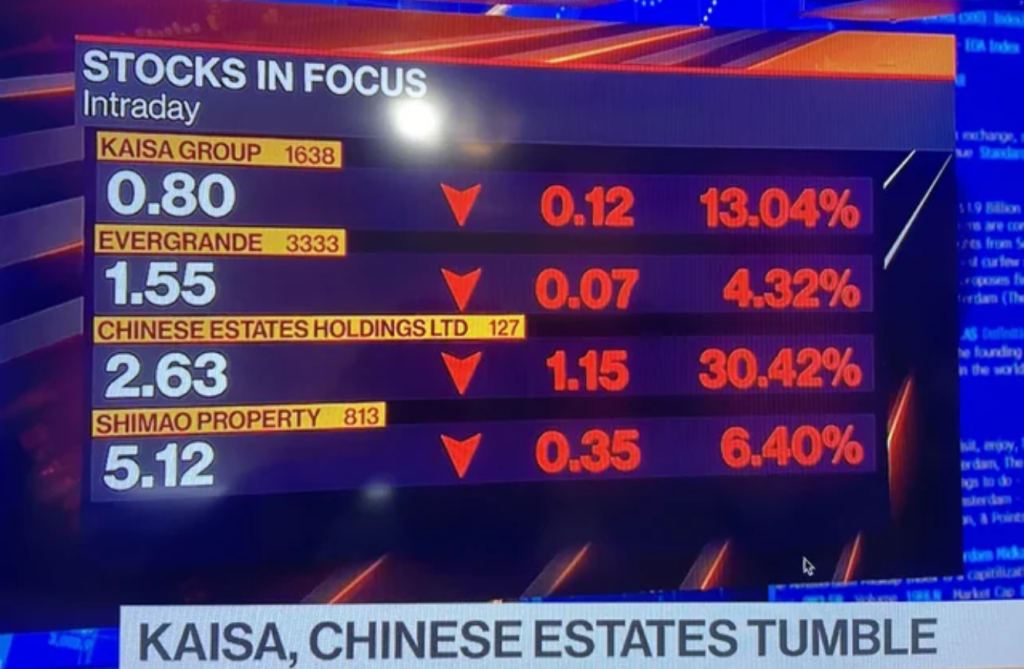
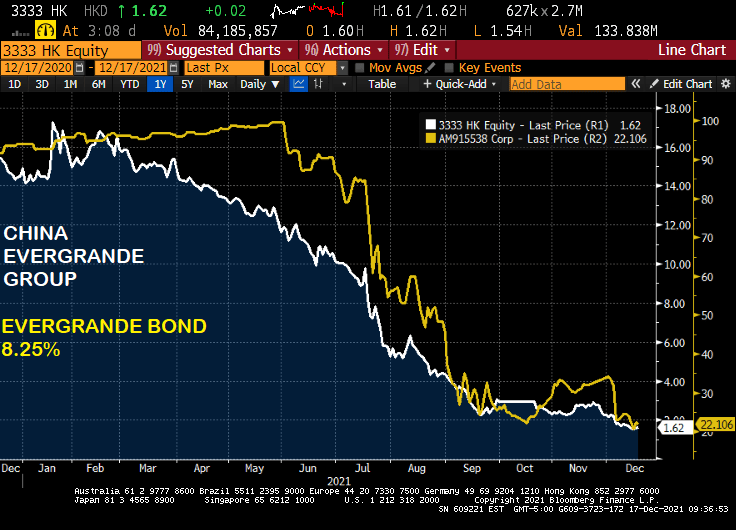
While the Chinese Wuhan virus (aka, the Fauci Flu) has plagued the world, another Chinese “export” is also suffering what is known as contagion: China’s real estate sector.
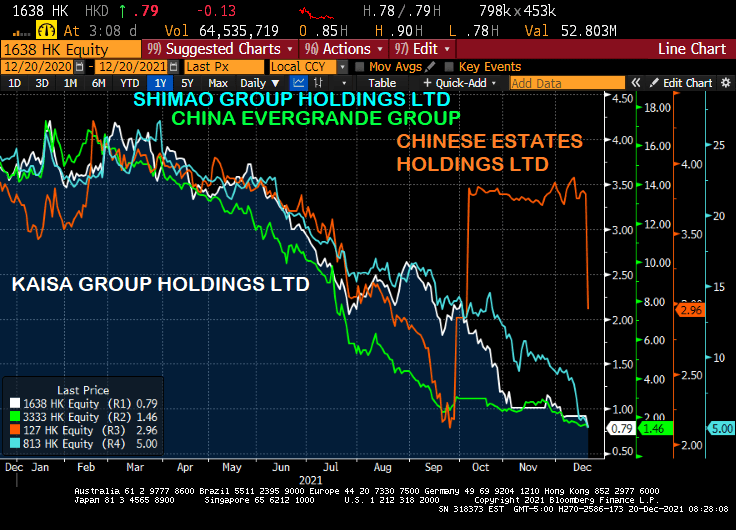
Real estate companies Evergrande, Kaisa, Shimao and Chinese Estates are falling like a rock today.
But it has been a steady decline since Q1 2021 except for Chinese Estates. But they have resumed their death dive.
On the debt side, Evergrande is down to 18.856 while Kaisa has lost less (but still quite a bit) and Shimao’s bond look almost like a good investment, relative to Kaisa and Evergrande. But they are all sucking wind. Maybe they all have the Fauci Flu?
Let’s see if this latest Chinese “export” washes ashore in the USA.
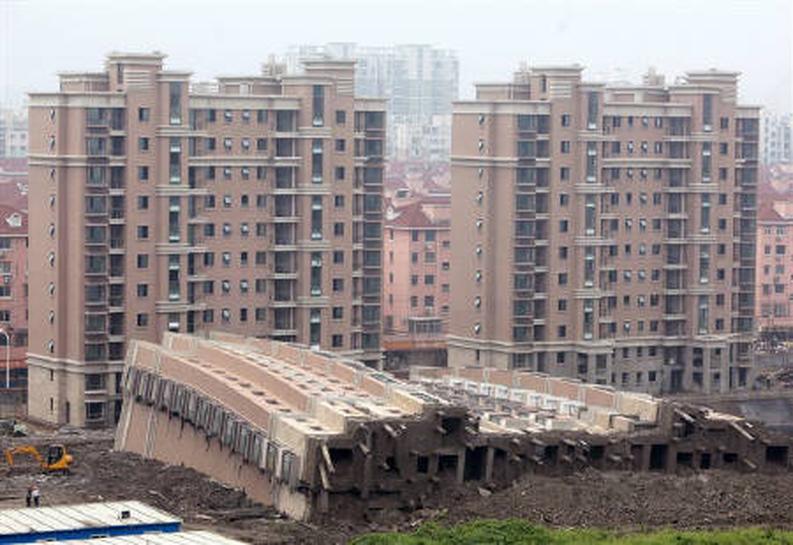
It was bound to happen given the growth rate of Chinese real estate construction.
(Bloomberg) — China Evergrande Group was labeled a defaulter by S&P Global Ratings, the second credit-risk assessor to do so.
S&P Global cut Evergrande to “selective default” over its failure to make coupon payments by the end of a grace period earlier this month, a move that may trigger cross defaults on the developer’s $19.2 billion of dollar debt. S&P Global also withdrew its ratings on the group at Evergrande’s request.
Fitch Ratings was the first to declare the property developer in default on Dec. 9. Long considered by many investors as too big to fail, Evergrande has become the largest casualty of Chinese President Xi Jinping’s campaign to tame the country’s overindebted conglomerates and overheated property market. Concern has since spread to higher-rated firms like Shimao Group Holdings Ltd. as liquidity stress intensifies.
A cautionary tale of government pushing real estate construction.


You must be logged in to post a comment.