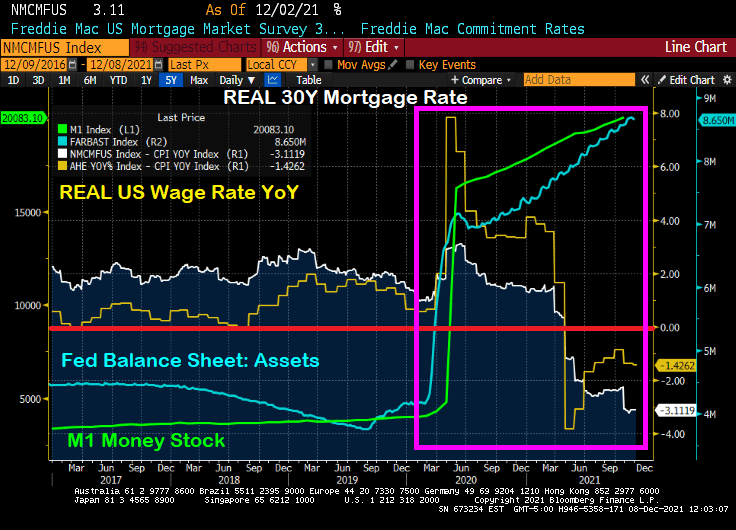
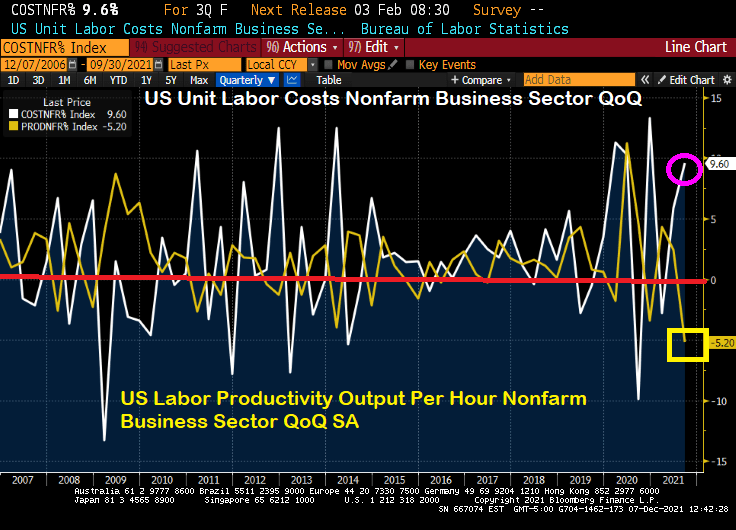
If this what the Biden Administration had in mind? Soaring labor costs at the same time that labor productivity is falling to its lowest level since 1960?
Powell and the Gang’s monetary approach doesn’t seem to be working for the labor market …
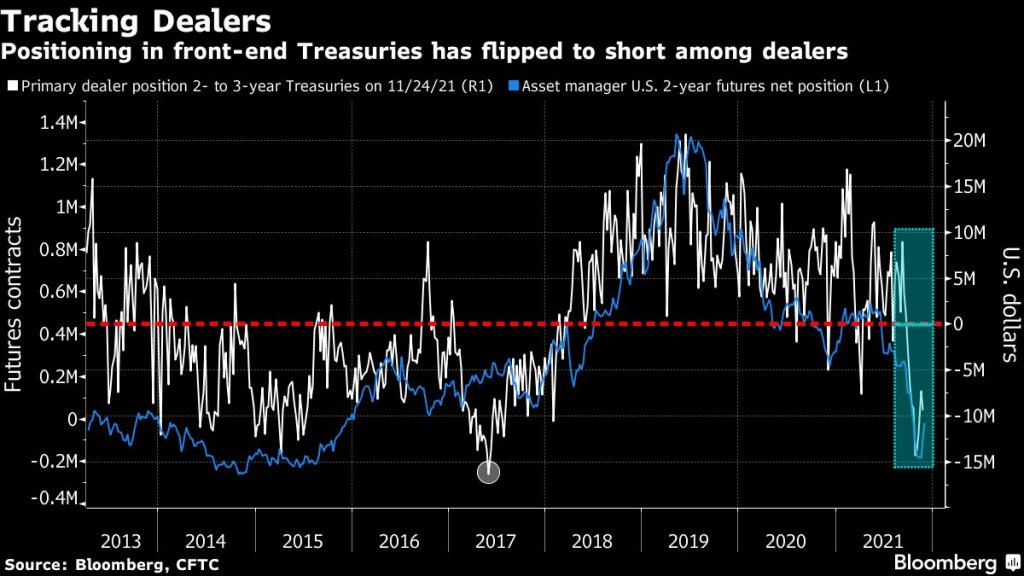
(Bloomberg) — The recent drop in primary-dealer holdings of front-end Treasuries is another warning of potential market dislocation heading into the year-end liquidity vacuum.
As of Nov. 24, primary dealers — which are mostly the large banks — were on the whole betting against two- to three-year Treasuries rather than buying. They had net short positions of just over $9 million, near the most bearish levels since 2017, signaling a pullback by buyers that provide crucial liquidity for older Treasury issues.
The positioning in the front-end of the curve “suggest less demand from the dealer community to fund off-the-run long positions,” Barclays strategists Anshul Pradhan and Andres Mok say in a Dec. 3 note. Off-the-run Treasuries are notes and bonds created in past years and traded less frequently than the newest issues; they’re the biggest part of the market and make up most of the Federal Reserve’s daily asset purchases, which are being scaled back.
Short positioning increased on a relative basis as a result, “which may also have crowded demand to borrow particular issues over others,” the analysts wrote.
Those forces together could contribute to an increase in market dislocations.
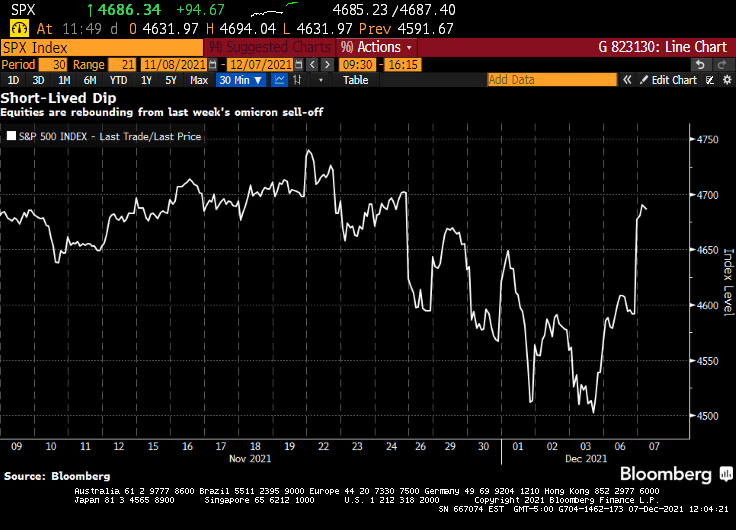
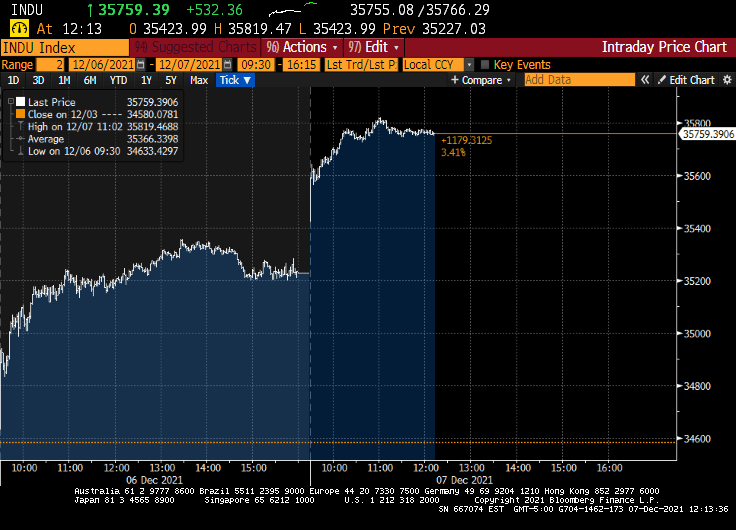
Jerome Powell’s hawkish pivot shocked financial markets. A week later, stocks are higher. The S&P 500 staged its biggest rally since March to wipe out losses from the past week. The speculative fringe that was a smoldering wreck Friday was soaring Tuesday. An index of meme stocks rallied more than 4%, while one composed of airlines added 1.6%. A gauge of newly public companies advanced more than 4%, SPACs jumped more than 2% and even cryptocurrencies rallied, with Bitcoin powering back above $51,000.
It’s a stunning about-face for risk assets that went into a tail spin after the Federal Reserve chair suggested he favored accelerating the removal of monetary support. What follows are takes from market-watchers on why the market is looking past the Fed’s potential change in policy.
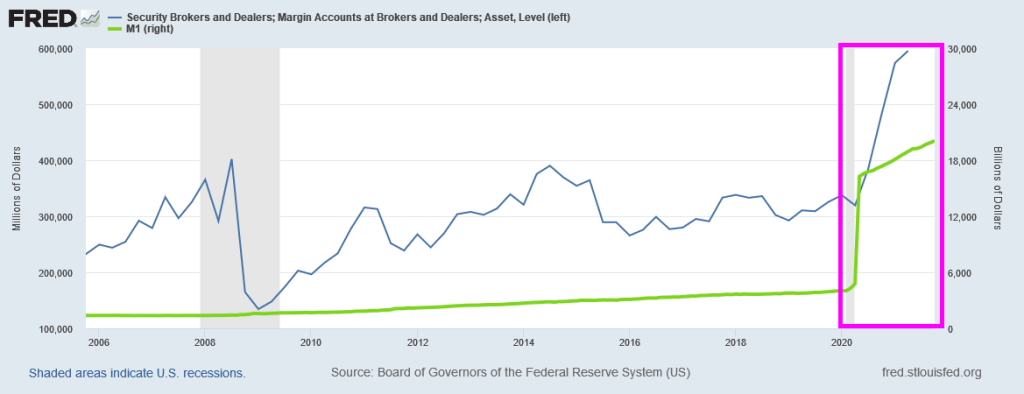
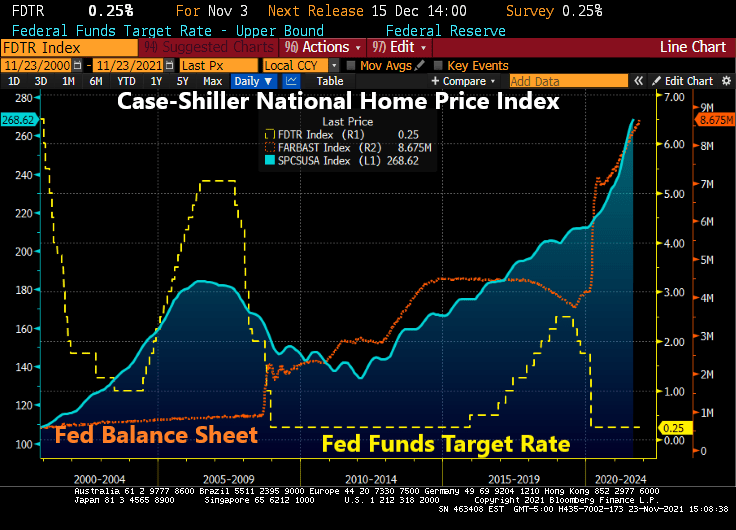
As we are all painfully aware, The Federal Reserve went on a 2nd money printing spree to allegedly stave-off the economic impacts of the COVID outbreak in March 2020. The first money printing spree took place in late 2008 as The Fed tried to stave-off the economic impacts of the housing bubble burst of 2008 and the ensuing financial crisis.
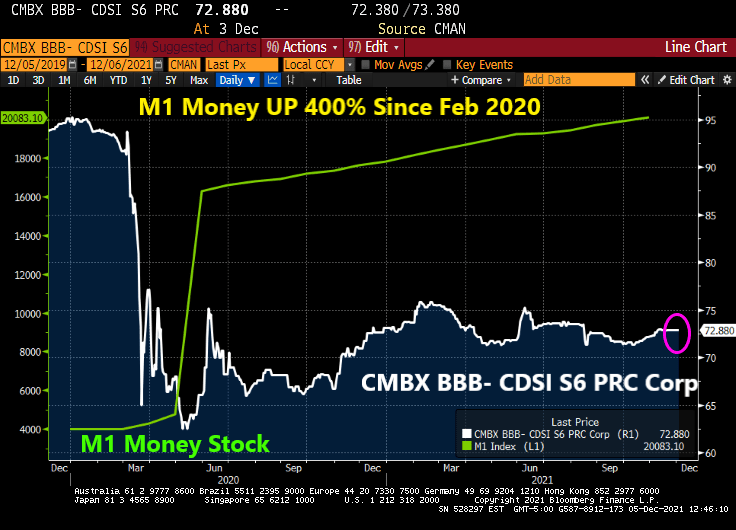
But for now, we have this horrifying chart showing the exploding margin accounts at security brokers and dealers (not, not the Walter White-type dealers, but Wall Street dealers). Notice the 400% surge in M1 Money stock after COVID struck.
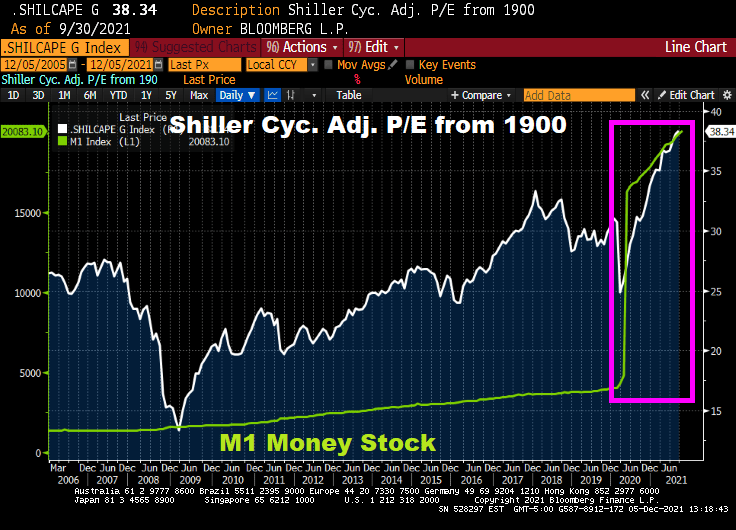
Of course, the soaring stock market is feeding the margin loop, encouraged by The Fed. Check out the Shiller Cyclically Adjusted Price Earnings (CAPE) ratio after The Fed’s M1 printing storm.
What can’t money printing fix? How about CMBS prices (or CMBX BBB- S6 prices … down 30.5% since just before COVID struck.
Let’s see if The Fed sucks the 400% growth back to zero.
The latest scare hitting financial markets is the Omicron Variant (or Oh! Macron! Variant in France). While it caused an initial decline in global equity markets {Dow fell 900 points on early reports on Omicron), the Treasury market has been relatively unscathed.
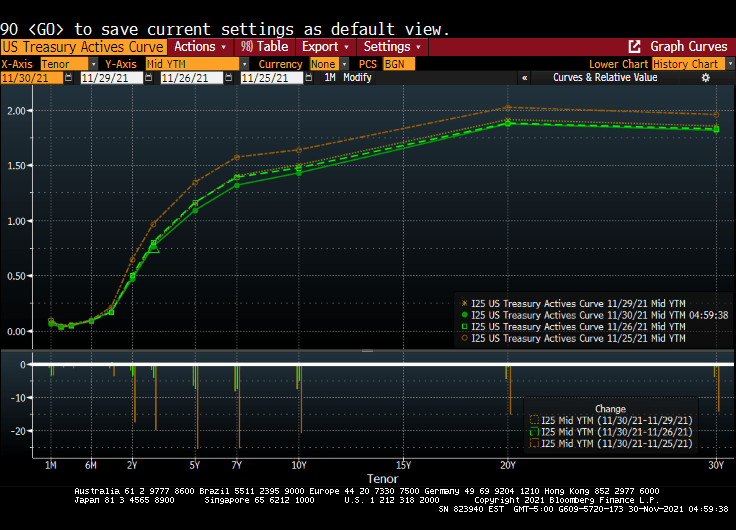
For example, the US Treasury Actives curve dropped last Friday (the orange line represents the Wednesday before Thanksgiving), while the remaining three lines represent last Friday, Monday and Tuesdays (today). In other words, the US Treasury Actives curve has been quiet so far this week after Friday’s flattening.
The US Dollar Swaps curve shows the same dynamics. The dark blue line is last Wednesday, while the remaining lines are last Friday, this Monday and today. Not a lot happening after the initial Omicron fear factor was priced in.
Federal Reserve Chairman Jerome Powell believes that the omicron variant of Covid-19 and a recent uptick in coronavirus cases pose a threat to the U.S. economy and muddle an already-uncertain inflation outlook.
“The recent rise in COVID-19 cases and the emergence of the Omicron variant pose downside risks to employment and economic activity and increased uncertainty for inflation,” Powell said in remarks he plans to deliver to Senate lawmakers on Tuesday. “Greater concerns about the virus could reduce people’s willingness to work in person, which would slow progress in the labor market and intensify supply-chain disruptions.”
Do I detect FEAR in Powell’s voice? The odds of rate increases for next year just fell to one rate increase at the September 2022 meeting.
On the equity side, it seems to be all about whether The Fed will withdraw its support. Back in early 2018, then Fed Chair Janet Yellen and the FOMC started to shrink the Fed balance sheet (green line). This resulted in the “Smart Money Index” declining. The S&P 500 index received a jolt with the Fed stimulus around the COVID outbreak and have taken off like a jackrabbit. Despite the Smart Money Flow index being lower than in 2017.
So, is Omicron the “planet killer” or just another mild flu-like outbreak? The data is pointing towards the latter, but FEAR may cause it to be a bigger deal than is warranted.
I have written numerous times about nothing has been the same since the housing bubble burst and ensuing financial crisis of 2008. The crisis led to bank bailouts (TARP) and banking legislation (Dodd-Frank) giving The Federal Reserve even more power. And then the COVID lockdowns led to even MORE power for The Fed. And a horrid decline in money velocity (the ability of printing money to increase economic growth … or GDP).
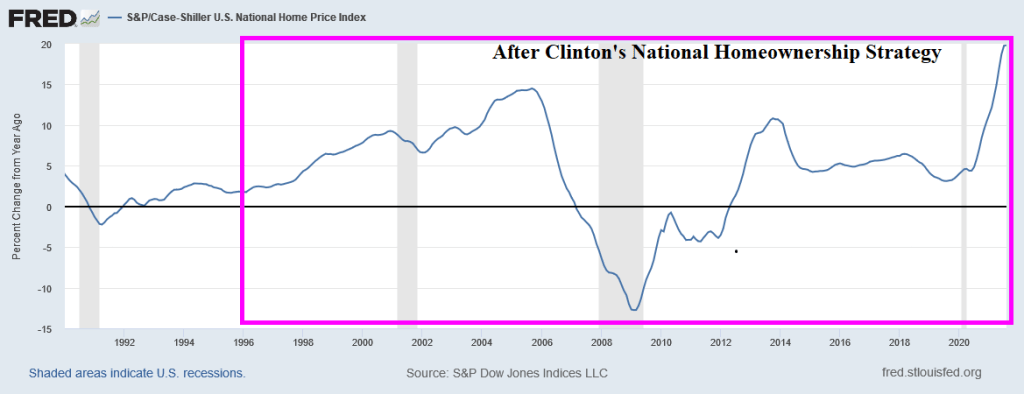
But let’s take one step backwards. One the causes of the housing bubble that burst was President Clinton’s infamous National Homeownership Strategy that encouraged “partners” with the Federal government to soften underwriting standards for mortgage lending, particularly for minority households. The intent was to increase the homeownership rate in the US and it worked! Too well. Along with increasing the homeownership rate came rising home prices, culminating with home price growth reaching 14.5% YoY in September 2005. Only to start slowing to a crash.
Of course, the housing bubble was associated with no/low documentation and subprime mortgage lending. But the relaxing of underwriting standards by the National Homeownership Strategy helped fuel the no/low doc and subprime lending crisis. But weakening underwriting standards to increase homeownership rates is a dangerous strategy.
Note the surge in M1 Money Velocity (GDP/M1) starting in 1994. M1 Velocity grew until Q4 2007, then crashed along with home prices. The second and more sudden crash in M1 Velocity occurred with the COVID outbreak in March 2020 and the ensuing economic lockdowns and the intervention of The Federal Reserve in terms of money printing. M1 Money surged 173% from October 2008 to February 2020 and then another 369% from March 2020 to today. THAT is a Fed Storm Surge!!
M2, the broader definition of money, has not grown as rapidly as M1, but it still grew at an alarming rate. Atlanta Fed President Raphael Bostic blamed inflation on COVID but not The Fed’s insane money printing or government lockdowns. C’mon man!
Finally, the banking crisis (and TARP bailouts) along with COVID have made consumer purchasing power of King Dollar even worse.
Be careful of government strategies to make housing more “affordable” because they seem to make housing more expensive and can help crash the financial system.
Renters in the US are getting clobbered by inflation.
The US Zillow Rent Index All Homes YoY + CPI YoY is one measure of renter misery.
The classic misery index (CPI YoY + U-3 unemployment rate) is 10.80%.
Then there is inflation in food prices, gasoline, heating oil, natural gas, etc.
While Biden is releasing the Strategic Petroleum Reserves (SPR) in order to mitigate the problem that he created by terminating the energy pipelines and oil/natural gas drilling permits in the name of “Going Green!” But on the announcement of tapping the SPR, crude oil futures actually rose.
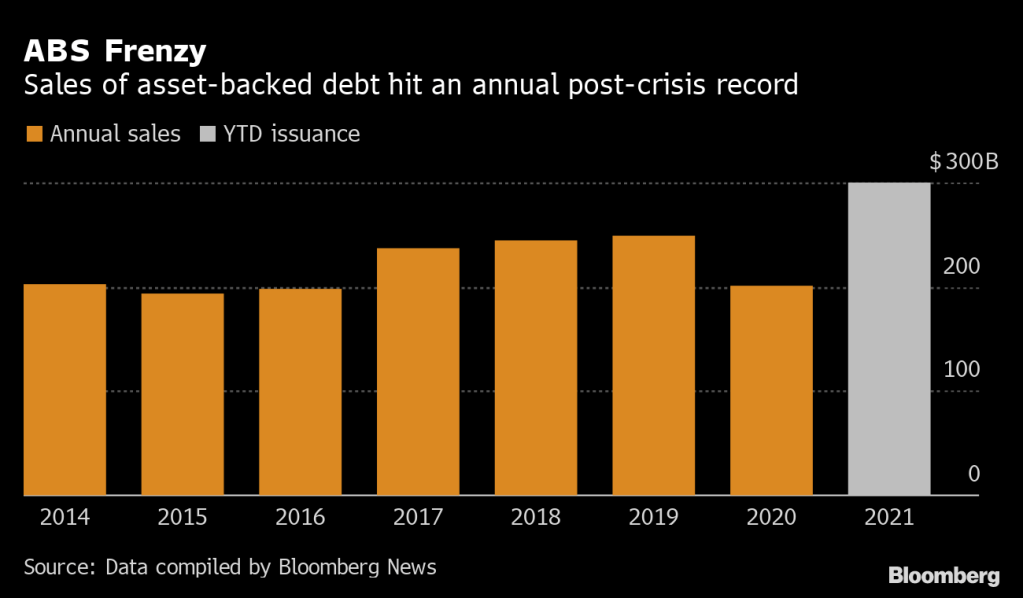
I remember the surge in securitization of loans, receivables, etc during the housing bubble of the mid-to-late 2000s. Today seems like 2007 all over again.
(Bloomberg) — Bankers are repackaging everything from fast food franchises to fitness-center fees into bonds at the fastest clip since the global financial crisis as investors chase yield and inflation protection.
This year’s sales of U.S. asset-backed securities have already surpassed $300 billion, according to data compiled by Bloomberg — and more is expected by year-end. Post-crisis issuance records have also been set in private-label commercial mortgage bonds and collateralized loan obligations, which are also seen accelerating.
“Solar, consumer loans, container lease and whole business transactions to some degree all offer attractive yields and spreads,” said Dave Goodson, head of securitized credit at Voya Investment Management. “These so-called esoteric sectors remain well supported with plenty of money to invest.”
On Monday, Self Esteem Brands, a franchiser of businesses including its flagship gyms Anytime Fitness, priced a $505 million ABS that was backed by franchise agreements, royalties and fees. In whole business securitizations like these, companies mortgage virtually all their assets.
Last month, fried chicken restaurant chain Church’s Chicken sold a $250 million securitization backed by franchise and royalty collateral. Golden Pear Funding recently securitized litigation fees related to financial settlements on everything from personal injury cases to wrongful convictions. And Oasis Financial priced a similar deal linked to payments on medical liens.
Then we have this headline that will send chills through the CMBS market for retail space, particularly at a time when commercial real estate (particularly RETAIL) are trying to recover from COVID lockdowns and the growth of online shopping.
“Retailers Sound Alarm on Organized Theft as States Warn of Rise”
Retailers say shoplifting is getting more brazen in the U.S.: A California Nordstrom store was recently hit by a flash mob of more than 80 people who made off with designer goods, while more than a dozen people pilfered from a Louis Vuitton location in a suburb of Chicago.
On Tuesday, the impact of shoplifting reached Wall Street, with Best Buy Co. shares plunging after the electronics retailer said widespread theft contributed to a decrease in one gauge of profitability. Last month, Walgreens said it would close five San Francisco stores after theft rates there spiked.
Seemingly, no one learns from history. Or as the zen master Yogi Berra once said “It’s like déjà vu all over again.”
Or “You better cut the pizza in four pieces because I’m not hungry enough to eat six.”
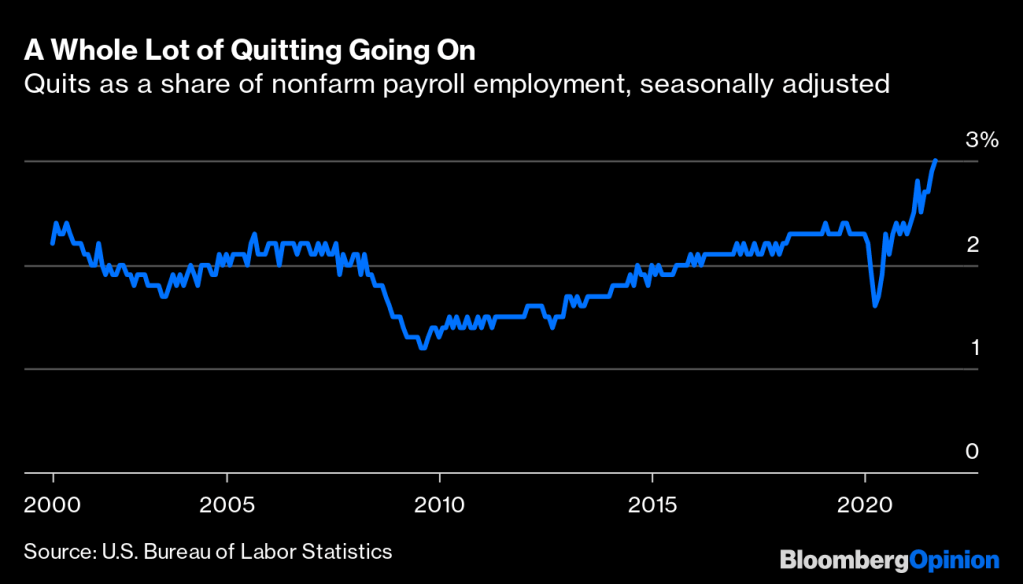
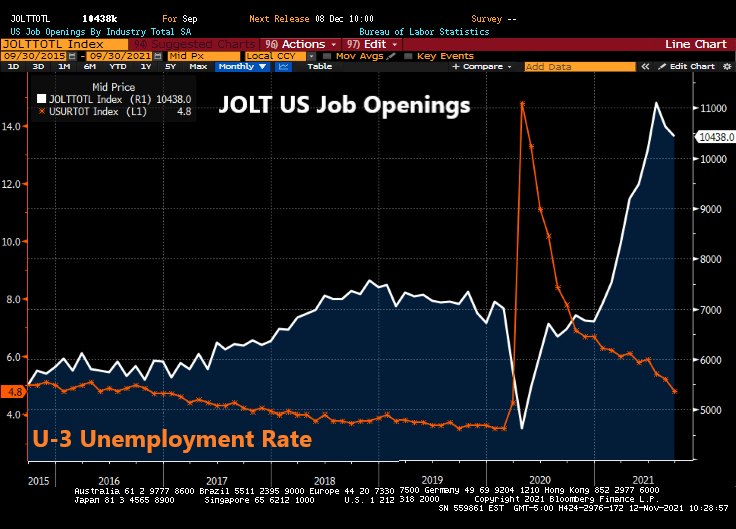
Is the US at full employment? That is, is the US at REALISTIC full employment? And if the US is at realistic full employment, why is The Federal Reserve keeping rates at 25 basis points??
Let’s start with the “quits” data. An estimated 3% of American workers quit their jobs in September, the Bureau of Labor Statistics reported last week.1That’s the highest percentage since the BLS started keeping track two decades ago.
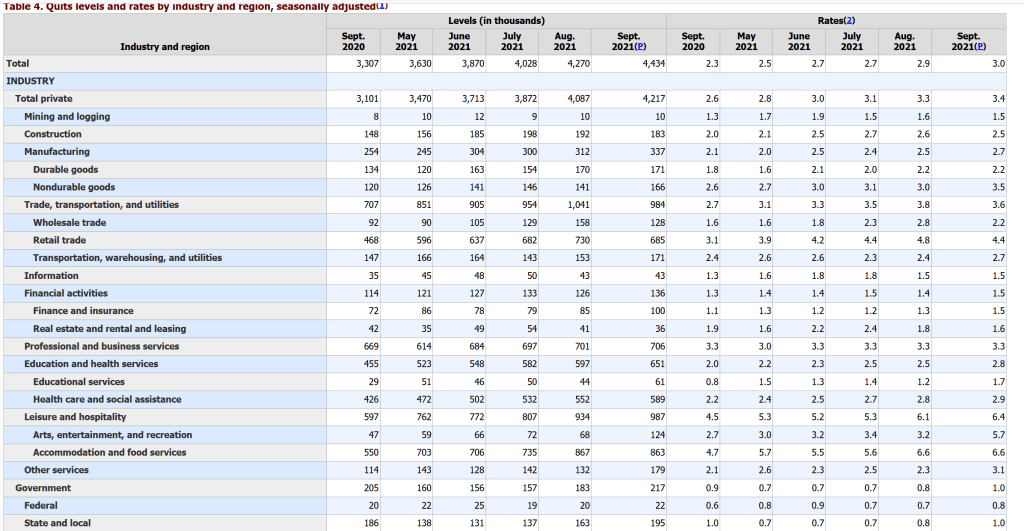
Front-line and low-wage workers are leaving at rates higher than historical norms while higher-paid office workers aren’t. College-educated workers haven’t been quitting or dropping out of the workforce at higher rates than before the pandemic, but less-educated workers have.
The quits rate in professional and business services was just 0.4 percentage points higher in September than before the pandemic in February 2020. In financial activities it was unchanged. In the information sector, made up of telecommunications, publishing, broadcasting, motion pictures, software and most internet companies, the quits rate was down 0.3 percentage points.
The biggest increases in quit rates were in sectors such as leisure and hospitality where office workers are few, working remotely seldom an option and wages low. Within manufacturing, the quits-rate increase has been much bigger in lower-paying nondurable goods (of which food manufacturing is the biggest part) than in higher-paying durable goods.
In particular, fast food restaurants are offering above minimum wage salaries to attract workers. Burger King was even offering college tuition (not to University of Chicago, but to the local community college).
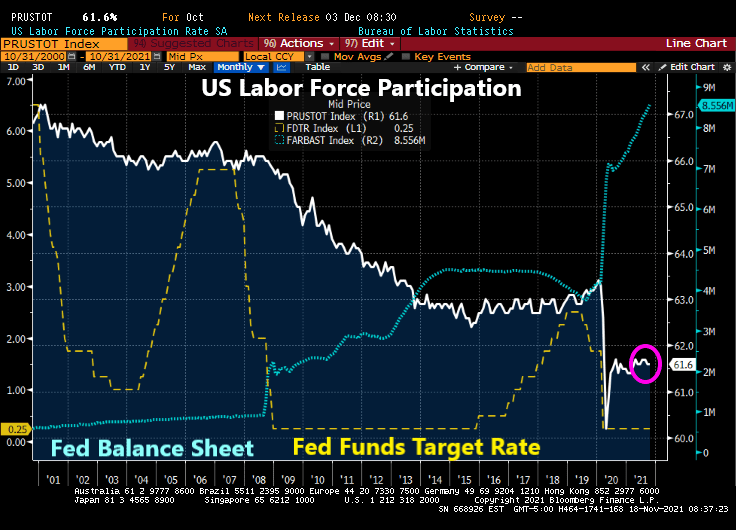
Labor force participation crashed with COVID and has struggled to recover, despite the staggering monetary stimulus. If this a sign that the US is at full employment (or very difficult to entice workers to enter and stay in the labor force)?
US housing starts for October were less than expected. A 1.5% increase MoM was expected, but housing starts actually fell -0.7% MoM.
5+ unit (multifamily) starts were up 6.82% MoM. 1-unit single family detached units were down -3.89% MoM. Permits to build were up 4% MoM.
On a YoY basis, 1-unit start declined -10.6% as M2 Money growth continues to fall.
And 1-unit housing starts have fallen with the rapid decline in home buying sentiment.
1-unit starts have slowed to pre-COVID levels, thanks in part to The Federal Reserve’s money printing bonanza which may never end.
As housing sentiment crashes (due to rapid home price growth), we are seeing the demand for multi-family housing rise. 5+ unit (multifamily) starts were up 6.82% MoM in October.


You must be logged in to post a comment.