A national mortgage lender has just introduced a 105 Loan-to-value (LTV) ratio loan and a lowering of FICO scores from 660 to 620.
Now, the loan still requires 97% LTV with downpayment assistance and gift funds permitted to boost CLTV to 105%.
With The Fed helping to raise home prices at a whopping 20% YoY, …
lenders are trying to find loan products for lower-income households so they can get in on the bubble! Hence, a 105% CLTV mortgage product with reduced credit requirements and increased Debt-to-income requirement rising from 43% to 45%. Also, borrowers can avoid the 3% downpayment requirement and put down only $500.
This is lending into the storm: softening of underwriting requirements as the house price bubble surges. Sound like 2005. This was not supposed to happen. After the housing bubble burst and the financial crisis, The Fed was supposed to encourage counter-cyclical lending (tighten credit standards as a housing bubble worsens). Instead, lenders are lowering credit standards, feeding the house price bubble.
If this was just one lender, I would have barely noticed. But this mortgage is being offered by most banks. And then sold to our GSEs: Fannie Mae and Freddie Mac.
Speaking of lending into a storm, as part of the raft of new legislation designed to spur first-time homeownership in America, a remarkable bill has joined the fray: its sponsors propose creating a new subsdizied 20-year-fixed-rate mortgage program through Ginnie Mae, HousingWire reports.
According to the bill, Ginnie Mae in tandem with the Department of the Treasury would subsidize the interest rate and origination fees associated with these 20-year mortgages, so that the monthly payment would be in line with a new 30-year FHA-insured mortgage. The move – which is an explicit subsidy of one share of the population by another – could, in theory, “allow qualified homebuyers to build equity-and wealth- at twice the rate of a conventional 30-year mortgage.” Instead, what it will do is lead to is an even bigger housing bubble.
Phil Hall of Benzinga wrote a series of excellent articles in four parts for MortgageOrb (although “The Orb” has removed his name). Here are the links to his stories.
After re-reading these excellent articles on the housing bubble and crash, I thought I would take the opportunity to present a few charts to highlight the housing bubble, pre-crash and post-crash.
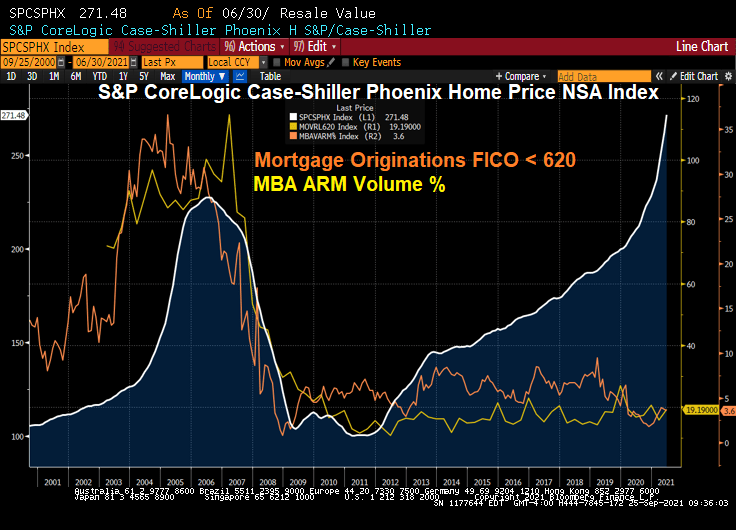
Here is a graph of Phoenix AZ home prices. Note the bubble that peaked in mid 2006. The Phoenix bubble correlates with the large volume of sub-620 FICO lending and Adjustable-rate mortgage (ARM) lending. Bear in mind, many of the ARMs prior to 2010 were NINJA (no income, no job) ARM loans.
What happened? Serious delinquenices at the national levels spiked as The Great Recession set in and unemployment spiked.
Since the housing bubble burst and surge in serious mortgage delinquencies, The Federal Reserve entered the economy with a vengeance. And have never left, and increased their drowning of markets with liquidity.
The Fed whip-sawing of interest rates in response to the 2001 recession was certainly a problem. They dropped The Fed Funds Target rate like a rock, then homebuilding went wild nationally and home prices soared thanks to Alt-A (NINJA) and ARM lending. But now The Fed is dominating markets like a gigantic T-Rex.
Oddly, then Fed Chair Ben Bernanke never saw the bubble coming. Or the burst.
Speaking of pizza, Donato’s from Columbus Ohio is my favorite. Founder’s Favorite is my favorite, but they do offer the dreaded Hawaiian pizza (ham, pineapple, almonds and … cinnamon?)
I certainly hope The Federal Reserve starts normalizing interest rates. Hold that Fed tiger!
(Bloomberg) — Sales of previously owned U.S. homes fell in August, suggesting that demand is moderating as lean inventory and high prices squeezed out some buyers.
Contract closings decreased 2% from the prior month to an annualized 5.88 million, in line with economists’ estimates, figures from the National Association of Realtors showed Wednesday. “Clearly the home sales are settling down but above pre-pandemic conditions,” Lawrence Yun, NAR’s chief economist, said on a call with reporters.
Lawrence Yun is correct. There was a huge spike in existing home sales (EHS) following the Covid outbreak and the overreaction by The Federal Reserve (aka, when the ain’ts went marching in). Despite continuing stimulus, but EHS has simmered down.
At least the median price of EHS YoY slowed to 12.1% YoY as The Fed slows M2 Money growth.
Inventory remains relatively low compared to historic levels while price zooms with Fed stimulus.
Want home price growth to slow its insane growth? Hold that tiger! That is, The Fed has to start normalizing interest rates.
This is the Steve Urkel economy where The Federal Reserve and Federal government screw everything up with their policies (or follicies) and say “Whoops! Did I do that?”
(Bloomberg) — U.S. consumer sentiment rose slightly in early September but remained close to a near-decade low, while buying conditions deteriorated to their worst since 1980 because of high prices.
The University of Michigan’s preliminary sentiment index edged up to 71 from 70.3 in August, data released Friday showed. The figure trailed the median estimate of 72 in a Bloomberg survey of economists.
Buying conditions for household durables, homes and motor vehicles all fell to the lowest in decades. The report said the declines were due to complaints about high prices. Consumers expect inflation to rise 4.7% over the coming year, matching the highest since 2008.
September’s UMich Buying Conditions for Houses fell to 60 … thanks to superheated house prices.
I can just picture Fed Chair Jerome Powell channeling Steve Urkel and saying “Whoops!! Did I do that?”
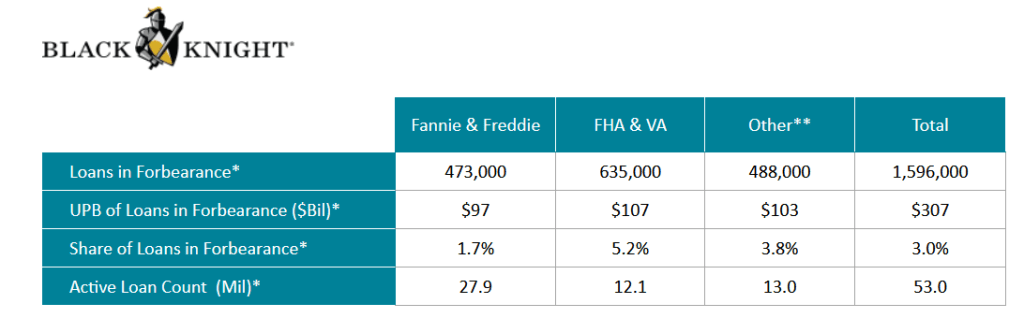
The Covid epidemic hit the single-family mortgage market hard in early 2020, leading mortgage lenders and servicers to offer FORBEARANCE to borrowers who were having trouble making their mortgage payments due to loss of hours or a loss of job.
The good news? Active forbearance plans are much lower today than at their peak after the Covid epidemic struck in early 2020 with active forbearance plans peaking in May 2020.
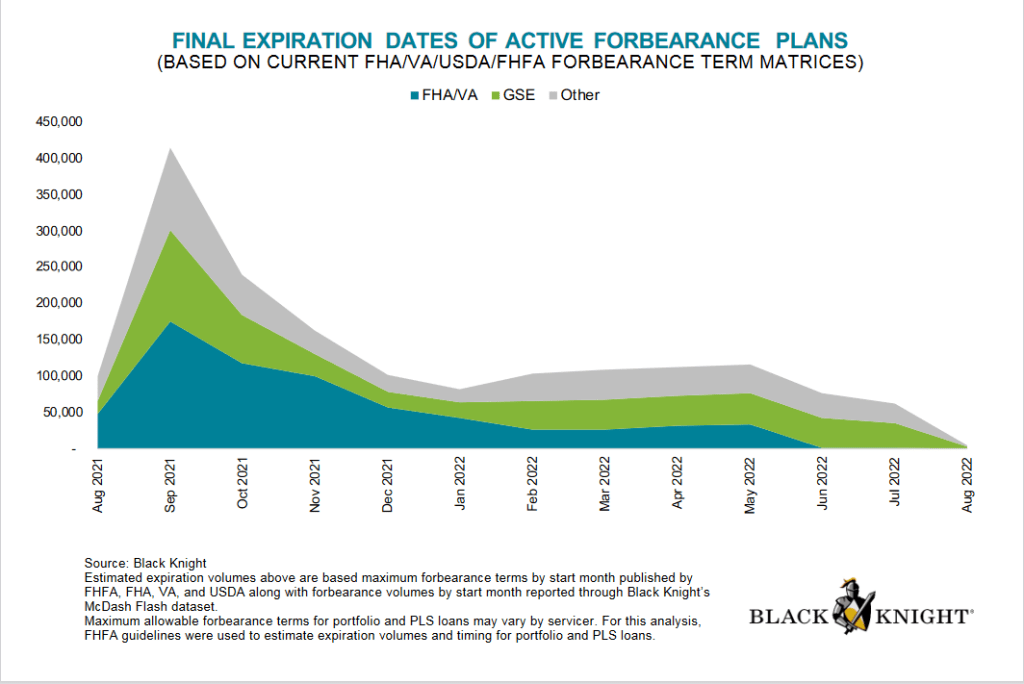
Forbearance plans are due to expire in
What is forbearance, you ask? Forbearance is when a mortgage servicer or lender allows a borrower to temporarily pay their mortgage at a lower payment or pause paying your mortgage. The borrower will have to pay the payment reduction or the paused payments back later.
Despite forbearance, Fannie Mae still reported $7.2 billion in net income in Q2 2021. Notice the difference between single-family SDQ and the SDQ rate without forbearance. Freddie Mac reported $3.7 billion in Q2 2021 net income.
Here is a look at Fannie Mae’s net income over the past year and SDQ rates.
Under the existing seller/servicer eligibility requirements, the Agency SDQ Rate is defined as 100 multiplied by (the UPB of mortgage loans 90 days or more delinquent or in foreclosure for Fannie Mae, Freddie Mac, and Ginnie Mae/Total UPB of mortgage loans serviced for Fannie Mae, Freddie Mac, and Ginnie Mae). Beginning with the financial quarter ending Jun. 30, 2020, the Agency SDQ Rate will include an adjustment for mortgage loans in a COVID-19-related forbearance plan that are 90 days or more delinquent and were current at the inception of the COVID-19-related forbearance plan. The UPB of such mortgage loans shall be multiplied by .30 and added to the UPB for SDQ mortgage loans for the purposes of determining the numerator in the calculation of the Agency SDQ Rate.
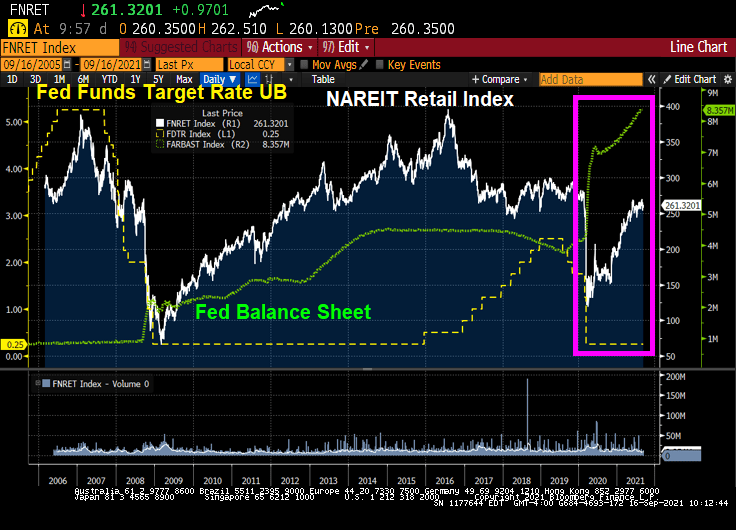
It is tough to operate a retail Real Estate Investment Trust (REIT) in the face of the triple whammy that hit retail shopping. First, there was the housing bubble/subprime crisis of 2008-2009. Then there was the advent of on-line shopping, then COVID.
I look at the NAREIT retail index and two retail REITs for comparison: Simon Property Group and Washington REIT. And as a proxy for online shopping, I compare them to Amazon. Both Washington REIT and the NAREIT retail index were at loft valuations at the peak of the housing bubble, but crashed with the onset of the housing bubble burst and ensuing financial crisis. But following The Great Recession, both recovered by 2016 (along with Simon Property Group which actually far exceeded their pre-Great Recession peak.
ii
But then retail mall disaster struck. In the form of on-line shopping. I use Amazon to represent on-line shopping. While NAREIT Retail and Simon fell from their 2016 peak, Washington REIT got clobbered.
Then Covid struck. When combined with on-line shopping and fear mongering by Anthony Fauci, retail REITs got hit hard. But all three have rebounded slightly since their nadir in 2020.
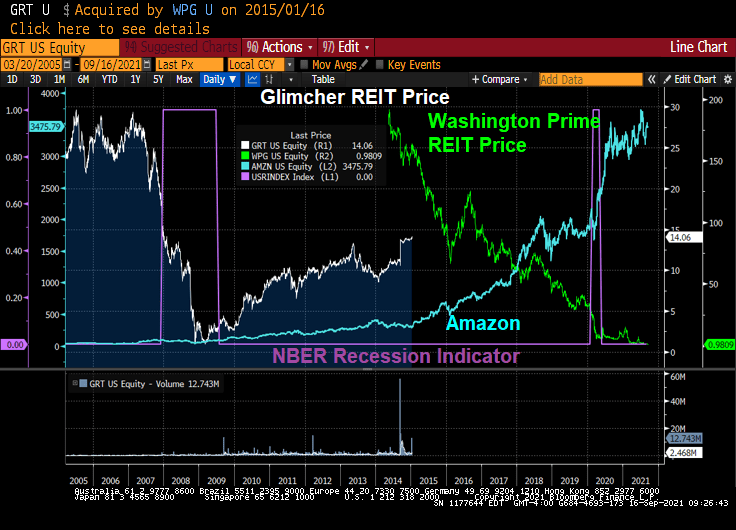
An interesting case study is Glimcher REIT, a formerly privately-held commercial real estate development company from Columbus Ohio. Like other retail REITs, Glimcher was crushed by the financial crisis and Great Recession. Glimcher’s share price fought back to $14.06 per share (down considerably from $29.28 in February 2007).
Washington Prime Group Inc. acquired Glimcher Realty Trust for $4.3 Billion in stock and cash Including the assumption of Glimcher’s debt. Right as on-line shopping took off. And the Covid struck a death blow leaving Washington Prime trading at $0.98. Washington REIT is transforming into a multifamily REIT given the overbuilding of DC area office space and the triple whammy of retail centers.
Retail REITs have almost recovered from Covid, thanks to the massive monetary stimulus from The Federal Reserve. Not to mention fiscal stimulus from DC.
Yup, a triple whammy has hit retail REITs with some faring better than others.
But the NAREIT RESIDENTIAL Index has exploded with Fed stimulus.
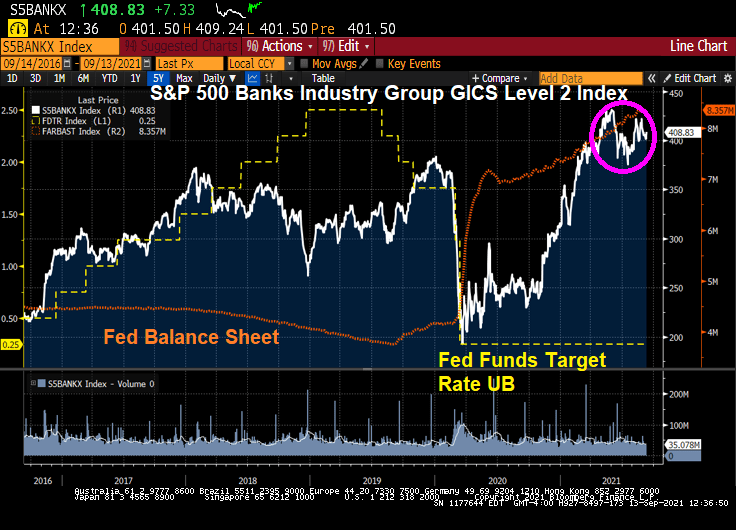
US bank loans and leases are slowing, yet The Federal Reserve has helped keep their stock values elevated thanks to the extraordinary monetary stimulus.
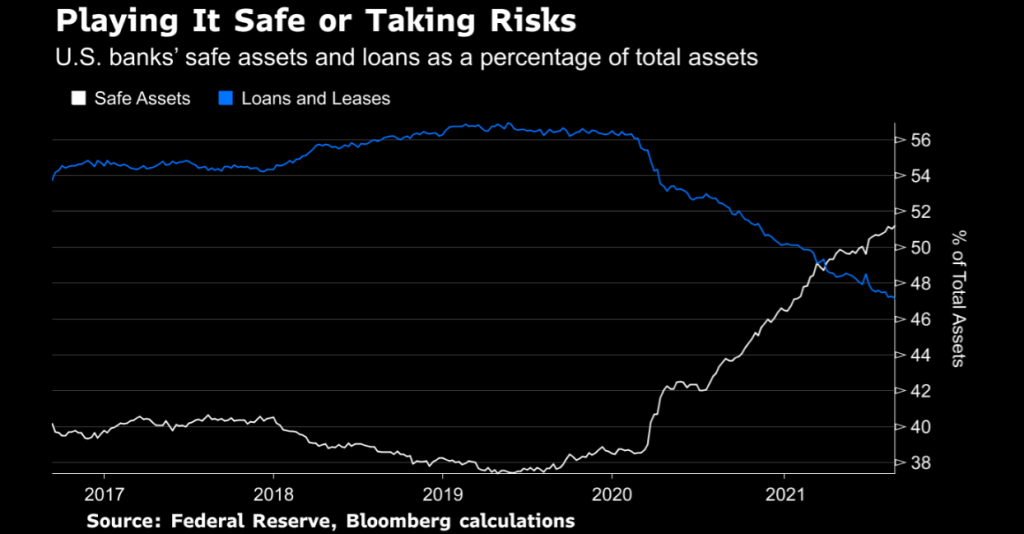
(Bloomberg) — U.S. banks’ loans and leases dropped to 47.15% of total assets in the week to Sept. 1 from 47.24% the week before, according to the Fed
Total assets increased to $22.19 trillion from $22.10 trillion
The share of safe assets — virtually riskless investments such as cash, Treasuries, and securities effectively guaranteed by the U.S. government — increased to 51.2% of total assets from 51.0%
Loans and leases as a percentage of deposits were unchanged at 59.7% Cash was the highest as a percentage of total assets since January 2015 Residential real-estate loans hit a historic low as a percentage of total assets at 10.0% Commercial real-estate loans were the lowest as a percentage of total assets since August 2015 Consumer loans were the lowest as a percentage of total assets since May Commercial and industrial loans were the lowest as a percentage of total assets since June 2012
Only in this deranged, hyper-stimulated market can bank stocks be soaring despite slowing loan and lease growth.
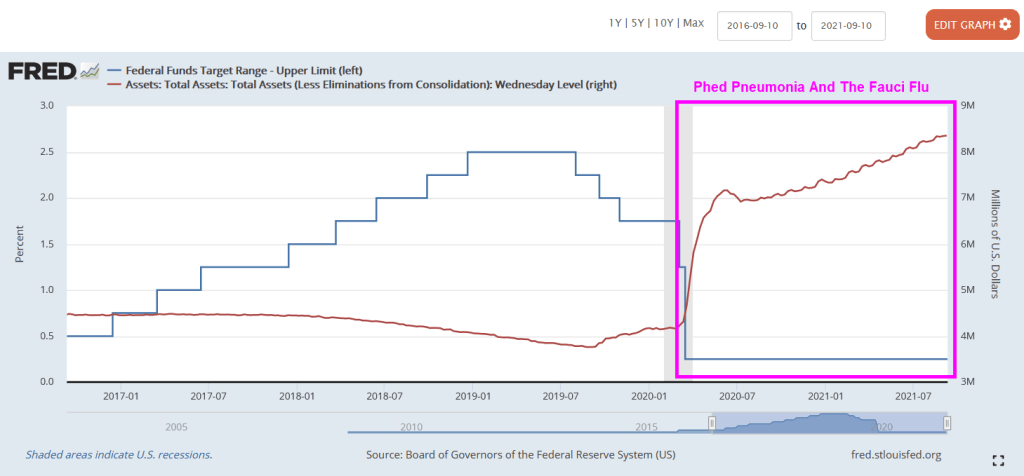
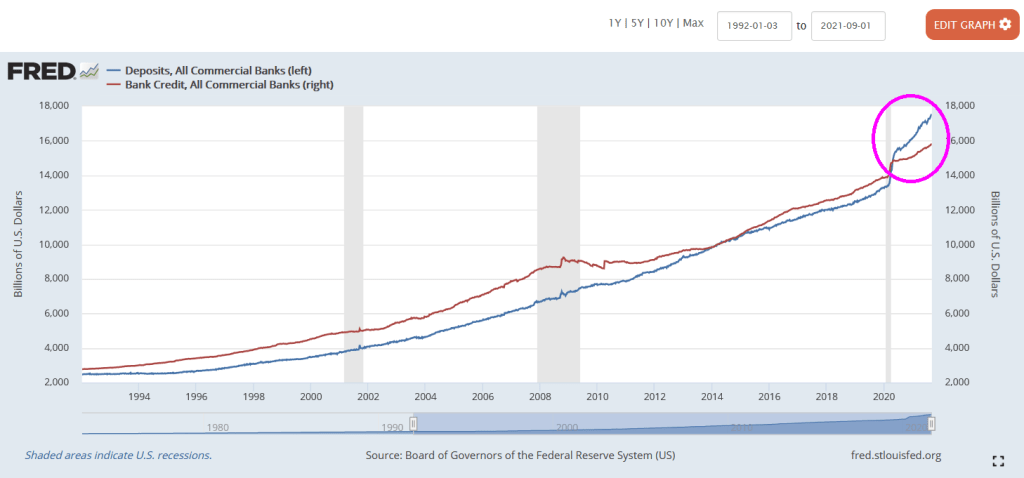
Since the Covid outbreak in early 2020, The Federal Reserve lowered their target rate and super-spiked their balance sheet. Helping to lower bank deposit rates to near zero.
But despite near zero bank deposit rates, we seeing bank deposits are larger than bank credit such as commercial and industrial loans, residential mortgages loans, car loans, etc. Normally, bank credit EXCEEDS bank deposits.
The problem? One of them is negative growth in commercial and industrial lending. It declined 13.5% YoY in August. Of course, The Federal government extended emergency business loans that were counted as C&I loans, hence the spike in C&I loan growth in May 2020. But now we are seeing a real slowdown in C&I lending.
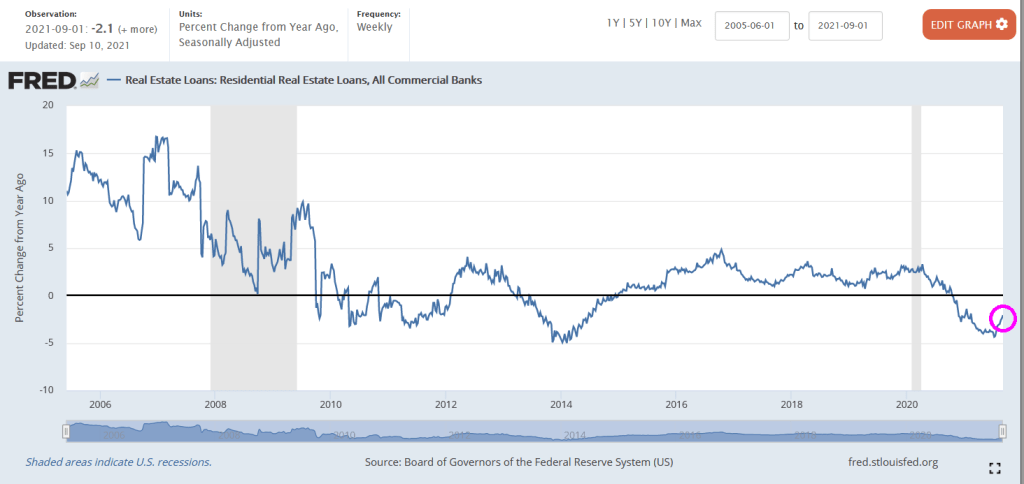
Residential lending is down 2.1% YoY as of September 10 (for August).
Commercial real estate lending? At least it is growing at a 2.9% YoY pace for August.
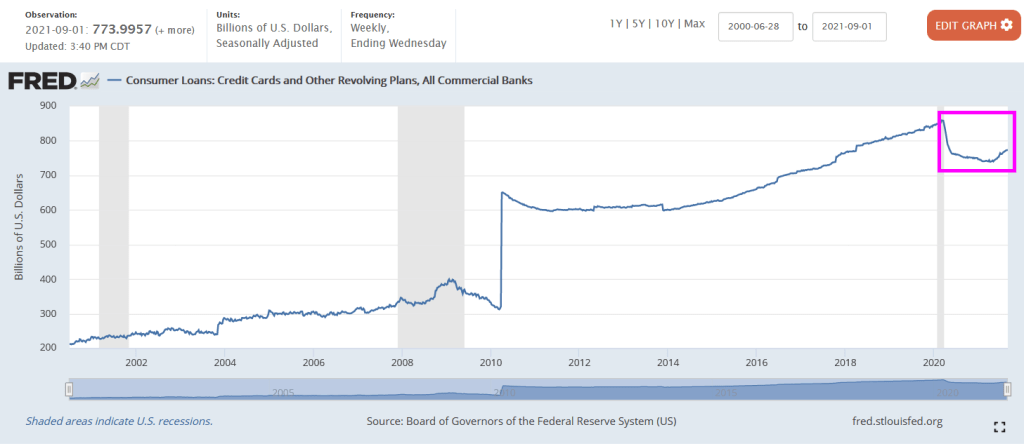
Credit cards and other revolving plans increase steadily since 2014 and then declined after the Fauci Flu struck. But credit cards and revolving credit has started to rise again.
The Fed’s massive overreaction to Covid caused a storm surge in C&I lending that has subsided. But other bank lending has slowed as well.
Lots of bank assets with nowhere to go.
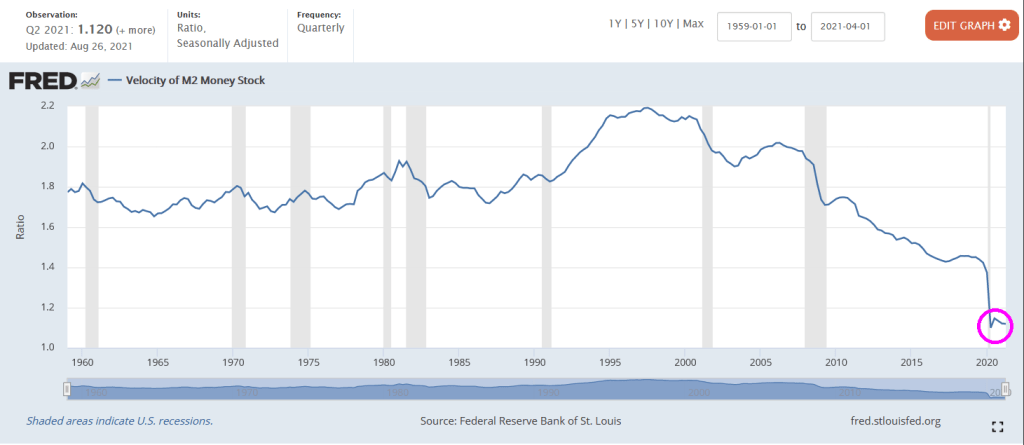
No wonder M2 Money Velocity (GDP/M2 Money) is at historic lows.
Remember, Federal Reserve Chair Jerome Powell is up for reappointment and President Biden must make a decision on his reappointment.
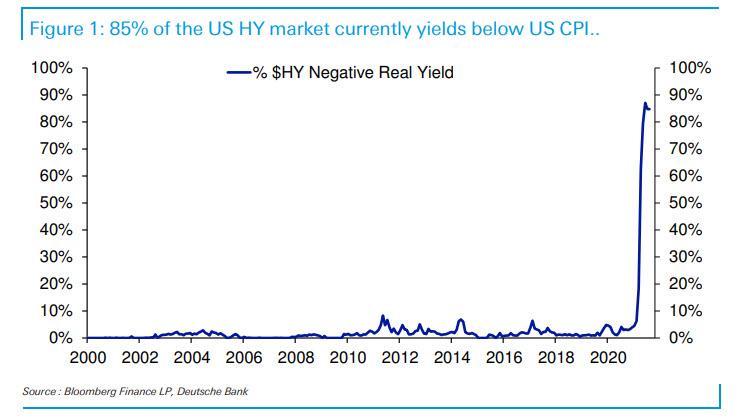
According to Deutsche Bank, 85% of the US High Yield market has a yield below the current rate of inflation.
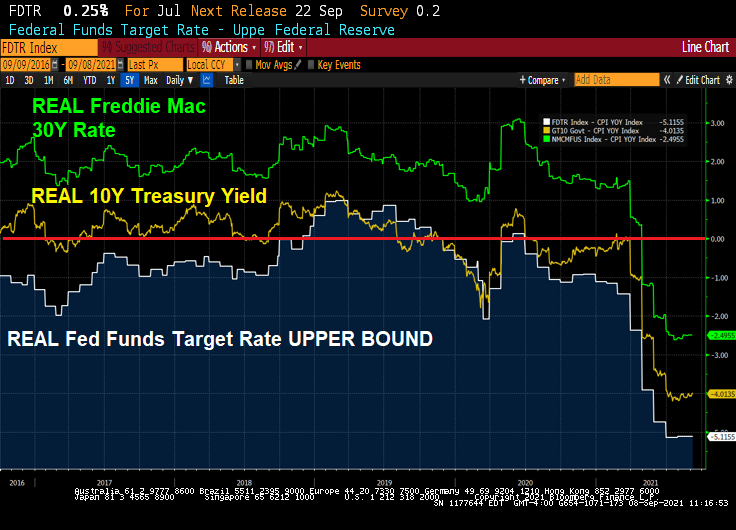
Its not only high-yield bonds that have negative REAL yields, but even The Fed Funds Target rate is negative at -5.12%. The real 10-year government bond yield is -4.01% and the REAL Freddie Mac 30-year mortgage survey rate is -2.5%.
Since the original model of The Federal Reserve was to purchase Treasuries and Agency MBS in an effort to push down interest rates, it will be quite difficult to delink the two: taper the balance sheet while not raising short-term rates.
(Bloomberg) — Bond investors may not wait long to start pushing back against Federal Reserve Chair Jerome Powell’s efforts to delink the start of asset-purchase tapering from the countdown to eventual policy-rate hikes.
Since Powell last week said the central bank could begin reducing its monthly bond buying this year, traders have stuck with early 2023 as the likely timing for the Fed’s liftoff from zero interest rates, and Treasury yields have barely budged.
But that calm faces a test starting Friday. The potential for volatility comes from the fact that when Fed officials gather this month, they will release fresh projections for the fed funds rate for the next few years. And with the labor market pivotal for Fed policy now, Friday’s August jobs report is seen as laying the foundation for these forecasts — collectively known as the dot plot — especially as some Fed officials have already been pushing for an early taper.
The upshot is that a robust reading Friday could have investors pulling forward tightening bets regardless of Powell’s efforts last week in his virtual speech at the Fed’s Jackson Hole symposium. The risk is traders will prepare for a repeat of June, when a hawkish signal via the dot-plot took markets by surprise and triggered an abrupt unwinding of wagers on a steeper yield curve.
If the employment report is “even deemed acceptable, regional presidents will be back on the tape in a flash,” sounding hawkish again, said Jim Vogel, an analyst at FHN Financial. “And you may have more officials penciling in a 2022 hike. And that would have to flatten the yield curve.”
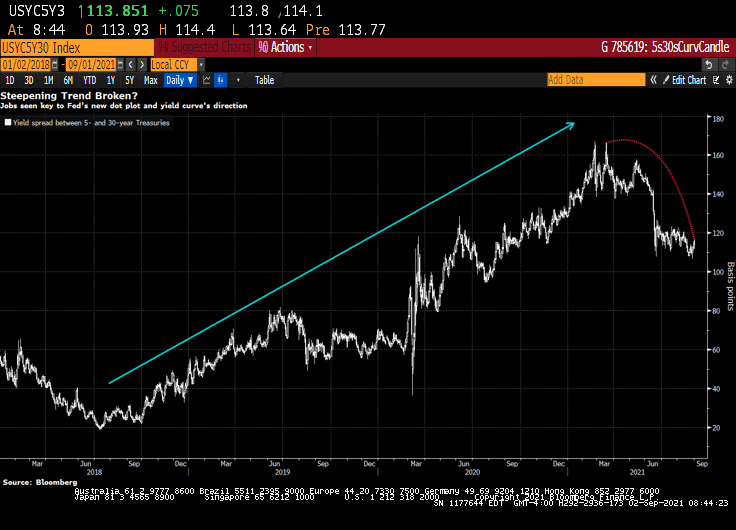
Expectations for a hawkish shift would lift 5-year Treasury yields in particular, shrinking the gap with 30-year rates, Vogel said. That spread was around 114 basis points Wednesday, down from about 140 just before the Fed met in mid-June.
Dots Math
Officials’ June quarterly forecasts not only showed a median funds rate projection of two hikes in 2023 — after the March dot plot indicated no tightening until at least 2024 — but that seven participants saw at least one increase next year. This time around, it will take just three officials to raise their dots for 2022 for a full hike to be the new median for next year, assuming everyone else keeps their projections where they were.
Traders responded to the Fed’s June rate projections by driving 5-year yields up the most in almost four months. That was even as Powell said in his press conference that the dot plot should be taken with a “big grain of salt” and discussion about raising rates would be “highly premature.”
Powell last week said “the timing and pace of the coming reduction in asset purchases will not be intended to carry a direct signal regarding the timing of interest rate liftoff, for which we have articulated a different and substantially more stringent test.”
But the leadup to the Fed decision on Sept. 22 may culminate in a dot-plot unveiling that yet again presents a communication challenge for policy makers, as has been seen several times since the Fed introduced the projections in 2012.
“There’s information in the dots, and generally it’s good information,” said Shahid Ladha, head of Group-of-10 rates strategy for the Americas at BNP Paribas SA. It makes sense for the Fed, regarding tapering and rate hikes, “to try to separate them, but I don’t think they’ll be ultimately successful in separating them.”
Trouble Ahead
Even some Fed officials are wary of being able to disentangle the tapering from rate hikes, minutes from the July Fed meeting showed.
Kevin Flanagan, head of fixed-income strategy at WisdomTree Investments Inc., which runs exchange-traded funds with assets of $75 billion, sees trouble for the Fed.
His view is that the labor market will keep gaining ground in its rebound from the pandemic, and that the median September dot may show a hike in 2022. That bodes for higher yields, a flatter curve and makes floating-rate notes appealing, he said.
The median of economists’ projection is for a gain of 725,000 jobs in August, a slowdown from June and July but well above the average for 2021. Of course, with millions still out of work relative to pre-pandemic levels, the Fed may prove to take longer to lift rates than traders expect, especially given the central bank’s “broad and inclusive” maximum-employment goal. But the market may be about to challenge that approach.
Note: Yesterday’s ADP jobs gain was forecast to be 625k jobs added in August, but only 374k jobs were actually added.
Fed Faces ‘Ugly Fight’ Over Jobs Goal in Next Big Policy Debate
“We are going to be all of a sudden talking about rate hikes potentially next year, and that is where the focus of the bond market is going to go,” Flanagan said. “The dot plot will be the Fed’s initial message for its forward guidance on rates. And then it will begin to come from Fedspeak — which is when the rubber will really meet the road.”
And with the stock market, particularly technology stocks, rising with Fed asset purchases, I wonder if The Fed forecasts that assets prices will keep going if they withdraw the punch bowl?
Let’s see if Powell and The Gang can forecast the stock market if they taper the balance sheet and raise rates.





















You must be logged in to post a comment.