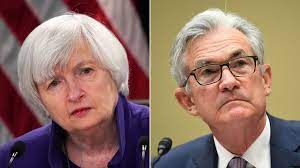
Federal Reserve Chair Jerome Powell sounded a note of heightened concern over persistently high inflation as he made clear that the central bank will begin tapering its bond purchases shortly but remain patient on raising interest rates.
“The risks are clearly now to longer and more persistent bottlenecks, and thus to higher inflation,” Powell said Friday during a virtual panel discussion hosted by the South African Reserve Bank and moderated by Bloomberg’s Francine Lacqua.
“I would say our policy is well-positioned to manage a range of plausible outcomes,” he said. “I do think it’s time to taper and I don’t think it’s time to raise rates.”
Good luck with that, Jay! You are going to raise the short-end of the yield that will lead to a flattening of the Treasury yield curve. But you are going to continue to buy Treasuries and Agency MBS in order to monetize the rampant spending by Congress and the Biden Administration? C’mon man!
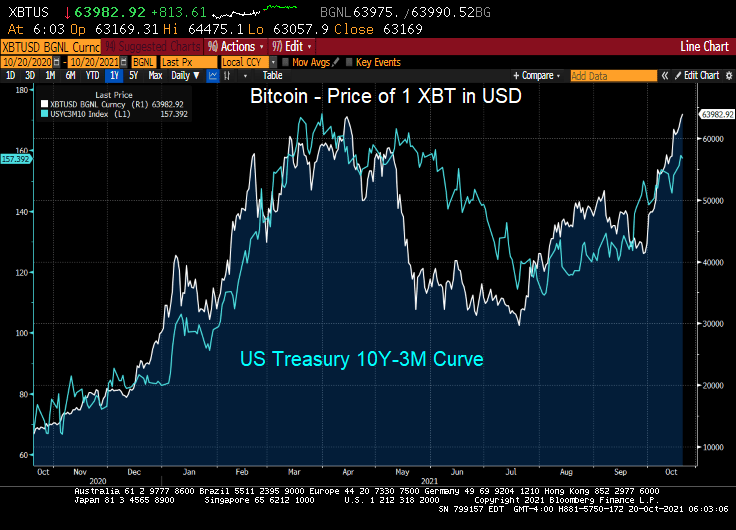
You can see where Powell spoke today. It is when gold tanked along with the 10-year Treasury yield. Both rebounded a bit, but the 10-year Treasury yield continue its fall to 1.6324%.
The US dollar (green) fell when Powell opened his pie-hole. But Bitcoin (blue) fell in advance as if they knew what Powell was going to say.
I remember my academic colleague at The Ohio State University (now at Notre Dame), Paul Schultz saying “Why do you find fixed-income and the yield curve interesting?” I have always found the yield curve to be interesting … at least until The Federal Reserve hammered down the short-end with it zero-interest rate policy (ZIRP) and tried manipulating the 10-year Treasury Note yield through Quantitative Easing (QE) meaning The Fed’s purchase of Treasuries and Agency Mortgage-backed Securities (MBS). No, I still think the manipulated yield curve is interesting.
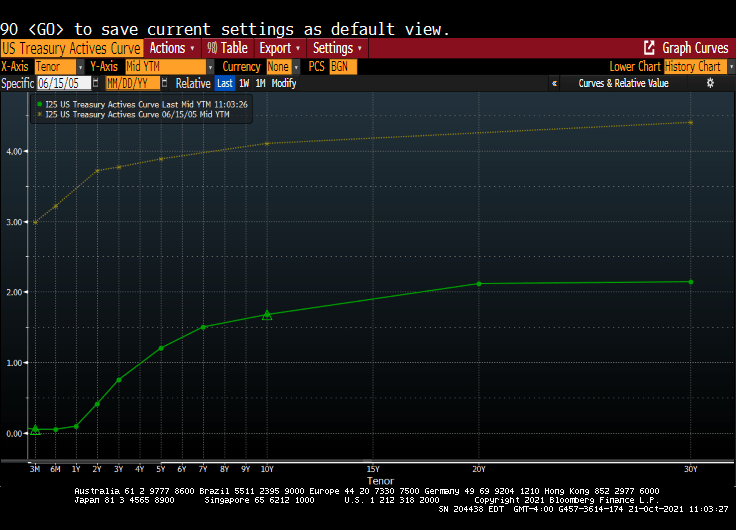
Here is today’s Treasury actives curve (green) versus the yield curve at the peak of the previous housing bubble in 2005 yellow). That is a 300 basis point shift as the short-end. And a 243 basis point shift for the 10-year Treasury Note.
(Bloomberg) — The yield curve is one of the most-powerful forces in the observable financial universe. While much of the price action that we see on a day-to-day basis may be driven by some sort of dark energy, the curve provides a highly visible lodestone indicating the state of policy settings and the likely trajectory of the economy. That being said, the curve is often misunderstood — a bear flattening often produces plenty of hand-wringing, when it’s the bull steepening that you should really worry about. In fact, referring to “the curve” itself is something of a misnomer — while different iterations of the yield curve often travel in tandem, sometimes their paths diverge. That has been the case recently, though perhaps not for much longer. The recent rise in two-year yields looks more than justified, as various fixed income models demonstrate in a roundabout way.
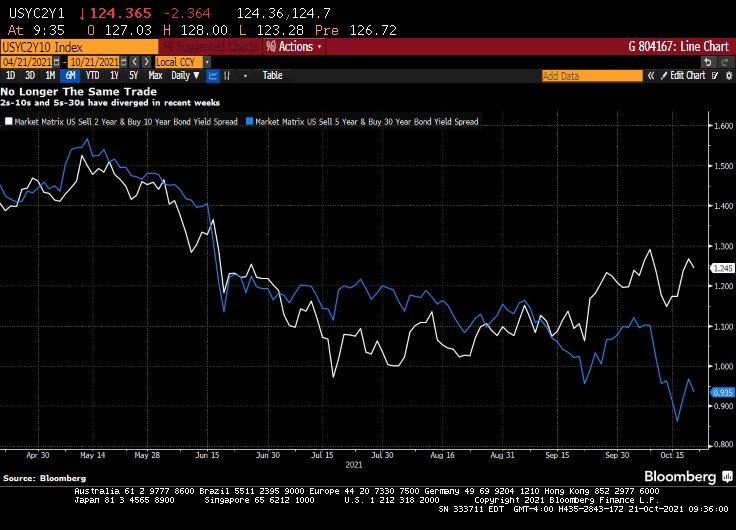
For the past year and a half or so, most of the focus on the yield curve in this column has been on the 5s-30s iteration. The rationale for this has been relatively straightforward: With the Fed funds rate locked in near zero for the foreseeable future, the two-year note has been moribund. As such, 2s-10s has really just been another articulation of the 10-year yield. And much like recent price action vis-a-vis my 10-year model, the curve briefly traded where it “ought” to in March before once again becoming too flat in recent months.
At least 5s-30s has had the benefit of containing a useful forward-looking component on both legs of the spread. Yet even as I type that, it is interesting to note that 2s-10s and 5s-30s exhibited virtually identical price action at virtually identical levels earlier this year. While they remain positively correlated, of course, a clear wedge has emerged between the two curves as five-year yields have broken decisively through 1%, pricing greater conviction that a monetary tightening cycle will fully emerge over the next half-decade.
Yet I am left to wonder about the two-year note. The eurodollar strip is pricing that the bulk of monetary tightening will come by the end of 2023, a period that’s now largely captured by the shortest-maturity coupon security. To be sure, the appropriate level for 2s is a function not only of the ultimate magnitude of monetary tightening, but when it begins. After all, a 150 bp hike in Q4 of 2023 carries very different implications for the current two-year note than a 25 bp rate rise every three months from Q3 of next year onwards.
It occurred to me that I could back out a model for two-year yields by simply subtracting the output of my yield curve model from that of the 10-year model. I had no real idea of what to expect from this exercise, but even with the proviso that short-end yields rarely stray too far from the policy rate, I was pleasantly surprised at how close the fit is from this “derivative” model for the two-year.
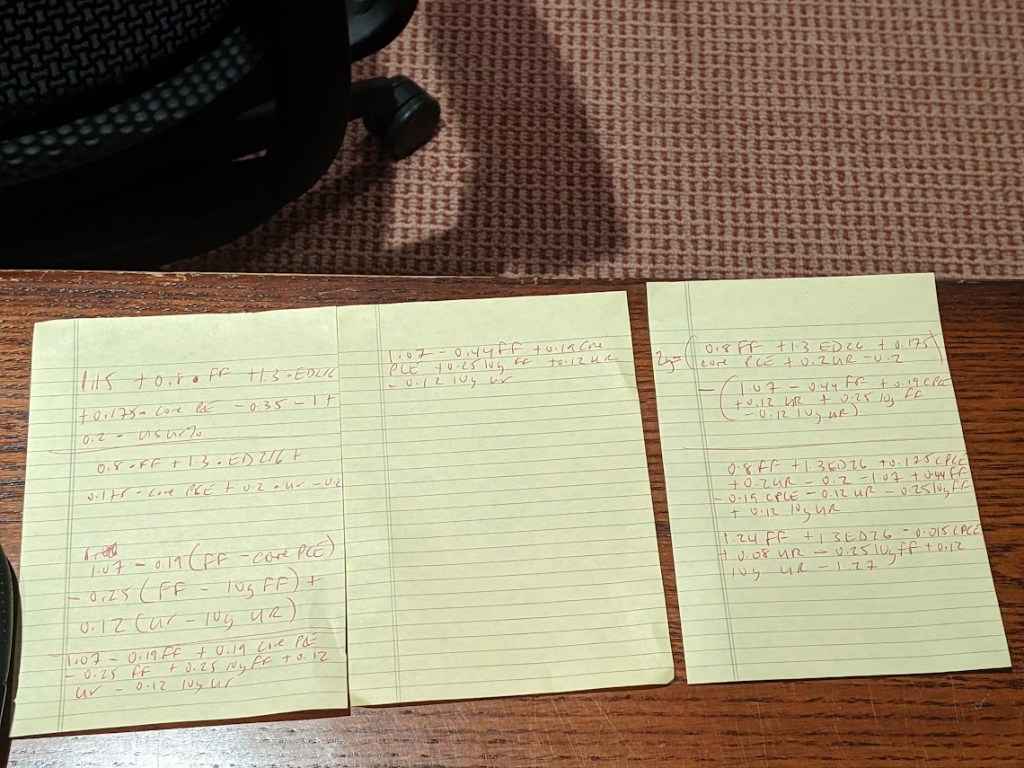
The question then arose, naturally, of what actually went into the calculation of this “model.” After all, knowing the formulae of the two constituent models — for the 10-year and the yield curve– should allow for the distillation of a separate equation for the two-year note. Because that sort of thing is more fun than unpacking more boxes, that’s how I spent a few minutes on Wednesday night. The outcome isn’t necessarily an optimal model for the two-year, but more of an accidental one.
A bit of high school algebra
For what it’s worth, the resultant formula is 2y = 1.24 * FDTR + 1.3 * (ED2 – ED6) -0.015 PCE CYOY + 0.08 * USURTOT – 0.25 * (10y average of FDTR) + 0.12 * (10y average of USURTOT) – 1.27. I am pretty sure that one could get similar results with a simpler framework; the notion that a 2% rise in core inflation is worth just 3 bps on the two-year yield, all else being equal, leaves me simultaneously amused and bemused.
What does seem evident, however, is that henceforth there is going to be considerably more signal generated from two-year yields than has been the case in recent quarters. As such, 2s-10s are going to be worth following again, just as much if not more than 5s-30s. Both nominal yields and the curves are clearly constrained by the notion that all of this inflation kerfuffle really is transitory at its heart, and that, with r* remaining in the gutter, the long-run lid on nominal policy rates is going to be extraordinarily low.
That’s probably as good a null hypothesis as any, and possibly better than most. That being said, if we’re still having a lot of the same inflation conversations a year from now, we’re gonna need a long hard think about whether some of the post-GFC lessons need to be unlearned. In the meantime, at least fixed income is interesting again. I wonder where the yield curve and the model will eventually meet up to shake hands again… -Cameron Crise
The yield curve will become more interesting if Powell and The Gang take their foot off the monetary accelerator pedal.
Yes, the super-heated housing market is showing signs of slowing down.
According to the Mortgage Bankers Association (MBA), mortgage purchase applications rose 1.87% from the previous week. However, purchase applications are down 10% from the same week last year.
Refinancing applications dropped -.48% from the previous week as the 30-year mortgage contract rate rose from 3.14% to 3.18%. Refi apps are up 6% from the same week last year.
As rates begin to rise, mortgage refi applications will decline.
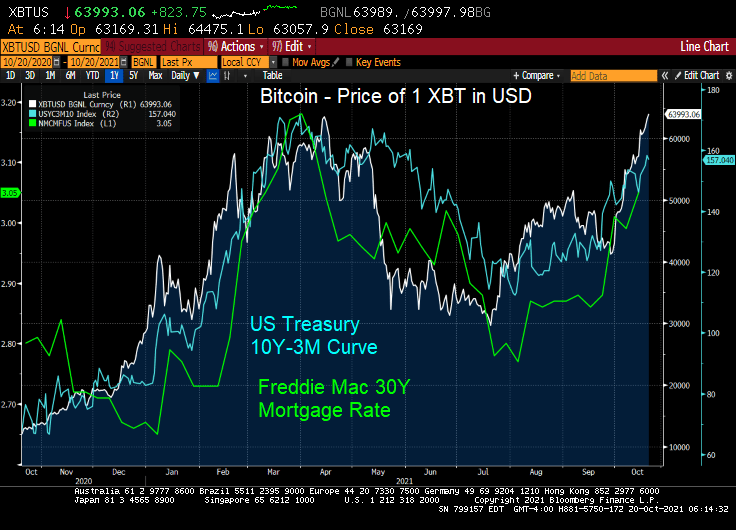
I have no idea why Jack Dorsey tweeted “705742.” But I do know that Bitcoin hit 63,982.92 this morning as the US 10Y-3M curve has been steepening.
Since the 3-month Treasury yield has been repressed to near zero, the 10Y-3M curve is pointing to rising 10-year yields. Which likely means that 30-year mortgage rates will be rising too.
UPDATE! Bitcoin hits 66,615 as Proshares Bitcoin Strategy E rises as well.
Has The Federal Reserve lost control of the economy? And inflation? The answer is likely yes. Why?
The Covid crisis has been played by the Federal government as an excuse for insane levels for spending coupled with massive monetary stimulus from The Federal Reserve.
As an example of The Fed losing control is US savings. The Fed’s model is to drive savers into consumption, therefore raising production and increasing GDP growth. But alas, The Fed can’t overcome the fear faced by consumers with Covid, Covid shutdowns, and rapidly rising prices.
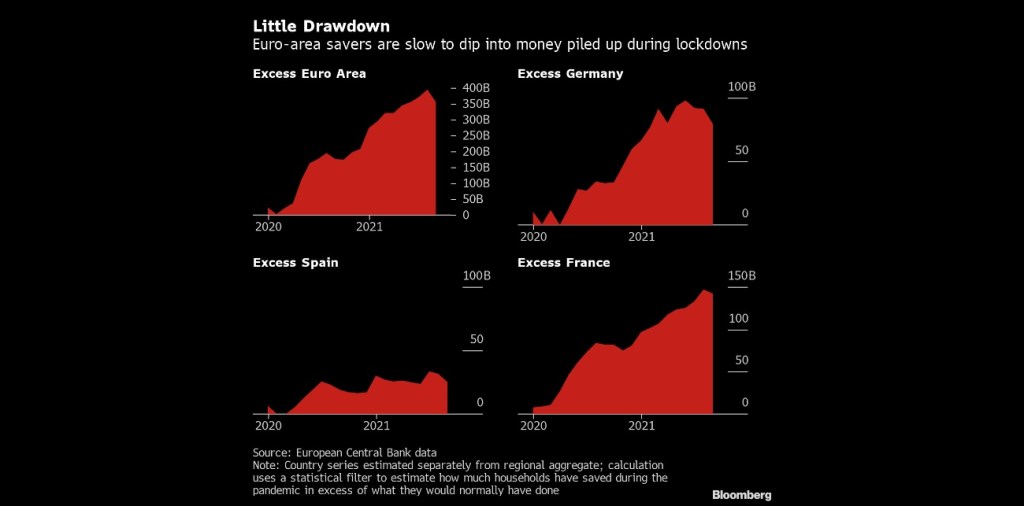
(Bloomberg) — Consumers in Europe and the U.S. aren’t rushing to spend more than $2.7 trillion in savings socked away during the pandemic, dashing hopes for a consumption-fueled boost to economic growth on both sides of the Atlantic.
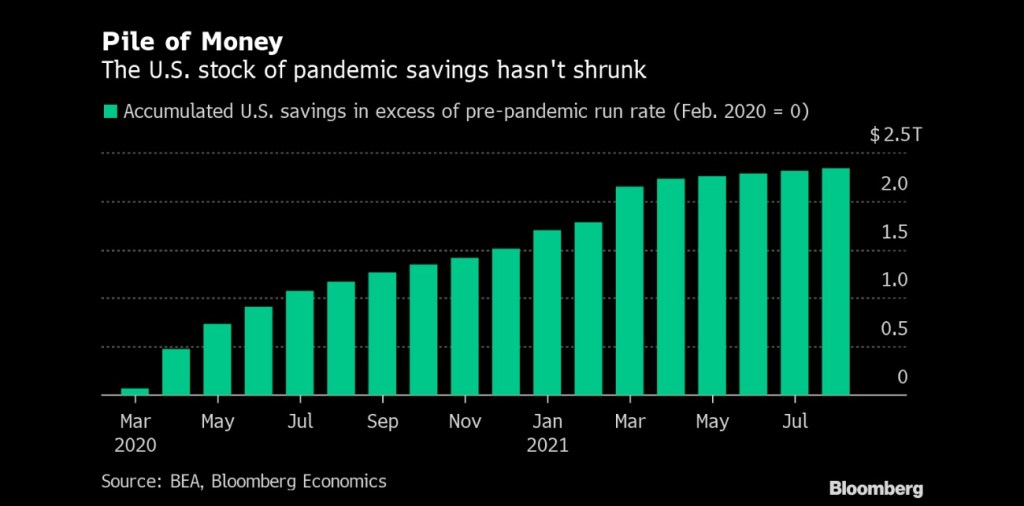
In the wake of lockdown easing during the northern hemisphere’s summer holiday season, excess savings in euro-area bank balances declined only marginally in August, and Italy still recorded an increase, according to calculations by Bloomberg Economics. In the U.S. there has also been no drawdown, the figures show.
The absence of a consumption surge that had been anticipated by some economists may speak against the prospect of a lasting inflation shock feared by central banks. While higher balances could help households cope with skyrocketing heating bills, tepid demand might temper businesses’ ability to push through permanent price increases.
In the USA, we see accumulated savings despite near-zero deposit rates at banks.
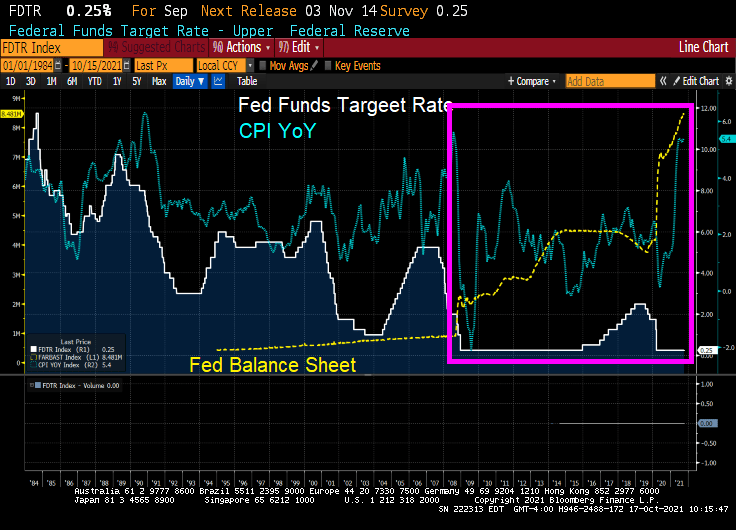
To be sure, The Fed reacted (or overreacted) to the Covid outbreak by increasing the money supply and their purchase of Treasuries and Agency MBS as the Federal government went on a wild spending spree.
But with trillions in Stimulypto Federal spending and Fed money printing, the bottlenecks in the economy (which apparently weren’t known before … ) have contributed to massive price increases that aren’t going away any time soon.
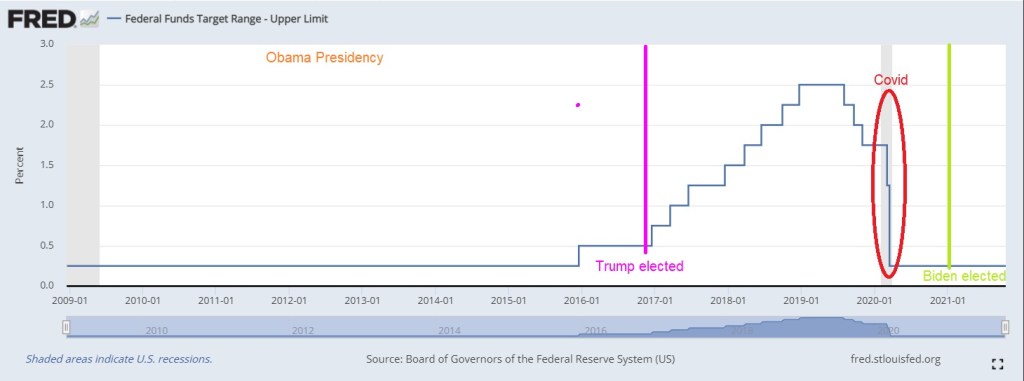
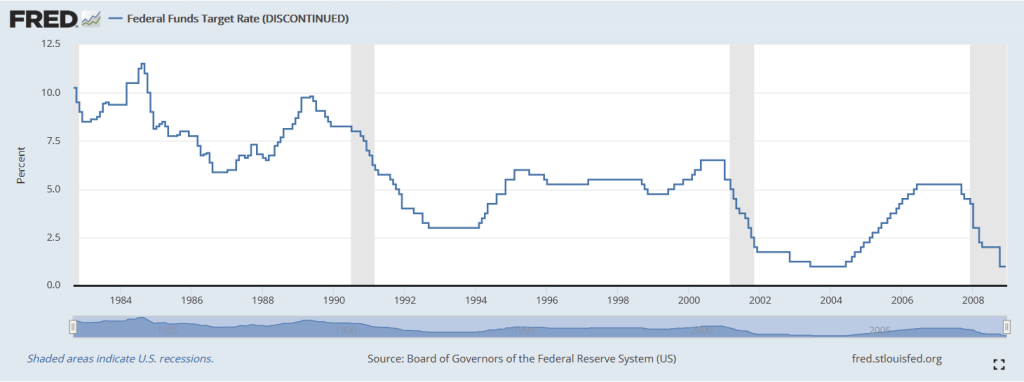
Notice how Fed monetary policies changed after the housing bubble burst and ensuring financial crisis/Great Recession. Before 2008, The Fed periodically whipsawed their Fed Funds target rate. But since late 2008, we have seen hardly any move from The Fed (except for 2017-2020 while Trump was President). For Obama,
Here is a look at The Fed’s record under Obama, Trump and Biden. The Fed raised their target rate only once under Obama until Trump was elected. Then The Fed raised rates 8 times. Then began lowering them again (5 times) leading to a big drop when Covid stuck. So for Trump, The Fed changed their target rate 13 times compared to 1 rate change under Obama and none under Biden.
And the above chart is only The Fed’s target rate. My point is that Yellen failing to raise rates under Obama has resulted in this over DC-Stimulypto we are seeing today.
Note the difference in Fed policies BEFORE the financial crisis. We need to return to a normal Fed policy rather than the hyper-inflationary zero-rate, QE policies since 2008.
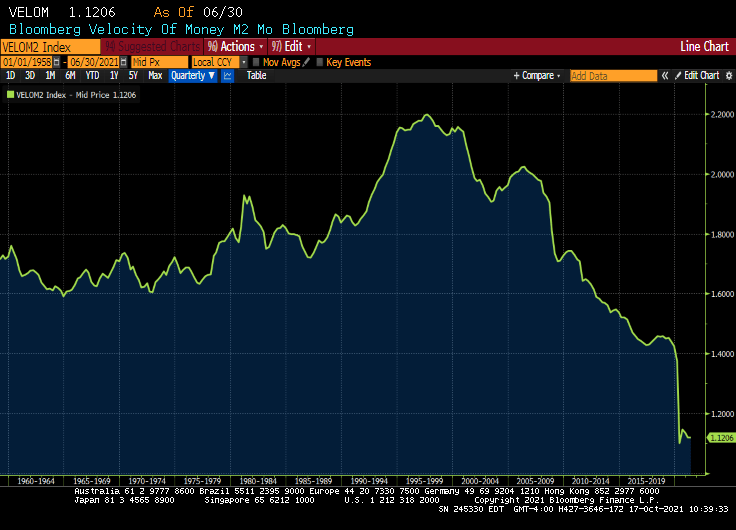
M2 Money velocity (GDP/M2 Money) remains near an all-time low.
But given DC’s spending spree and all-time lows for M2 Money Velocity, The Fed is going to need to keep purchasing trillions in debt at low interest rates. The abnormal Obama years (Bernanke/Yellen) are the NEW abnormal. Or should I say abby normal policies?
Dr. Frederick FrankensteinAre you saying that I put an abnormal brain into a seven and a half foot long, fifty-four inch wide GORILLA?
So, yes, Bernanke and Yellen put into place abnormal policies that Powell is following into the world’s largest economy (or gorilla).
Only Igor and The Federal Reserve would pick such abnormal policies that ultimately lead to massive misallocations and inflation.
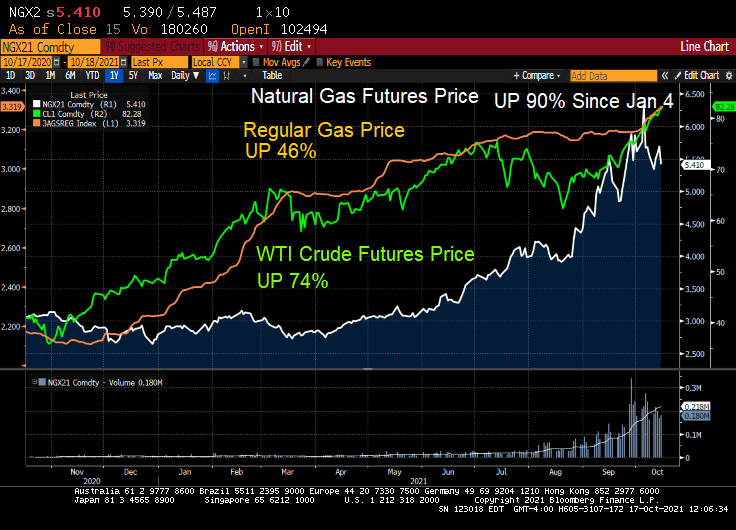
On a side note, do Biden and Transportation Secretary Pete Buttigieg really believe that they can fix the backed-up ports that are flooded with cargo thanks to Stimulypto? By Christmas??
Not with natural gas prices up 90% since January 4th!
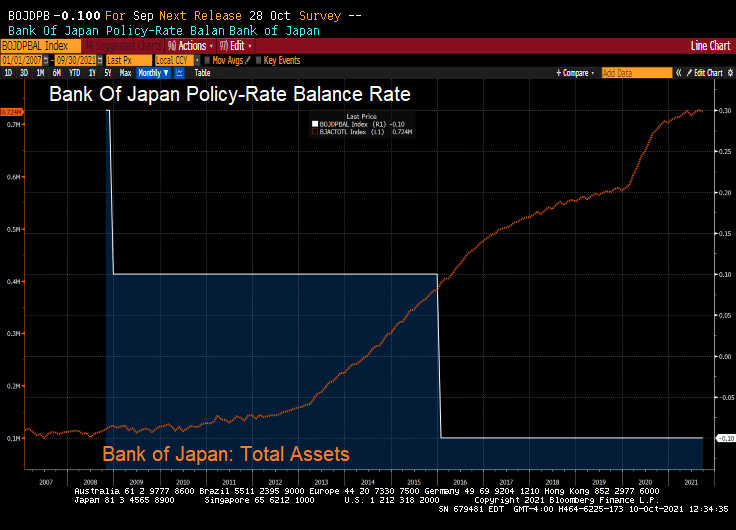
What’s left of it is that the BoJ (and Bank of Japan Governor Haruhiko Kuroda) now holds about half of the huge pile of the central government’s debt. With their target rate at -0.10% and a gargantuan balance sheet, what could go wrong?
But BOJ’s QE has ended. The BoJ’s overall assets stopped growing, and its holdings of government bonds have started to decline.
As of the BoJ’s balance sheet dated September 30, released on Thursday, total assets declined to a still monstrous ¥724 trillion ($6.4 trillion), below where it had been in May 2021.
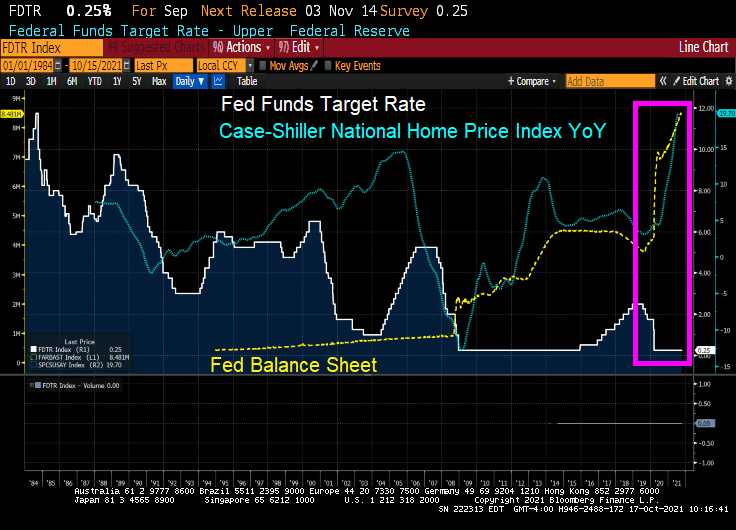
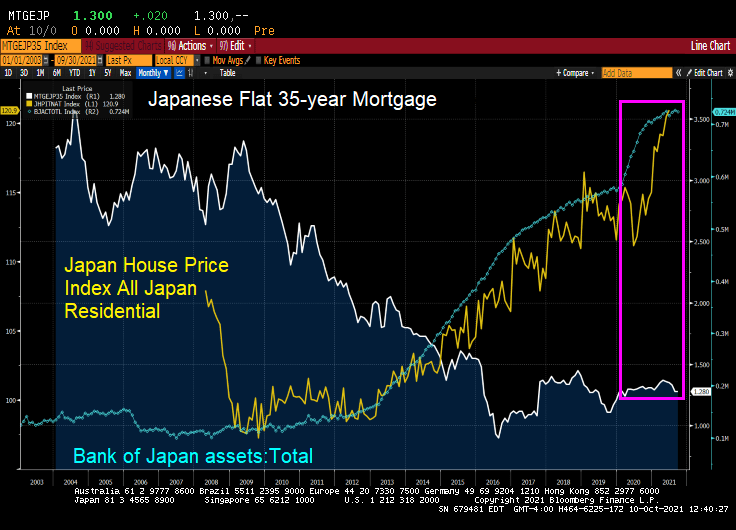
But look at Japanese home prices with the growth of the BOJ’s balance sheet and general decline in mortgage rates. Like the USA, there was a balance sheet spike associated with Covid and a resulting spike in home prices.
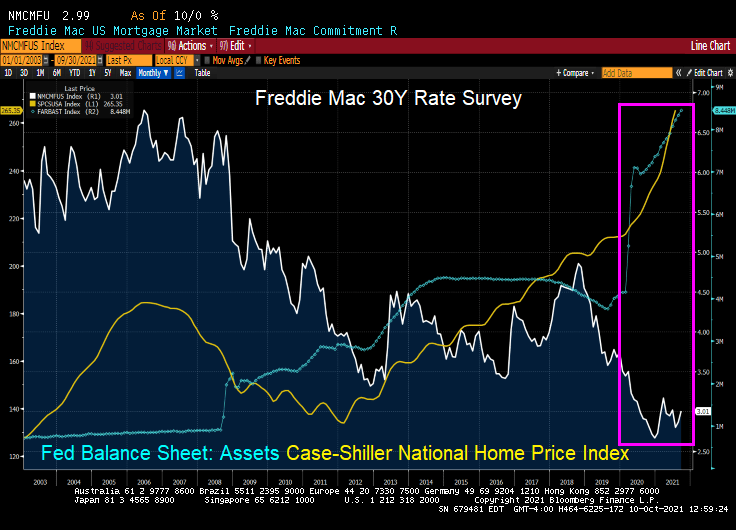
The USA? We also saw a surge in home prices following The Fed’s monetary “stimulypto.”
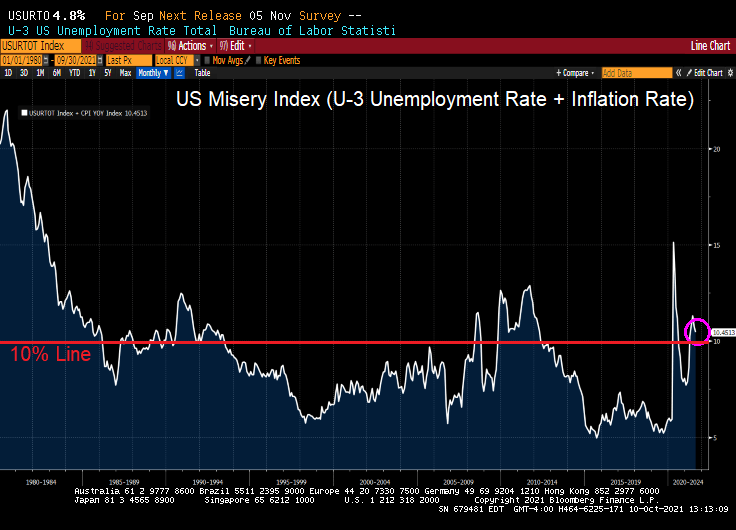
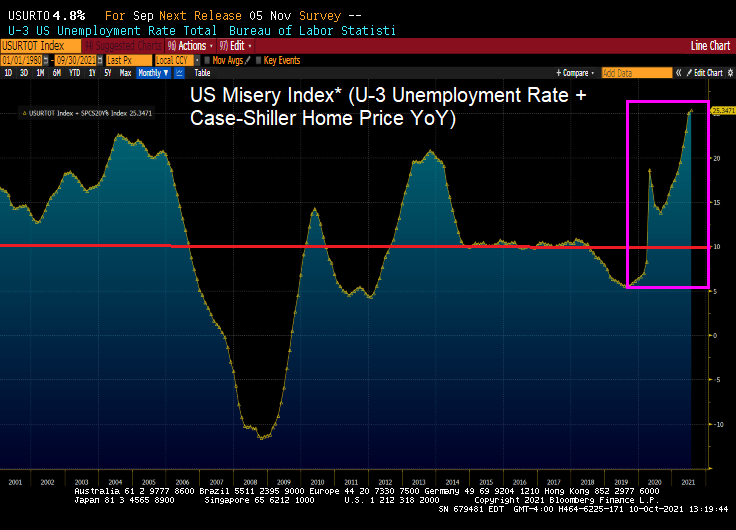
Bear in my that the US Misery Index is above 10% (U-3 unemployment + inflation).
And if I define the US Misery Index as U-3 unemployment + home price growth, we can see we are at record misery rates. Miserable for households that don’t own a home or are trying to move to a higher housing price area).
Well, Janet, we are headed there anyway with GDP crashing to a measly 1.33%.
The fear of not approving a debt ceiling increase (laughable since Democrats can do it on their own) has caused there to be a “little dipper” in the US Treasury actives curve. Meaning that the 1-month T-bill yield is higher than the 1-year T-bill yield.
Can you say “All the king’s horses and all the king’s men ..” Or “All The Fed’s stimulus and all of Biden’s jobs bills ..”
Yes, the Atlanta Fed’s GDPNow Q3 tracker slumped to 2.3% despite the massive stimulus coming from The Federal Reserve and the Biden Administration. Down from 13.7% GDP growth as of 5/5/2021.
A national mortgage lender has just introduced a 105 Loan-to-value (LTV) ratio loan and a lowering of FICO scores from 660 to 620.
Now, the loan still requires 97% LTV with downpayment assistance and gift funds permitted to boost CLTV to 105%.
With The Fed helping to raise home prices at a whopping 20% YoY, …
lenders are trying to find loan products for lower-income households so they can get in on the bubble! Hence, a 105% CLTV mortgage product with reduced credit requirements and increased Debt-to-income requirement rising from 43% to 45%. Also, borrowers can avoid the 3% downpayment requirement and put down only $500.
This is lending into the storm: softening of underwriting requirements as the house price bubble surges. Sound like 2005. This was not supposed to happen. After the housing bubble burst and the financial crisis, The Fed was supposed to encourage counter-cyclical lending (tighten credit standards as a housing bubble worsens). Instead, lenders are lowering credit standards, feeding the house price bubble.
If this was just one lender, I would have barely noticed. But this mortgage is being offered by most banks. And then sold to our GSEs: Fannie Mae and Freddie Mac.
Speaking of lending into a storm, as part of the raft of new legislation designed to spur first-time homeownership in America, a remarkable bill has joined the fray: its sponsors propose creating a new subsdizied 20-year-fixed-rate mortgage program through Ginnie Mae, HousingWire reports.
According to the bill, Ginnie Mae in tandem with the Department of the Treasury would subsidize the interest rate and origination fees associated with these 20-year mortgages, so that the monthly payment would be in line with a new 30-year FHA-insured mortgage. The move – which is an explicit subsidy of one share of the population by another – could, in theory, “allow qualified homebuyers to build equity-and wealth- at twice the rate of a conventional 30-year mortgage.” Instead, what it will do is lead to is an even bigger housing bubble.
Phil Hall of Benzinga wrote a series of excellent articles in four parts for MortgageOrb (although “The Orb” has removed his name). Here are the links to his stories.
After re-reading these excellent articles on the housing bubble and crash, I thought I would take the opportunity to present a few charts to highlight the housing bubble, pre-crash and post-crash.
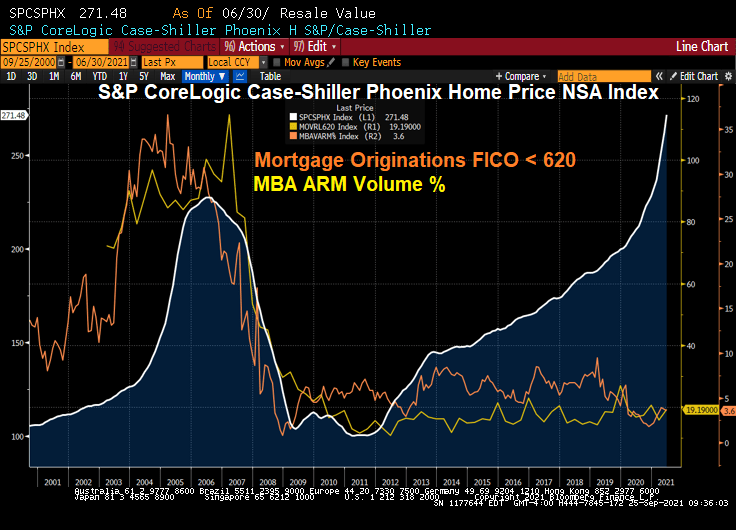
Here is a graph of Phoenix AZ home prices. Note the bubble that peaked in mid 2006. The Phoenix bubble correlates with the large volume of sub-620 FICO lending and Adjustable-rate mortgage (ARM) lending. Bear in mind, many of the ARMs prior to 2010 were NINJA (no income, no job) ARM loans.
What happened? Serious delinquenices at the national levels spiked as The Great Recession set in and unemployment spiked.
Since the housing bubble burst and surge in serious mortgage delinquencies, The Federal Reserve entered the economy with a vengeance. And have never left, and increased their drowning of markets with liquidity.
The Fed whip-sawing of interest rates in response to the 2001 recession was certainly a problem. They dropped The Fed Funds Target rate like a rock, then homebuilding went wild nationally and home prices soared thanks to Alt-A (NINJA) and ARM lending. But now The Fed is dominating markets like a gigantic T-Rex.
Oddly, then Fed Chair Ben Bernanke never saw the bubble coming. Or the burst.
Speaking of pizza, Donato’s from Columbus Ohio is my favorite. Founder’s Favorite is my favorite, but they do offer the dreaded Hawaiian pizza (ham, pineapple, almonds and … cinnamon?)


You must be logged in to post a comment.