There have been to significant jumps in the Federal Debt. The first coming after the financial crisis of 2008 and election of Obama/Biden in 2008. The second with the outbreak of Covid in 2020 and the election of Biden/Harris in 2021.
The Federal (public) debt was just over $10 million when Obama/Biden were elected and it now stands at a staggering $35.7 trillion. That represents over a tripling of the Federal debt under Obama/Biden/Harris. So when asked what she would do diffeerent than Biden, Harris replied “Nothing comes to mind.” That means MORE spending, MORE debt and MORE unproductive Government jobs.
Here is a chart of public debt and GDP under the triumvirate of Obama, Biden and Harris. No, not Julius Caesar, Pompey, and Crassus). But it is feeling like the Roman Empire prior to its collapse.
Here is a chart of government jobs and government expenditures. Great for government workers, bad for everyone else.
Of course, SOMEBODY has to pay the growing gov’t debt burden. Rest assured it won’t be Obama/Biden/Harris.
Biden/Harris will be remembered for many things, mostly BAD. Uncontrolled immigration, crime out of control, endless wars, grossly incompetent government administrators, 200k+ missing immigrant children, etc. But wreckless inflation coming from insane government spending takes the cake. And it is heating up again, with the help of The Feral Reserve. Yes, The FERAL Reserve.
Under Biden/Harris, prices are WAY up, real weekly earnings are WAY down.
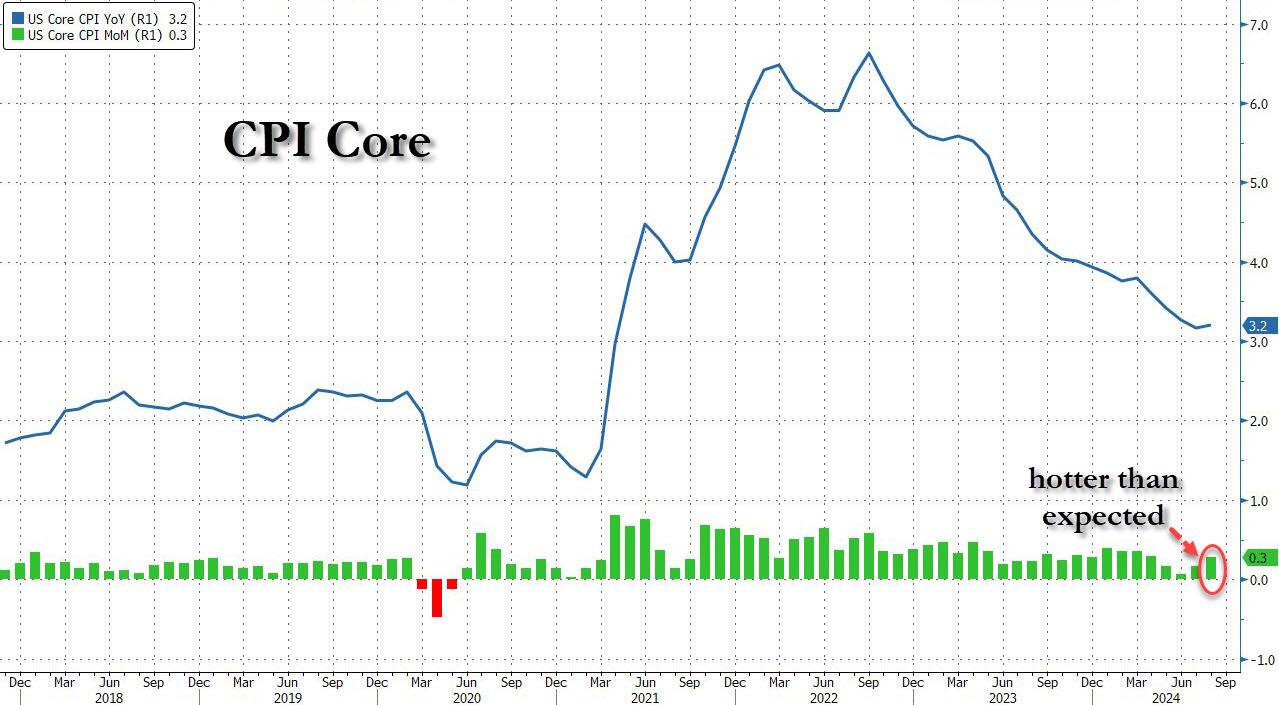
For the 52nd straight month, core consumer prices rose on a MoM basis in September (+0.3% MoM – hotter than the 0.2% expected) – the strongest since March. That left Core CPI YoY up 3.3%, hotter than the 3.2% expected…
Source: Bloomberg
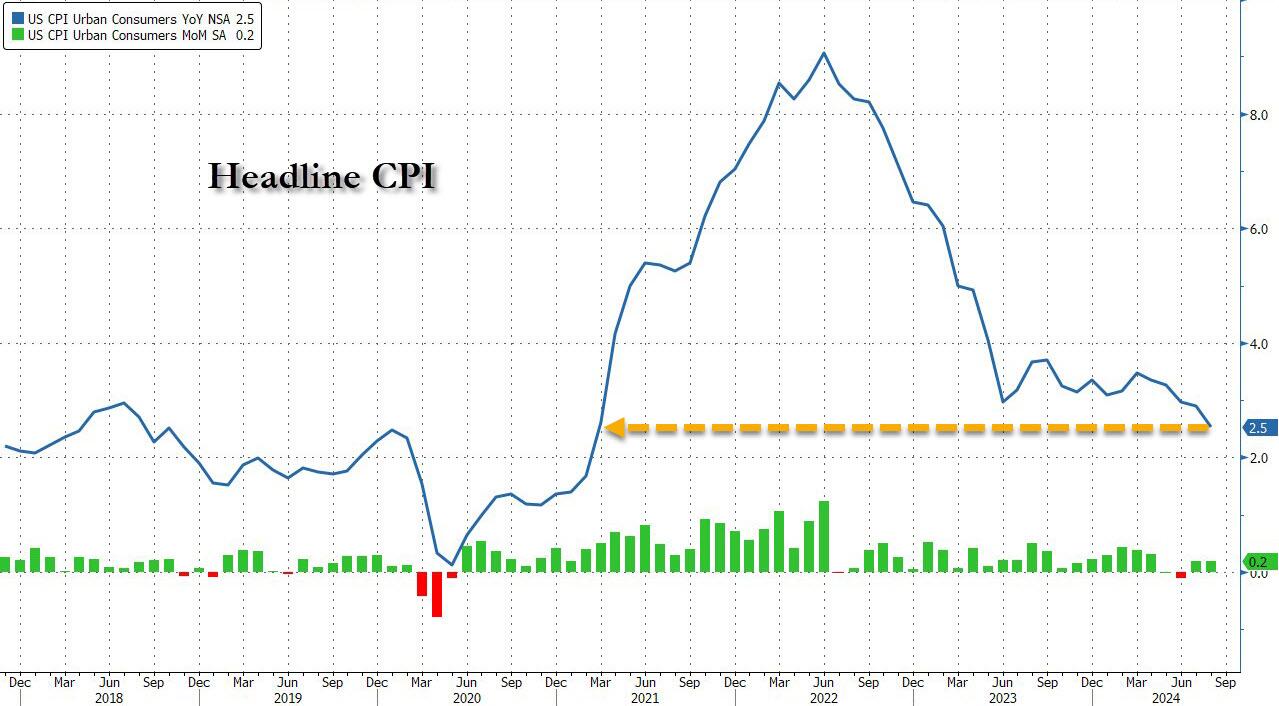
The headline CPI also printed hotter than expected (+0.2% MoM vs +0.1% MoM exp), with the YoY CPI up 2.4% (hotter than the 2.3% expected but lowest since Feb 2021)…
Source: Bloomberg
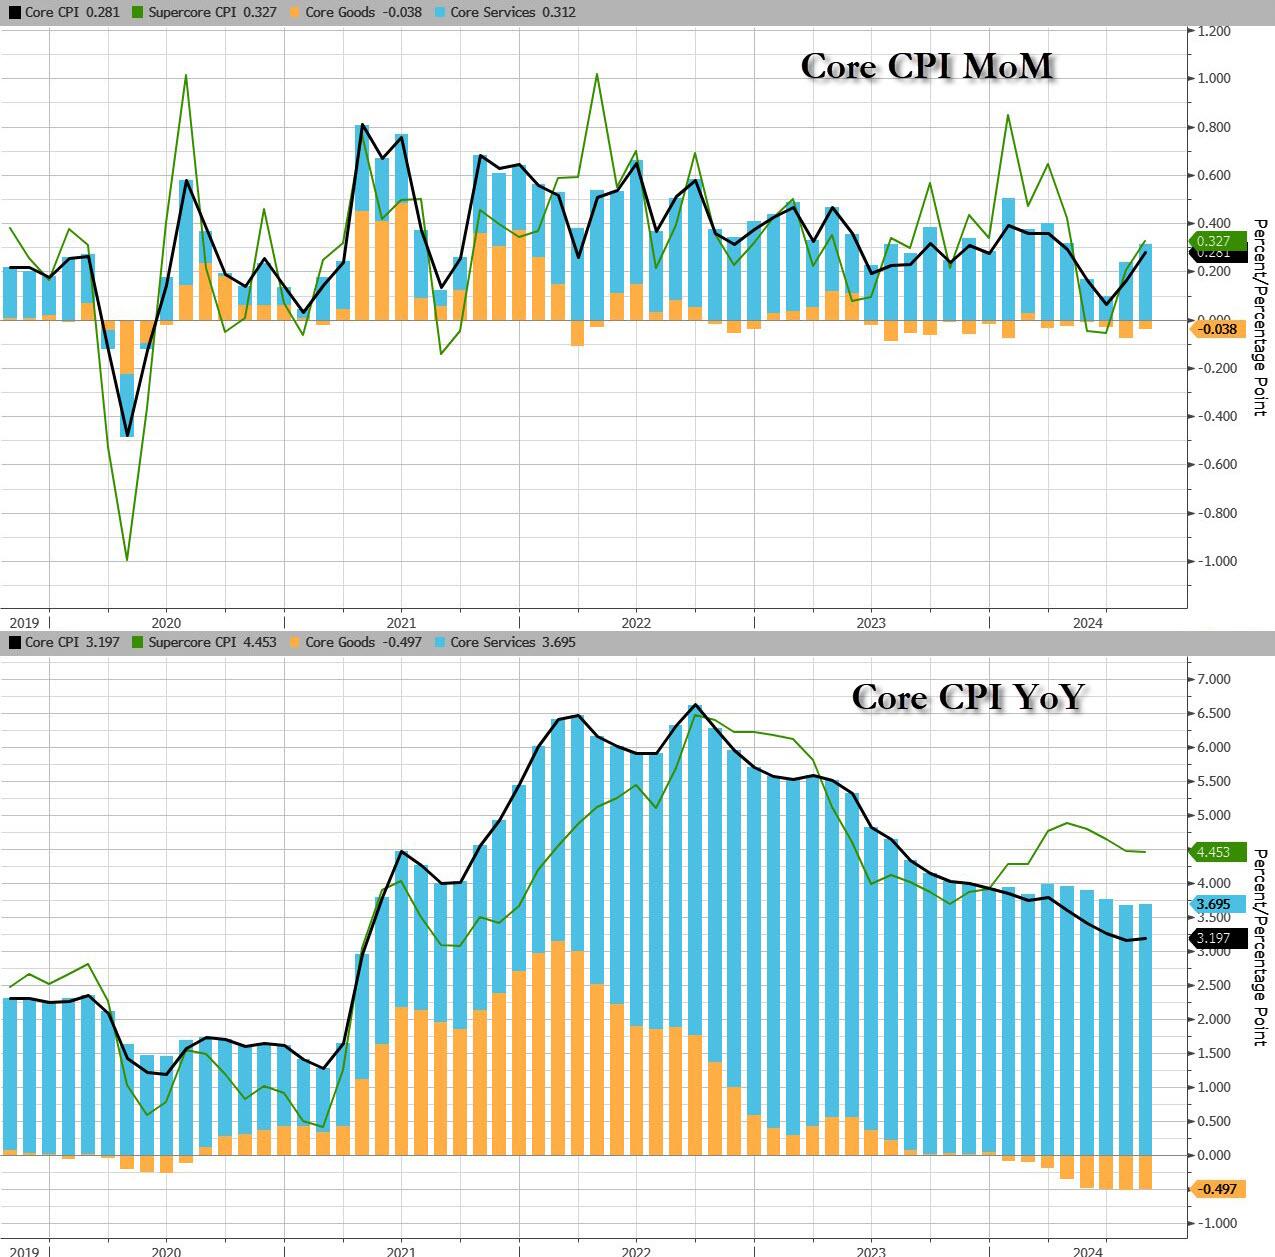
Core Services and Food costs surged in September…
Source: Bloomberg
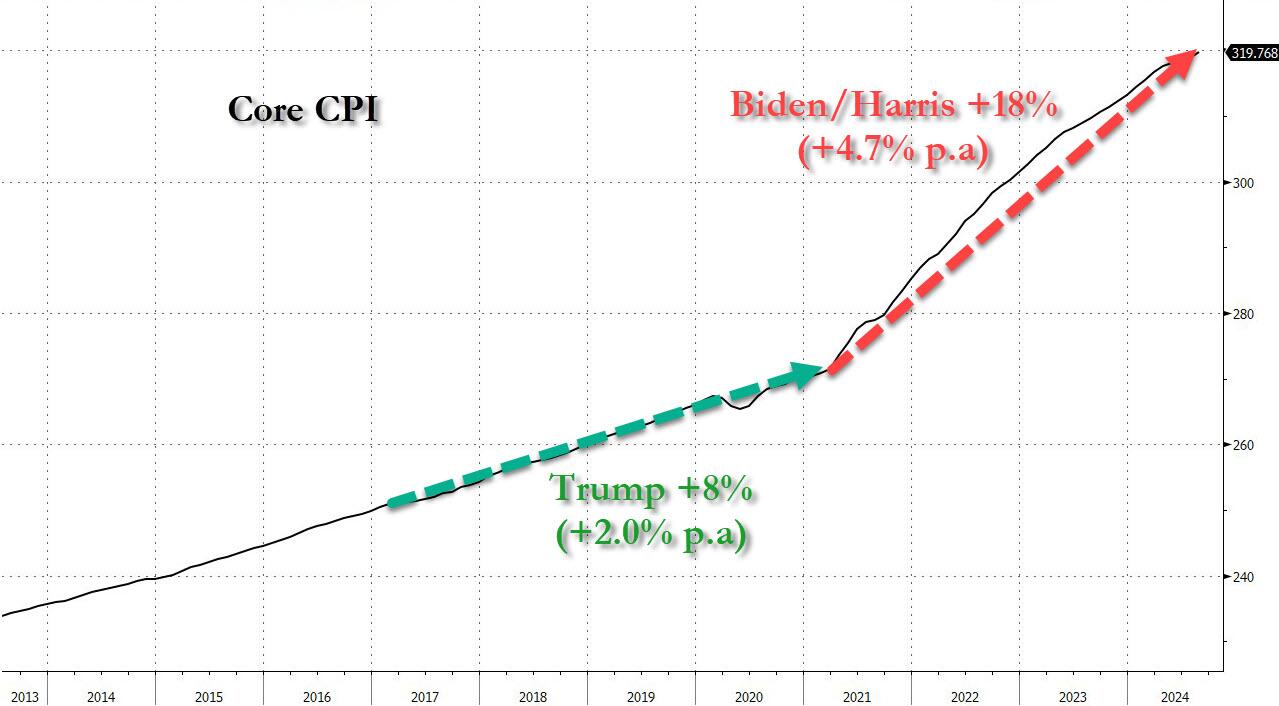
Overall, headline consumer prices are up over 20% (5.1% p.a.) since the Biden-Harris admin took over, which compares to around 8% (1.97% p.a) during Trump’s first term…
Source: Bloomberg
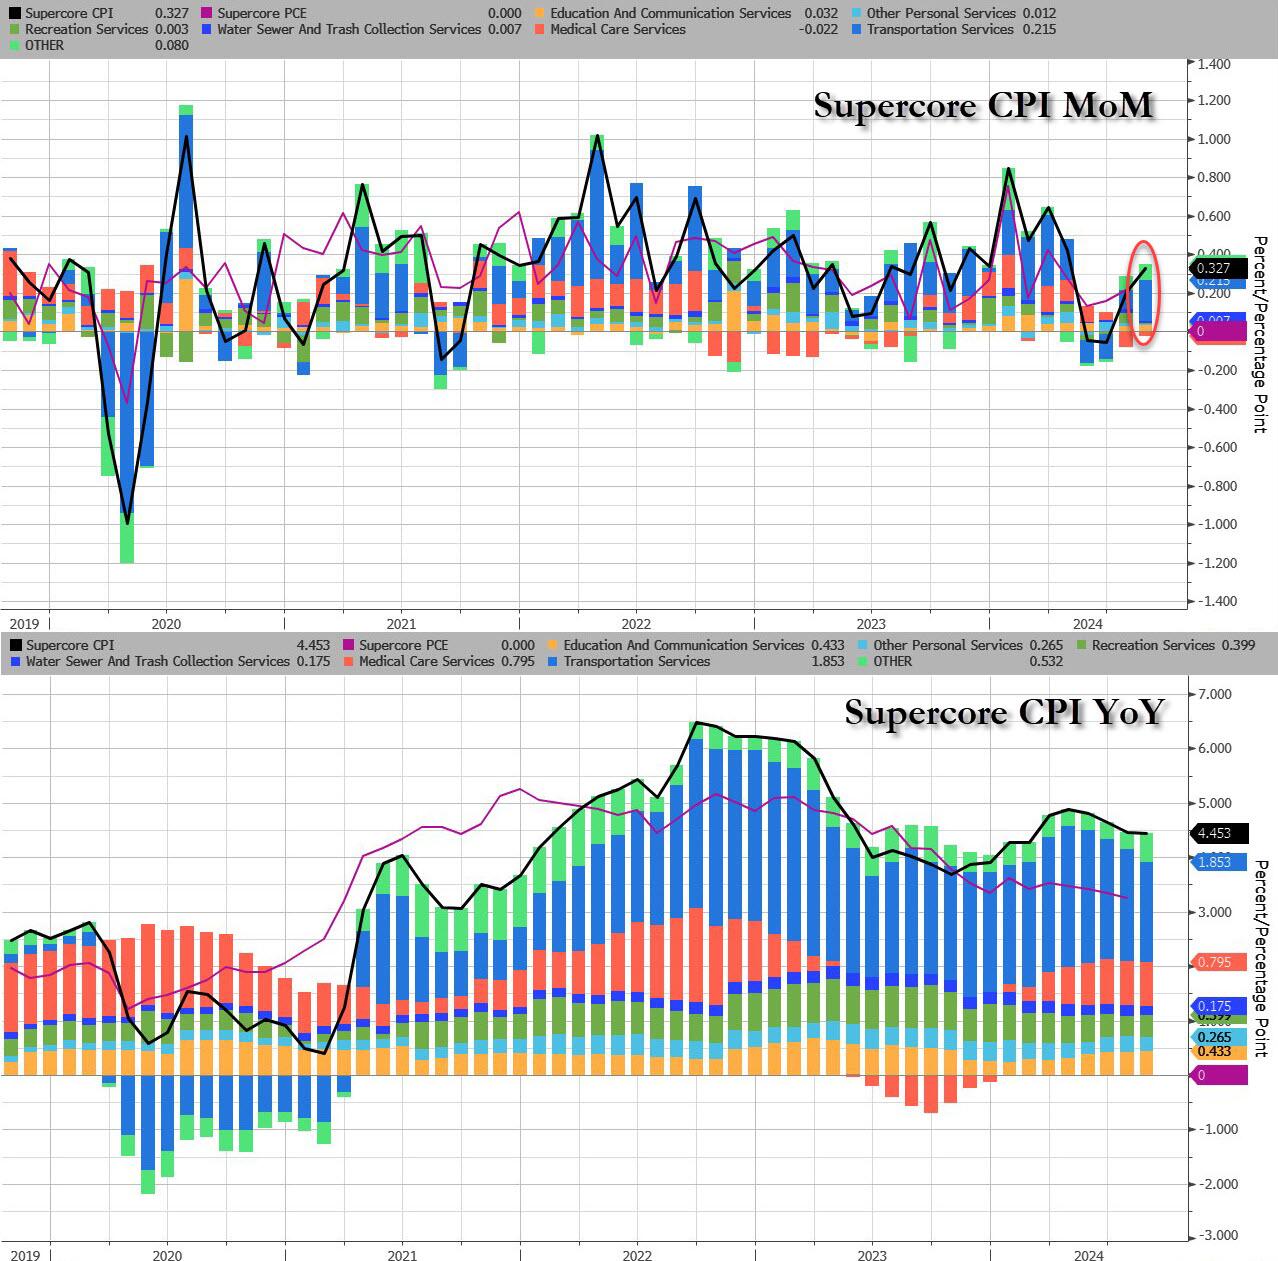
The so-called SuperCore CPI also increased on a YoY basis to +4.6%…
Source: Bloomberg
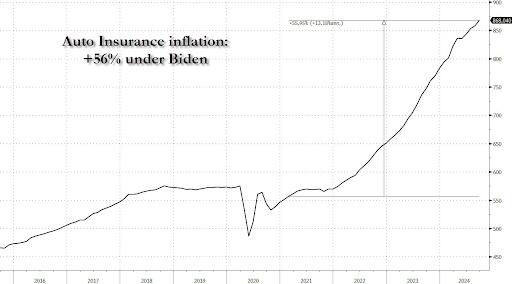
A surge in Transportation Services costs (record high auto insurance) and Medical Care Supplies lifted Super Core…
Source: Bloomberg
Why is the cost of auto insurance up 56% since Biden and Harris took over?
Source: Bloomberg
Real wages are down since the start of the Biden-Harris administration…
Source: Bloomberg
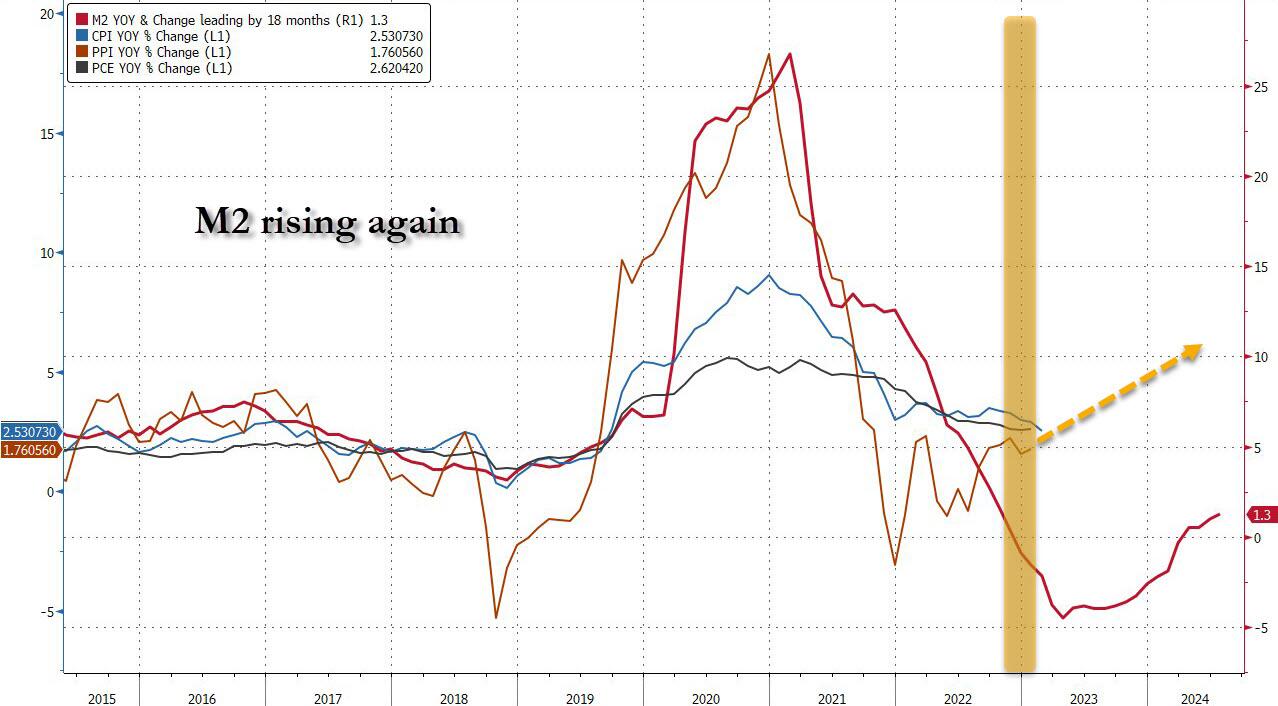
Finally, we note that money supply is resurgent once again, suggesting The Fed’s confidence in CPI’s decline may be misplaced…
Source: Bloomberg
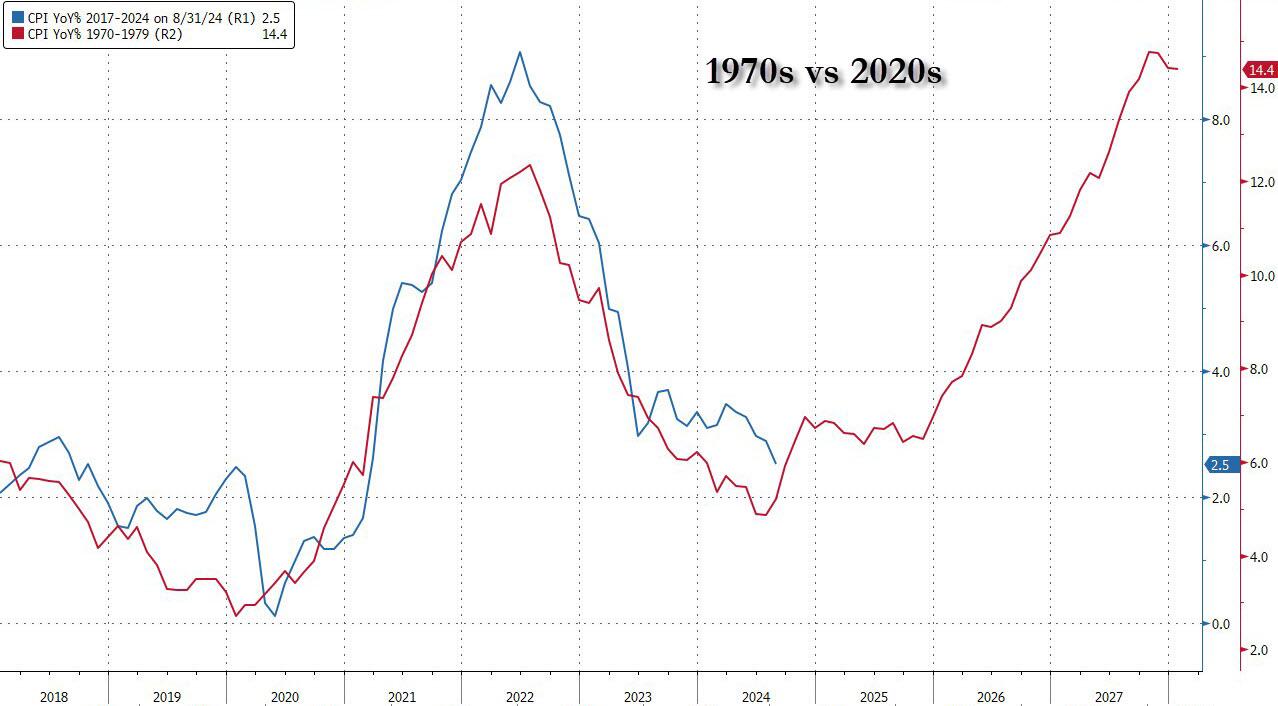
Could we really replay the ’70s once again?
Source: Bloomberg
Will that really be Powell’s legacy? Or will the timing of this resurgence in inflation be perfectly timed to coincide with Trump’s election victory… and offer a perfect patsy for who is to blame?
It turns out that Powell’s “emergency” 50bps rate cut was – drumroll – another major policy mistake by the Fed. Or it is Presidential election interference by The Biden/Harris Administration giving Cacklin’ Kamala as talking point?
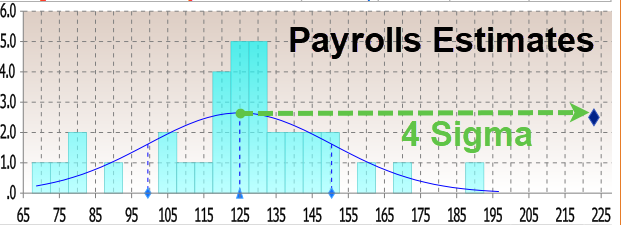
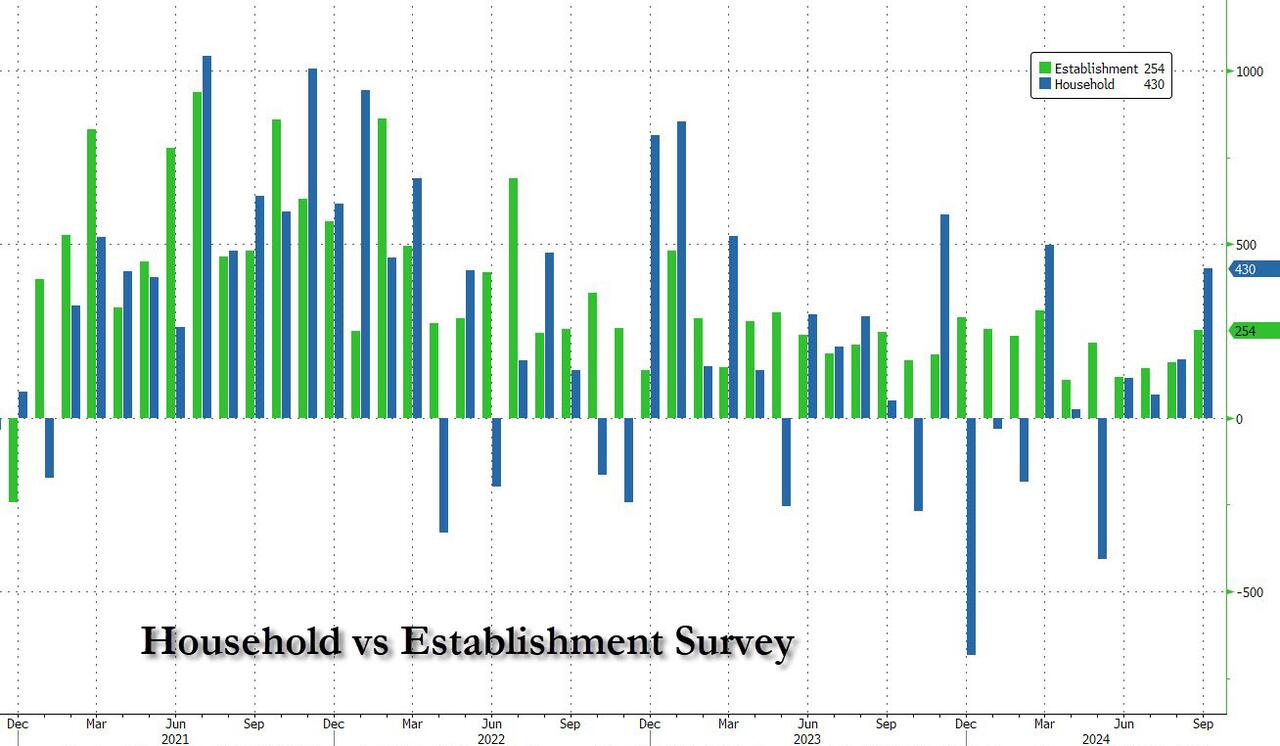
Moments ago, the BLS reported that at a time when prevailing consensus was for jobs to continue their recent downward slide sparked by the near-record annual jobs revision and several months of downbeat jobs reports, in September the US unexpectedly added a whopping 254K jobs, the biggest monthly increase since March…
There’s more: unlike previous months where we saw repeat downward job revisions, the BLS said that both prior months were revised up, to wit: the change in total nonfarm payroll employment for July was revised up by 55,000, from +89,000 to +144,000, and the change for August was revised up by 17,000, from +142,000 to +159,000. With these revisions, employment in July and August combined is 72,000 higher than previously reported.
Some context: as UBS notes, the moving six-month average on nonfarm payrolls is 167k. The estimate is that 150k is about consistent with a return of the economy to trend growth. Which means that inflation is about to come back with a vengeance, just as the Fed launches its easing cycle.
Remarkably, while payrolls jumped by the most in half a year, the number of employed people also surged, rising by a whopping 430K, also the biggest one-month jump since March.
It wasn’t just the payrolls, however, which came in far stronger than estimates: the unemployment rate also came in stronger than expected, and thanks to the jump in employed workers coupled with the decline in unemployed workers (from 7.115MM to 6.834MM), it dropped from 4.2% to 4.1% (and down from 4.3% two months ago which spared the entire recession panic).
Among the major worker groups, the unemployment rate for adult men (3.7 percent) decreased in September. The jobless rates for adult women (3.6 percent), teenagers (14.3 percent), Whites (3.6 percent), Blacks (5.7 percent), Asians (4.1 percent), and Hispanics (5.1 percent) showed little or no change over the month.
And here is the rub, because in a vacuum the super strong jobs numbers would have been fantastic, the only issue is that the September blowout comes as the Fed launches an easing cycle and as wages are once again rising as we have warned for the past 3 months. Indeed, in September, the average hourly earnings rose 0.4% sequentially, beating the estimate of 0.3%, while on an annual basis, wage growth was 4.0%, up from an upward revised 3.9% and beating the 3.8% estimate.
One note here: the average workweek for all employees edged down by 0.1 hour to 34.2 hours in September, which means the hourly earnings increase is not “pure” but rather a function of denominator adjustments. In manufacturing, the average workweek was unchanged at 40.0 hours, and overtime edged down by 0.1 hour to 2.9 hours. The average workweek for production and nonsupervisory employees on private nonfarm payrolls remained at 33.7 hours.
What sector had the biggest growth? UNPRODUCTIVE government workers! A record 785,000 government workers were added in September, pushing total govt workers also to a new record high.
The Biden/Harris Administration has given away billions of dollars to foreign nations (like Ukraine) and illegal immigrants so far this year,
– $24,400,000,000 to Ukraine.
– $11,300,000,000 to Israel.
– $1,950,000,000 to Ethiopia.
– $1,600,000,000 to Jordan.
– $1,400,000,000 to Egypt.
– $1,100,000,000 to Afghanistan.
– $1,100,000,000 to Somalia.
– $1,000,000,000 to Yemen.
– $987,000,000 to Congo.
– $896,000,000 to Syria.
– $9,000 per illegal immigrant that has entered the U.S.
And claim that FEMA has no money left for Hurricane Helene victims who have received only $750 per person. So I have plenty of reasons to have no trust or confidence in the Biden/Harris Mal-administration.
Whenever the 10Y-2Y Treasury yield curve slope goes negative, it is following by positive slope … then recession. Like clockwork.
Following every recession since the 1970s, the 10Y-2Y Treasury yield curve slope has risen, then declined. This time around, the 10Y-2Y Treasury curve has remained negatively-slope long than usual suggesting a larger than normal snapback. Into a hard landing.
Democrats in particular love hard landings because that green lights them for massive wasteful spending.
If this isn’t election interference, I don’t know what is.
The Fed today slashed interest rates by the biggest amount in 16 YEARS, a whopping 50 basis points from 5.50% to 5.00%. With the economy roaring along (thanks to Covid-related massive Federal spending), there was no good reason to slash rates. Other than to get Kamala (Hyena) Harris across the finish line.
The Fed’s bloated balance sheet remains bloast at 7.115 TRILLION.
Following last month’s modest miss in CPI which sparked speculation about a 50bps cut, which was then boosted by the jobs report miss and the huge downward revision, moments ago the BLS reported that – as only a handful of Wall Street strategists warned – CPI actually came in hotter than expected at the core level, rising 0.3% MoM vs expectations of a 0.2% print, with all remaining metrics coming in line, to wit:
CPI 0.2% MoM (or 0.187% unrounded), Exp. 0.2% – in line
And visually, here is the headline print, where the annual CPI increase dropped to just 2.5% from 2.9%, the lowest since February 2021…
.. and the core….
…. as goods deflation is stalling and may even print positive in the coming months, while core service inflation remains the biggest driver.
That was s the 51st straight month of MoM increases in Core CPI, and a new record high.
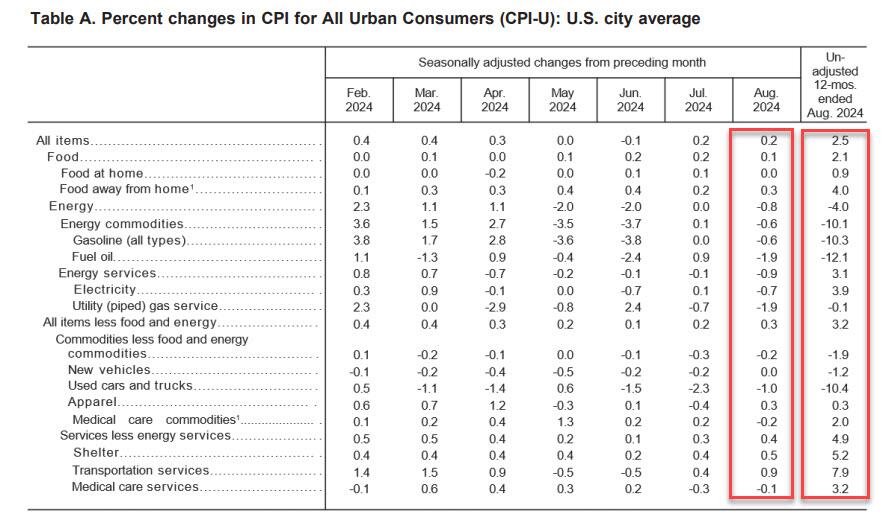
Under the hood, used car prices fell 1.0%, moderating from last month’s 2.3% drop, while airline fares jumped 3.9%, a big reversal to last month’s bizarre -1.2% drop. Car insurance costs jumped another 0.6%, after rising 1.2%; furniture prices dropped 0.3% reversing last month’s 0.3% rise.
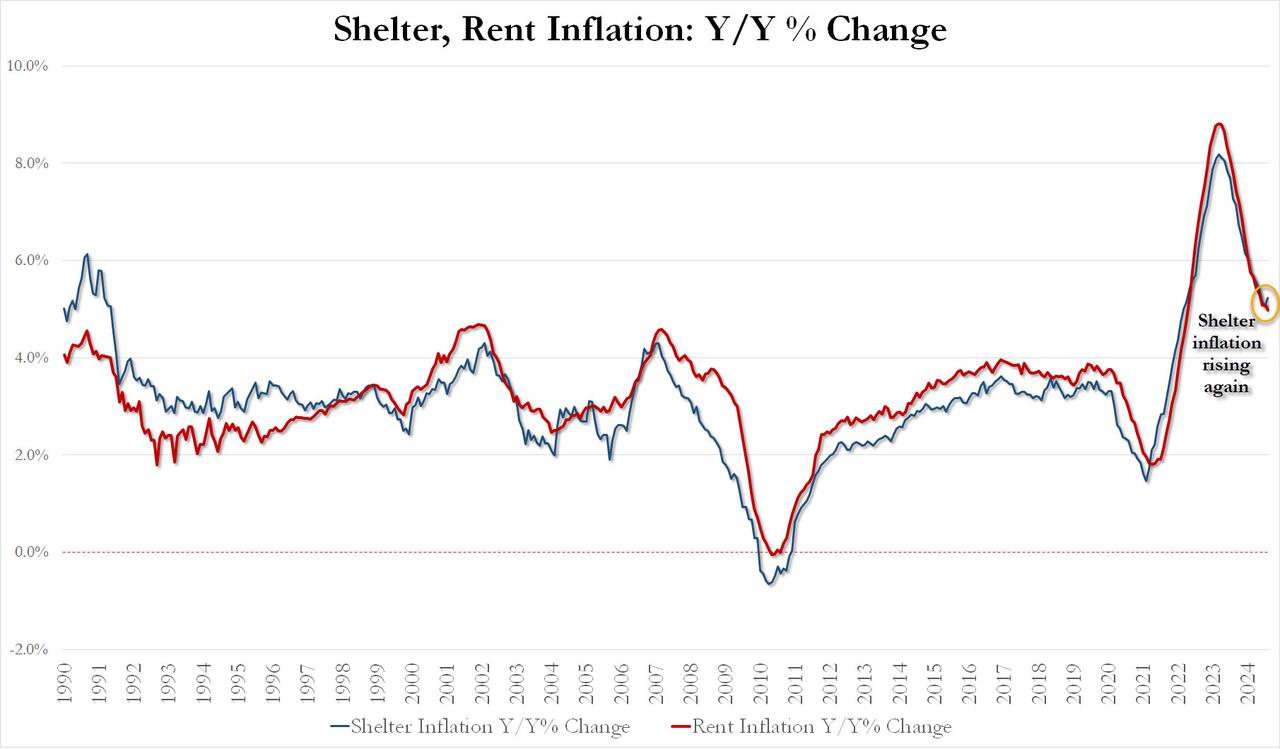
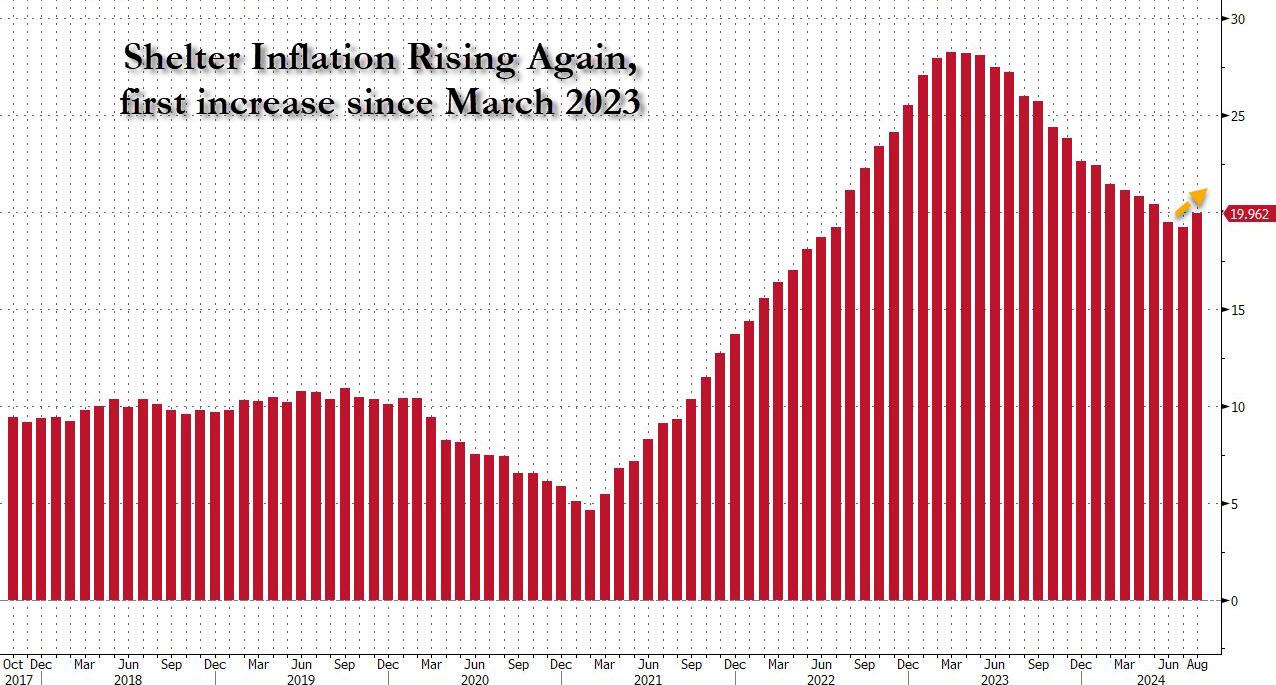
Perhaps more worrying is the fact that while rent inflation has flatlined, shelter inflation posted its first increase since early 2023!
August Shelter inflation up 0.43% MoM and up 5.23% YoY vs 5.05% in July
August Rent Inflation up 0.39% MoM and up 4.97% YoY vs 5.09% in July
And the first monthly increase since March 2023 highlighted:
Last, but not least, and perhaps most ominous of all, is that while inflation refuses to be “killed” even as the Fed is about to start cutting rates, Supercore CPI rose 0.33% MoM, the biggest monthly increase since April, driven by continued acceleration in transportation services, which jumped the most in 5 months.
Finally, money supply growth is reaccelerating…
Which begs the question: how long until the Fed’s next easing cycle unleashes the Arthur Burns fed:
Putting it all together:
Underlying inflation unexpectedly picked up, as core CPI increased 0.3% from July, the most in four months, and 3.2% from a year ago
Only five of the 65 forecasts in Bloomberg’s survey called for a 0.3% increase in the core CPI. Almost everyone else was at 0.2%, and four had it at 0.1%. The five were right.
Shelter prices, the largest category within services, climbed 0.5%, the most since the start of the year and the second month of acceleration, defying widespread expectations for a downshift. Owners’ equivalent rent — a subset of shelter and the biggest individual component of the CPI — rose at a similar pace.
Airfares rose a hefty 3.9% in August after falling for the previous five months while costs for energy and used vehicles fell
Risk assets pumped and dumped and bond yields rose. S&P 500 futures dropped steeply immediately after the report came out, before paring losses. The yield on 10-year Treasuries advanced two basis points to 3.66%. The dollar wavered.
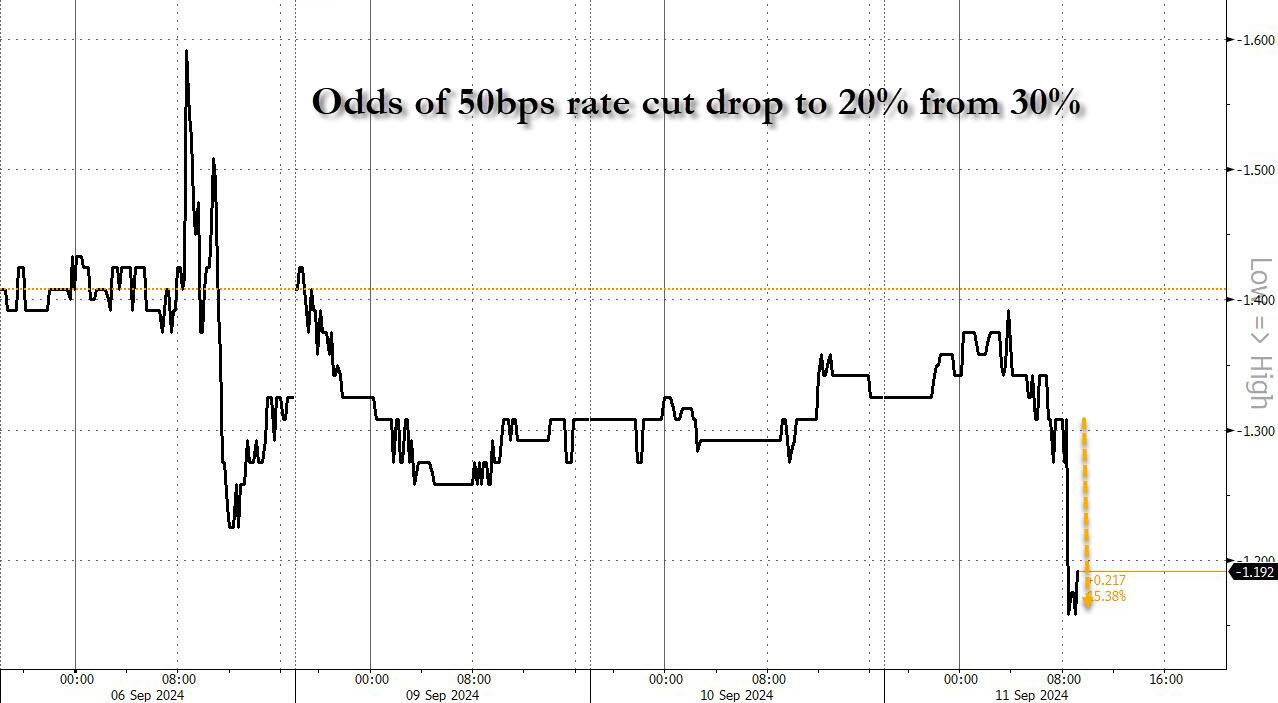
And while one can stick a fork in the market’s hopes for a 50bps rate cut (odds slumped from 30% to 20%… and from 50% last Friday)…
… the question remains: will the Fed really cut rates as shelter inflation inflects higher for the first time since 2023.
After last night’s ABC Presidential debate. Where Kamala acted like she was auditioning for part in the movie “Mean Girls” and the ABS moderators acted like pure Soviet-era Russian journalists.
The US government now pays out on average $3bn in interest expenses per day…If the Fed cuts interest rates by 1%-point and the entire yield curve declines by 1%-point, then daily interest expenses will decline from $3bn per day to $2.5bn per day.
Even worse, unfunded Federal liabilities total $219 trillion while total US assets total only $213 trillion. In other words, if China (for example) forced us to pay off our unfunded liabilities like Social Security, Medicare, etc., we couldn’t.
Notice how NO politician ever discusses The Federal goverment spending LESS money. Particularly not Joe “The fool on the hill” Biden or Kamala “Word salad Kammie” Harris.
The Biden/Harris illiusionomics was built on false hoods.
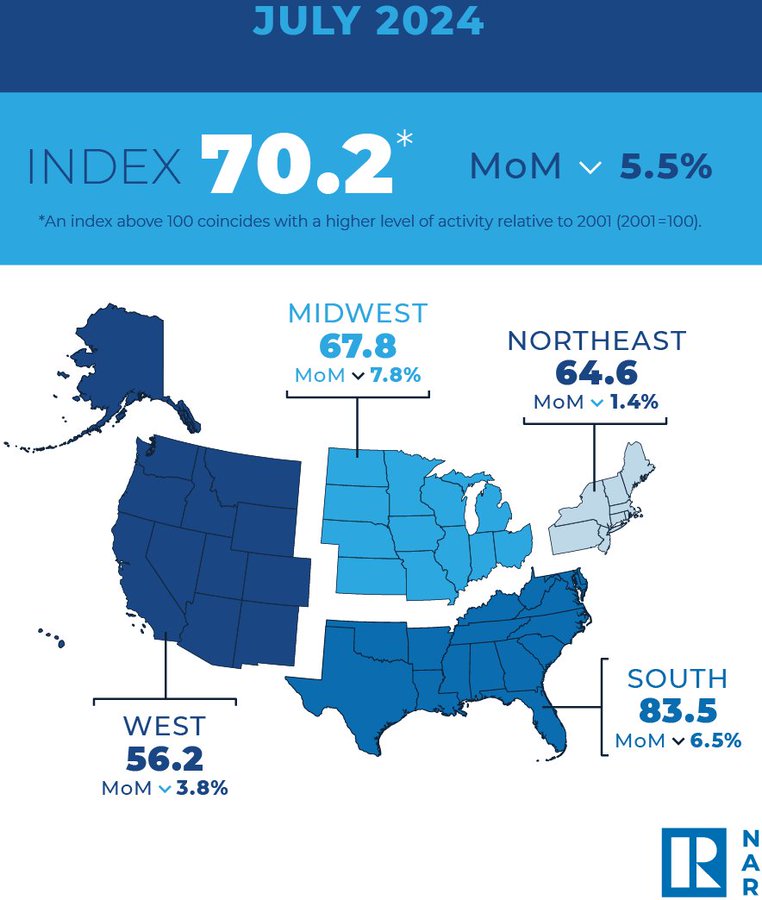
Look at pending home sales, now the LOWEST in history. The midwest led the decline in PHS at -7.8%.
Why? One reason is the illusion of a growing economy … that wasn’t growing organically. It was just Biden/Harris doling out trillions in handouts. Trillions of dollars in annual “consumer spending” is actually just government handouts being spent by people – it’s increased every month this year:
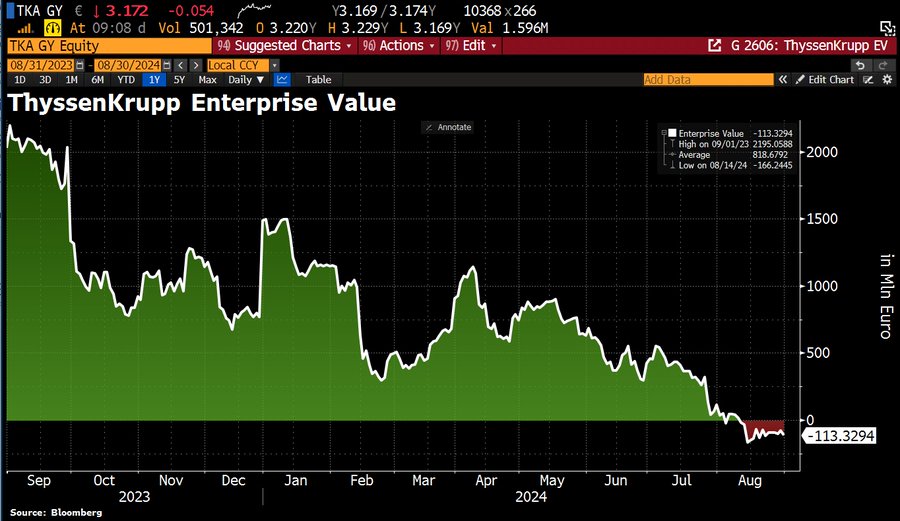
I read “The Arms of Krupp” by William Manchester. A great book about the rise of ThyssenKrupp during World War II. It is one of the world’s largest steel producers, but it now has NEGATIVE ENTERPRISE VALUE.
The cause? Germany is up the creek without an economic paddle after years of gross mismanagement by Angela Merkel and her party. Mass immigration in Germany and a slowdown in the global economy aren’t helping.


You must be logged in to post a comment.