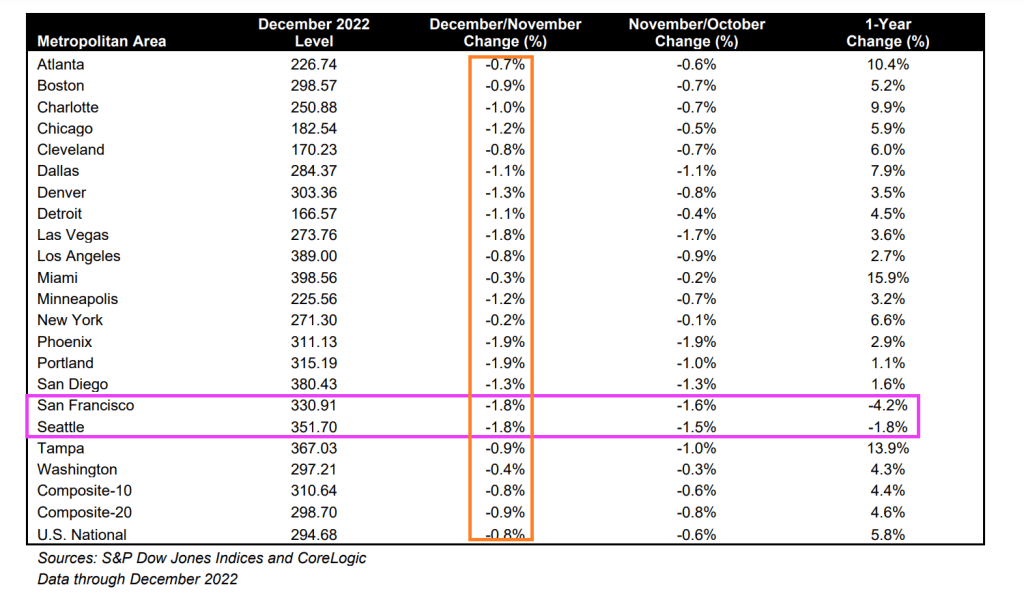
Only Seattle and San Francisco experienced negative growth in home prices on a year-over-year basis. All of the top twenty metro areas experience negative month-over-month price declines from November to December.
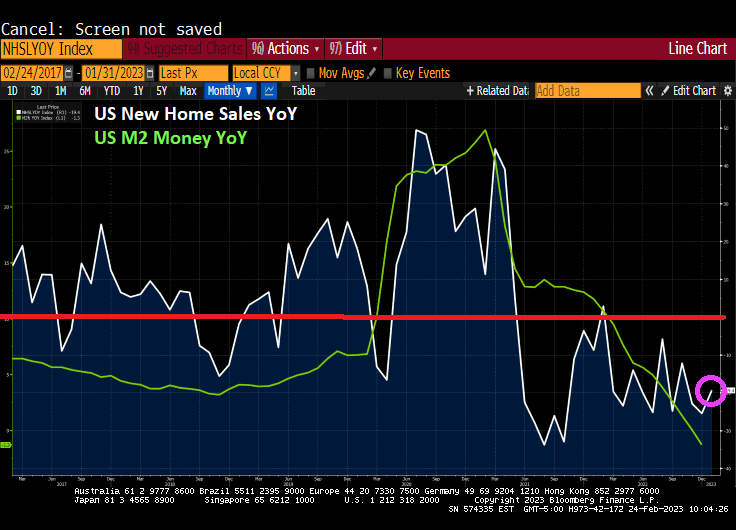
Another sign of a not healthy economy is housing. New Home Sales collapsed -19.4% from January 2022 (aka, year-over-year or YoY).
If I were Joe Biden, I would be touting the month-over-month numbers, up 7.20% from December to January. But the reality is that year-over-year new home sales are down -19.4%.
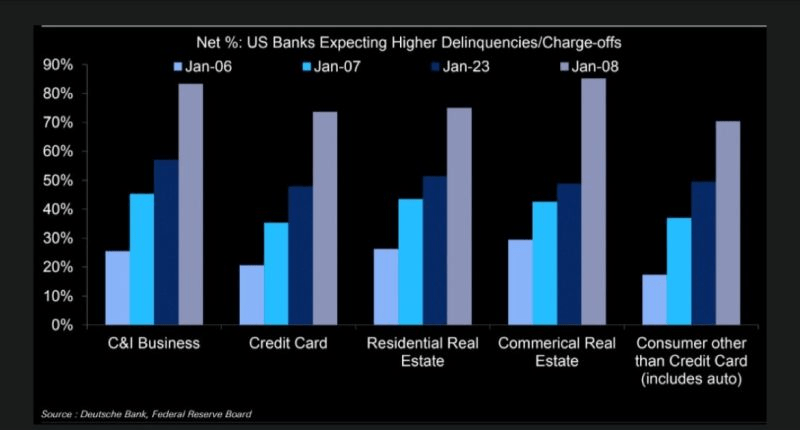
Also, on the “Alarm!” front, US banks are expecting higher delinquencies, including on residential mortgages.
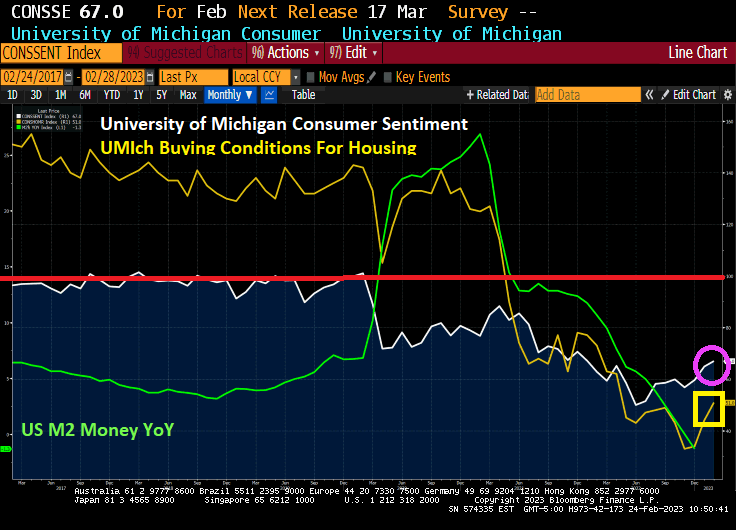
University of Michgan consumer sentiment for housing is rising, but still woefully below the 100 benchmark.
Not really a surprise, but January’s personal spending numbers came in hot at 1.8% MoM. Also, Personal Consumption Expenditures PRICE index (aka, inflation) rose to 5.4% YoY.
Here comes The Fed! The 2-year Treasury yield rose 10 basis points this morning.
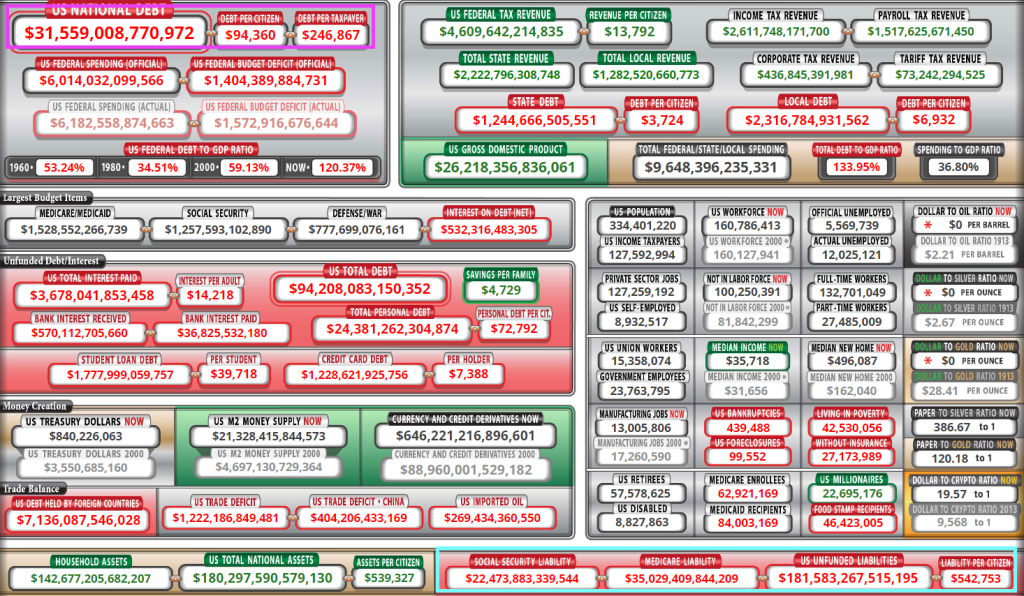
The US Federal government reminds me of the Peggy Lee song “Is That All There Is?” Since the outbreak of Covid in 2020 and the absurb spending spree by Pelosi and Schumer, the Federal government has increased their debt by 36% to help pay for the Federal spending spree. That amounts to $54.8 TRILLION in additional Federal debt since January 2020.
What did the US economy get for all that Federal spending? In Q4 2022, Real GDP rose by … 0.91% YoY. Seriously? Is that all there is from $54.8 TRILLION in additional Federal debt?
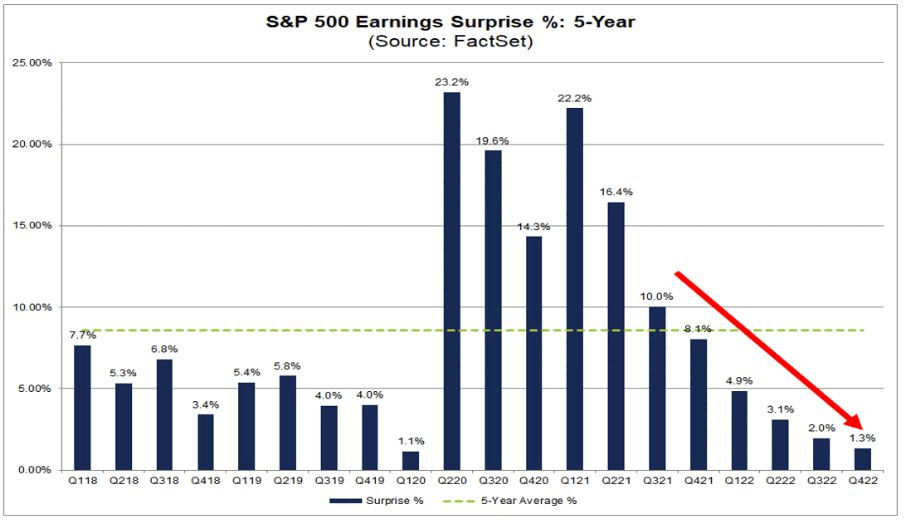
Another bit of lousy news. Look at the trend in S&P 500 Earnings Surprise (5 year).
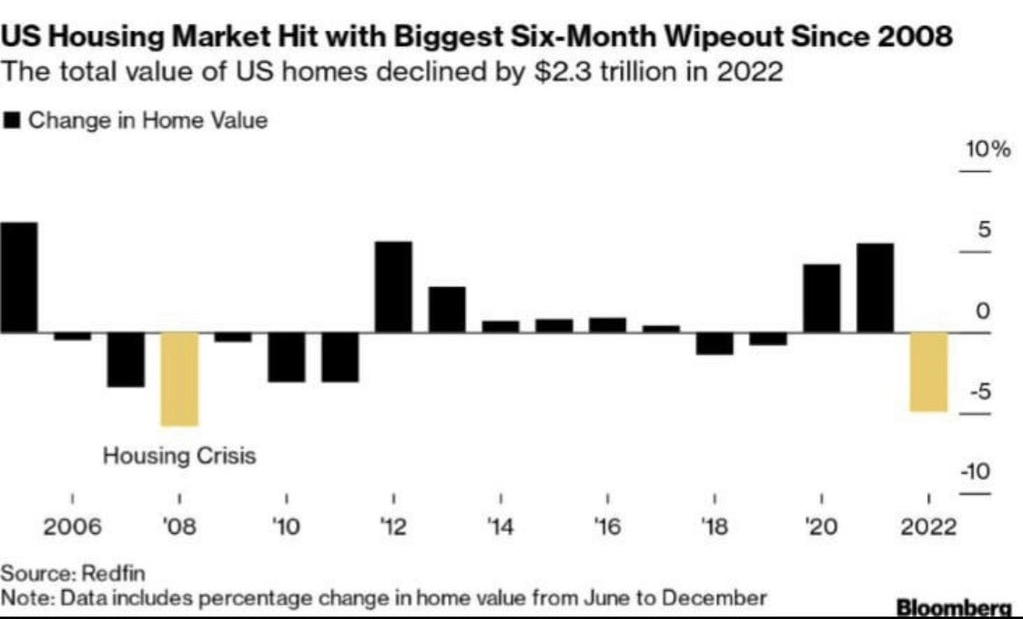
On the housing front, the US housing market was hit with the biggest six-month wipeout since 2008.
At least US Transportation Secretary “Pothole Pete” Buttigieg FINALLY showed up (three weeks after that East Palestine Ohio train disaster). Here is Buttigieg practising for his press conference.
Bull steepenings in the yield curve are generally seen as a precursor to a recession, but they are often preceded by bear steepenings. The 3m30y curve is currently bear steepening, indicating a recession could begin as early as the summer. In fact, the 3m30y curve is now inverted at -94.628 basis points pointing to a recession in summer 2023.
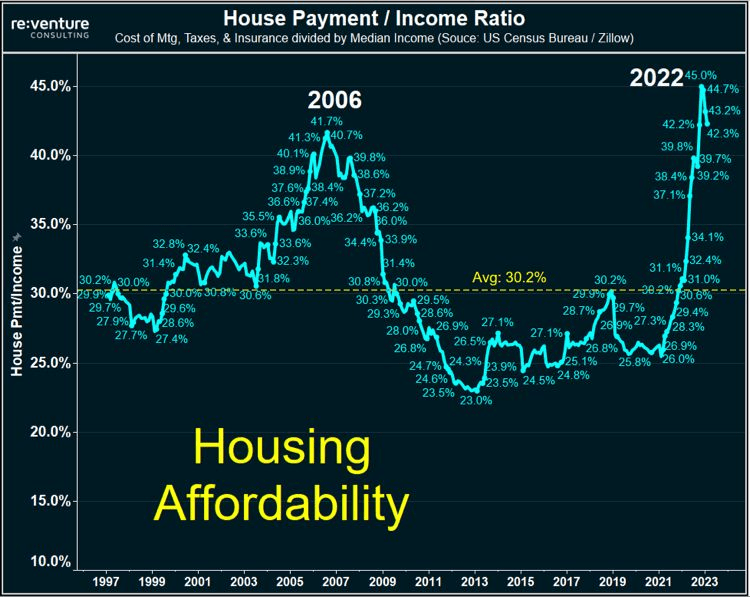
This is happening as the US house payment to income ratio near all-time highs.
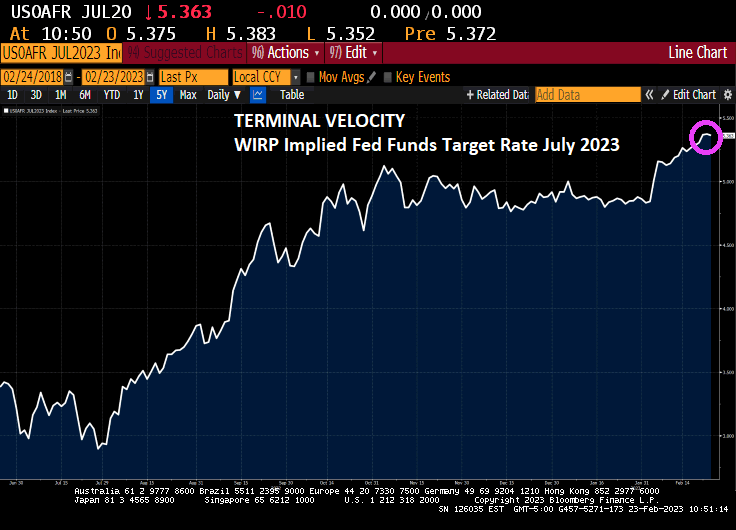
The terminal Fed Funds target rates is now 5.363% for the July FOMC (Fed Open Market Committee) meeting in 2023.
This comes as US Q4 GDP was revised lower on weaker consumer spending, revised downward to 1.4%
With the revision of Personal Consumption, real GDP was revised downward to 2.7% annualized QoQ.
The Taylor Rule estimate for The Fed Funds Target rate is 10.15%. The Fed is only at 4.75%, so there is a long way to go! Except that The Fed doesn’t follow any useful rule like the Taylor Rule. Just the “seat of the pants” rule.
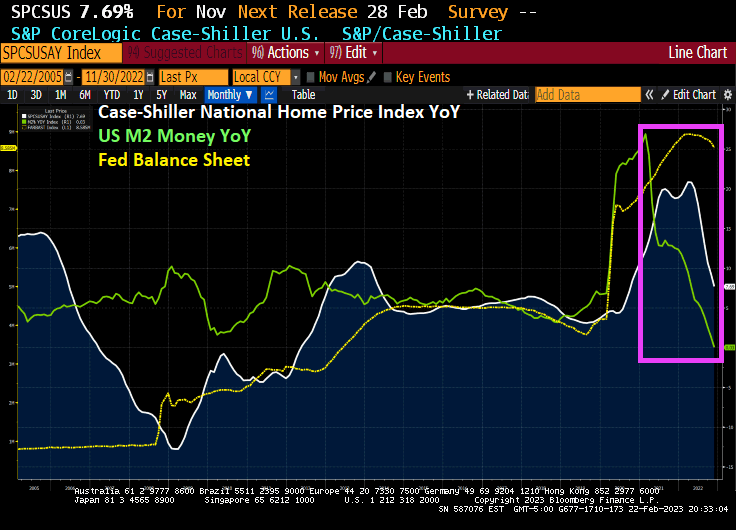
The value of the US housing market shrunk by the most since the 2008 as the pandemic boom (and M2 Money growth) fizzled out.
After peaking at $47.7 trillion in June, the total value of US homes declined by $2.3 trillion, or 4.9%, in the second half of 2022, according to real estate brokerage Redfin. That’s the largest drop in percentage terms since the 2008 housing crisis, when home values slumped by 5.8% from June to December.
Homebuyers, already facing record-high prices, took an additional hit from mortgage rates that more than doubled last year. With less competition in the market, the median US home sale price was $383,249 last month, down from a peak of $433,133 in May.
To be sure, home prices are not collapsing. In December, the total value of US houses was still 6.5% higher than it was a year earlier.
Florida Gains
How much homeowners lost depends on where they bought. The biggest declines were in pricey cities like San Francisco and New York, while buyers who moved to pandemic boomtowns are still seeing the returns on their investment, particularly in Florida.
That was especially true in Miami, where the total value of homes ballooned 20% year-over-year to $468.5 billion in December, the largest annual percentage increase among the top metro areas. While the overall US housing market is down, Miami’s market has about the same value as when it peaked at $472 billion in July. Meanwhile, homeowners in North Port-Sarasota, Florida, Knoxville, Tennessee, and Charleston, South Carolina, all saw annual gains above 17% in 2022.
On the corporate side, US bankruptcies in 2023 had the worst start to a year since 2010 and the financial crisis.
On the personal finance side of the ledger, the delinqueny rate on credit cards is growing at the faster rate since 2010.
Throw in 22 straight months of negative REAL wage growth, and have a scary situation facing middle America.
And the shate of outstanding subprime auto debt (30 days or more delinquent) is up to the highest rate since … well, you know when. The financial crisis of 2009-2010.
President Biden loves to demonize his opponents like Republicans over spending and the Federal budget. Biden argued that his budget won’t increase taxes on Americans making less than $400,000 a year and will ultimately cut the deficit by $2 trillion over the next decade. The president has yet to release his budget plan but has promised to do so by March 9.
Of course, Biden ignores “the inflation tax” which is crippling American households (negative REAL hourly earnings growth for 22 straight months). And while he won’t raise taxes on Americans making less than $400,000 (he doesn’t have the authority), he loves to spend money like most of Congress. Without tax increases, The Federal Government will have to issue MORE debt and run budget deficits in perpetuity.
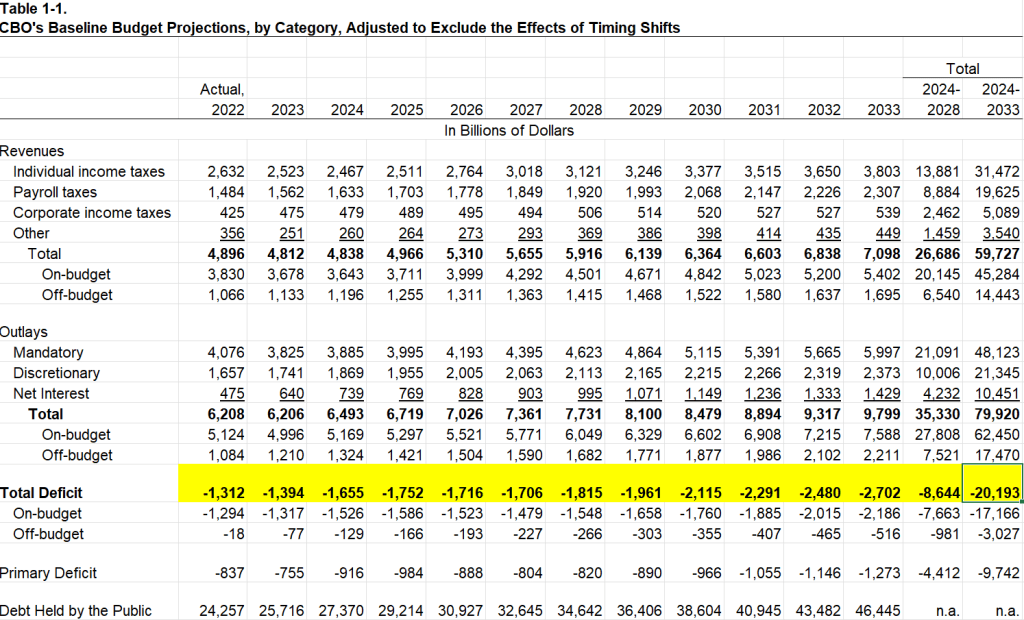
Here is the sickening forecast of Federal budget deficits. Budget deficits are forecast to keep rising and are project to hit -$20 TRILLION over the next 10 years.
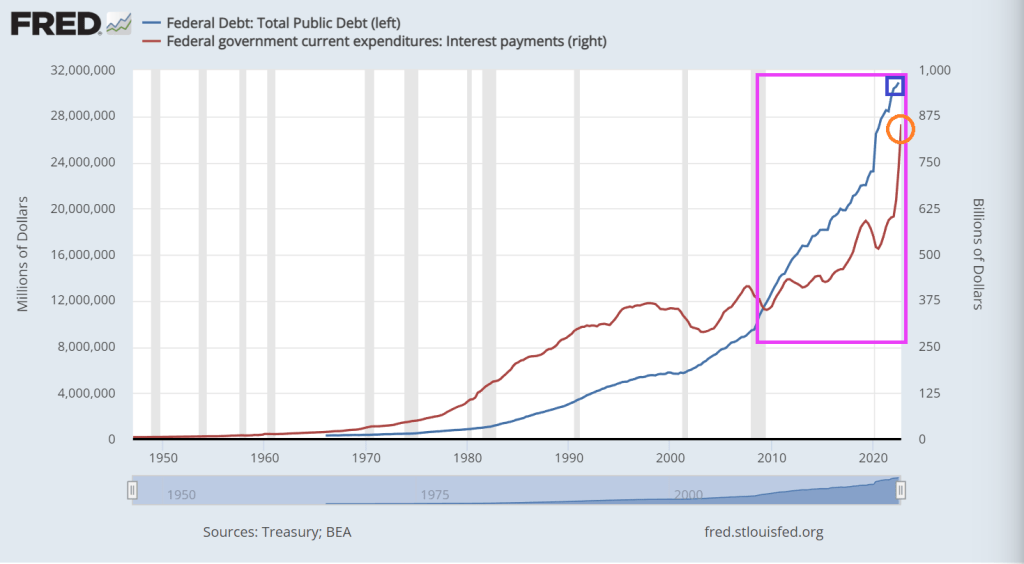
The US is already experiencing irresponsible growth in Federal debt and interest payments on the Federal debt.
Interest costs will nearly triple in the next decade. The Federal Reserve has increased interest rates eight times since early 2022 to combat high inflation — which has contributed to the significant increase in the federal government’s cost of borrowing. In CBO’s projections, such costs would rise from $475 billion in 2022 to $1.4 trillion in 2033. Over the upcoming decade, CBO projects that net interest payments will total $10.5 trillion; relative to the size of the economy, net interest would grow from 2.4 percent this year to 3.6 percent in 2033. In 2030, the ratio of interest to GDP would total 3.3 percent, the highest recorded since 1940 (the first year for which such data are reported).
US inflation is causing The Federal Reserve to raise interest rates, and mortgage applications are suffering.
Mortgage applications decreased 7.7 percent from one week earlier, according to data from the Mortgage Bankers Association’s (MBA) Weekly Mortgage Applications Survey for the week ending February 10, 2023.
The Refinance Index decreased 13 percent from the previous week and was 76 percent lower than the same week one year ago. The seasonally adjusted Purchase Index decreased 6 percent from one week earlier. The unadjusted Purchase Index decreased 5 percent compared with the previous week and was 43 percent lower than the same week one year ago.
The MBA contract rate rose 3.4% from 6.18% to 6.39% as The Fed tightens.
And if you believe the Taylor Rule (as opposed to The Fed’s current politically-based decisions), The Fed’s target rate should be 10.15% and The Fed is less than half way there at 4.75%.
The Fed is expected (by investors in Fed Funds Futures) to rise to 5.283% by the July FOMC meeting, then decline to under 5% by January ’24.
Speaking of Fed rate hikes, January’s red hot retail sales (up 3% MoM) is surely going to drive inflation UP and The Fed will keep raising rates.


You must be logged in to post a comment.