The US Federal Reserve has not created a CBDC … yet. Our woefully corrupt El Presidente Jose Biden (more of a Latin American, tinhorn Banana Republic dictator than as US President) has ordered the study of a CBDC. Since everything Biden touches reeks of “boodle” I am suspicious as to Biden’s motives.
There are some positives to a CBDC, mostly with WHOLESALE CBDCs. Wholesale CBDCs are similar to holding reserves in a central bank. The central bank grants an institution an account to deposit funds or use to settle interbank transfers. Central banks can then use monetary policy tools, such as reserve requirements or interest on reserve balances, to influence lending and set interest rates.
It is the RETAIL CBDC that is the cause for concern. Retail CBDCs are government-backed digital currencies used by consumers and businesses. Retail CBDCs eliminate intermediary risk—the risk that private digital currency issuers might become bankrupt and lose customers’ assets.
There are two types of retail CBDCs. They differ in how individual users access and use their currency:5
Token-based retail CBDCs are accessible with private keys or public keys or both. This method of validation allows users to execute transactions anonymously.
Account-based retail CBDCs require digital identification to access an account.
The real problem with CBDCs is that The Federal Reserve and Federal government can trace EVERY EXPENDITURE of a household. Including political contributions, firearm and ammo purchases, etc. With this much information at their disposal, this allows for DIRECT CONTROL of the population.
Given that we now know that Biden used social media platforms to pass false narratives and repress alternative views, can we trust The Federal Reserve with this much information about consumer spending? Of course not. This is a consolidation of censorship and repression of individual liberties.
Yes, paper and coin currency serve a purpose in society as an alternative to barter. Imagine trying to buy a Ford F-150 Lightning (LMAO!) using barter? Ok, we have a system of credit where you can obtain a car loan. But barter, an old system of exchange, is inefficient. That leaves us with physical currency (certain restaurants only allow payment in cash). But many consumers are using Debit Cards as a substitute for physical cash, so this is a giant step towards RETAIL CBDC already.
Alternatives to the US Dollar? Of course, gold and silver are popular choices historically. Then we have rise of the cryptocurrencie market, which some Congressional members want heavily regulated or banned. Why? First, there are some shady crypto activities (see Sam Bankman-Fried and his shady political contributions to Democrats). Second, cryptos are volatile. Why is this of any interest to Congress? Third, cryptos can be used for illegal activities (but so can cash. Just watch Netflix’s Narcos for the shipment of US Dollars to Columbia in mattresses, etc. No, the goal of some members of Congress is to overregulate or obliterate alternatives to the US Dollar … unless The Federal government does it, like The Fed’s CBDC!
With Biden’s Department of Injustic and several Democrat state Attorney Generals indicting Biden’s top political opponent Donald Trump with the intent of preventing him from campaigning for President (sounds so much like other Totalitarian regimes in history), trust in the Federal government and Federal Reserve are almost nonexistant.
Here is chart of the purchasing power of the US Dollar (blue line) since the creation of The Federal Reserve system and core CPI YoY which is still relatively high at 4.86%. That is over twice The Fed’s target rate of 2%.
I am sure that Billions Biden doesn’t understand moral hazard risk. For him, there is no risk, But for the middle class and lower wage worker class, CBDC represent a clear moral hazard risk, particularly if cash vanishes and Congress tries to ban cryptos.
The face of why so many Americans don’t trust The Fed. Or The Biden Administation.
Or this face, Urban Joe Biden (Stalin was Country Joe).
I don’t know whether Cap’n (Credit) Crunch is Fed Chair Powell or the big spender Boss (Tweed) Biden?
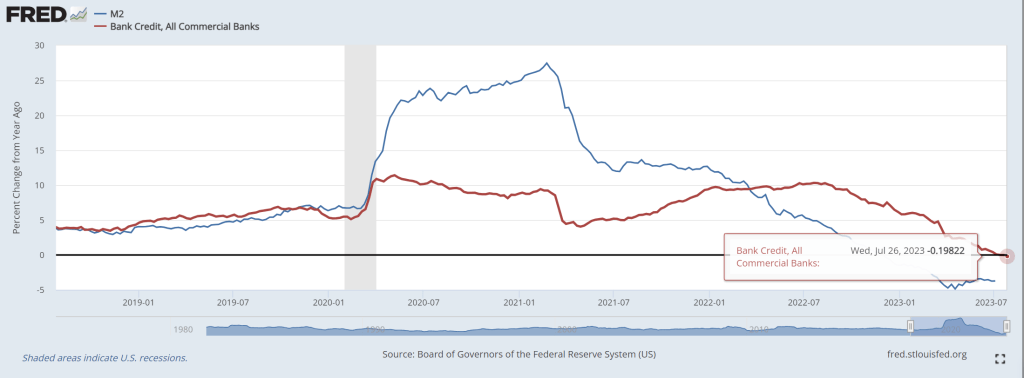
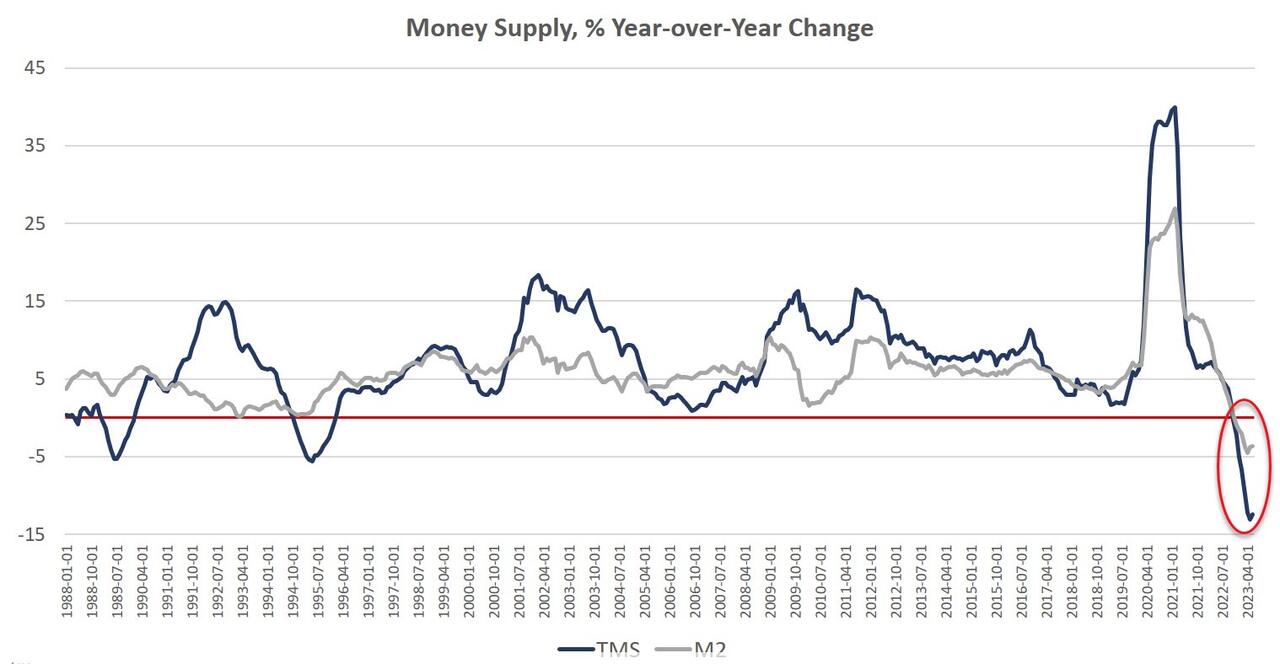
Money supply growth fell again in June, remaining deep in negative territory after turning negative in November 2022 for the first time in twenty-eight years. June’s drop continues a steep downward trend from the unprecedented highs experienced during much of the past two years.
And with M2 Money growth down for 8 consecutive months, bank credit down -0.2% YoY.
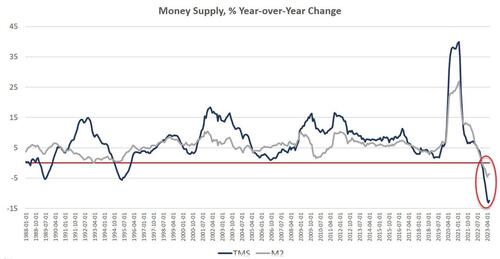
Since April 2021, money supply growth has slowed quickly, and since November, we’ve been seeing the money supply repeatedly contract—year-over-year— for six months in a row. The last time the year-over-year (YOY) change in the money supply slipped into negative territory was in November 1994. At that time, negative growth continued for fifteen months, finally turning positive again in January 1996.
Money-supply growth has now been negative for eight months. During June 2023, the downturn continued as YOY growth in the money supply was at –12.4 percent. That’s up slightly from May’s rate of –13.1 percent, and was far below June’s 2022’s rate of 5.7 percent. With negative growth now falling near or below –10 percent for the third month in a row, money-supply contraction is the largest we’ve seen since the Great Depression. Prior to March through June of this year, at no other point for at least sixty years has the money supply fallen by more than 6 percent (YoY) in any month.
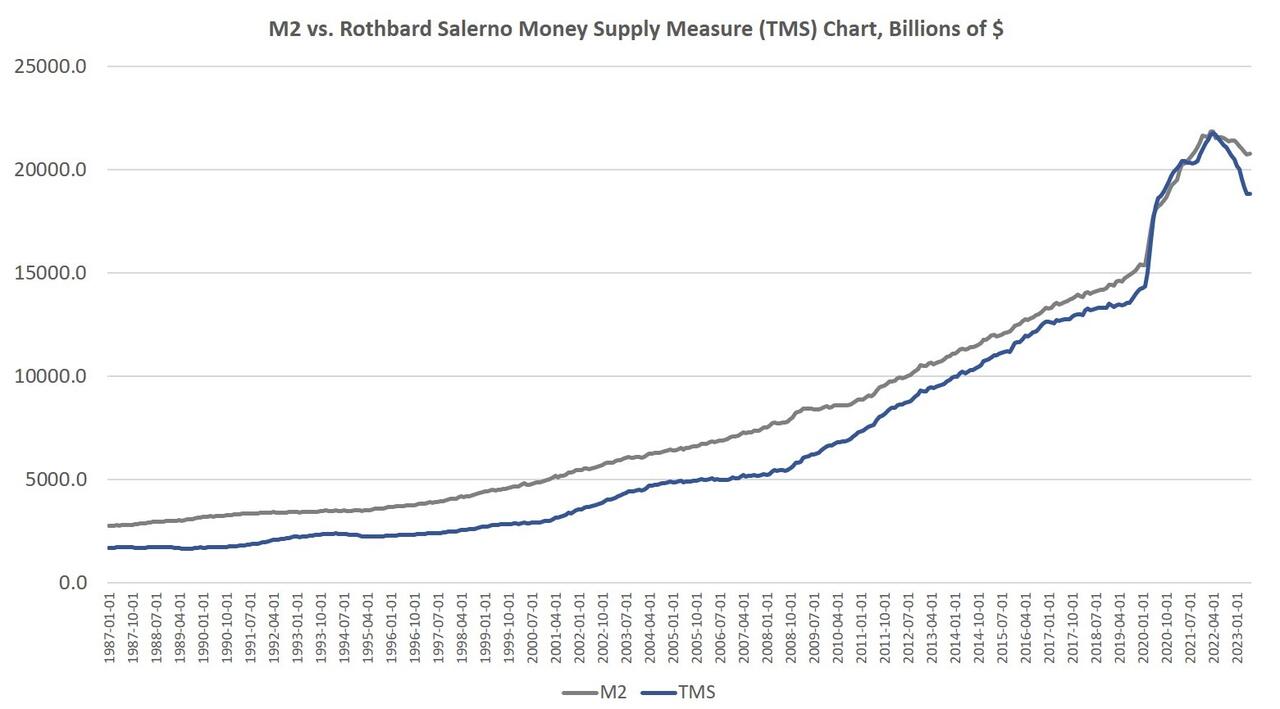
The money supply metric used here—the “true,” or Rothbard-Salerno, money supply measure (TMS)—is the metric developed by Murray Rothbard and Joseph Salerno, and is designed to provide a better measure of money supply fluctuations than M2.
The Mises Institute now offers regular updates on this metric and its growth. This measure of the money supply differs from M2 in that it includes Treasury deposits at the Fed (and excludes short-time deposits and retail money funds).
In recent months, M2 growth rates have followed a similar course to TMS growth rates, although TMS has fallen faster than M2. In June 2023, the M2 growth rate was –3.5 percent. That’s slightly up from May’s growth rate of –3.7 percent. June 2023’s growth rate was also well down from June 2022’s rate of 5.6 percent.
Money supply growth can often be a helpful measure of economic activity and an indicator of coming recessions. During periods of economic boom, money supply tends to grow quickly as commercial banks make more loans. Recessions, on the other hand, tend to be preceded by slowing rates of money supply growth.
It should be noted that the money supply does not need to actually contract to signal a recession and the boom-bust cycle. As shown by Ludwig von Mises, recessions are often preceded by a mere slowing in money supply growth. But the drop into negative territory we’ve seen in recent months does help illustrate just how far and how rapidly money supply growth has fallen. That is generally a red flag for economic growth and employment.
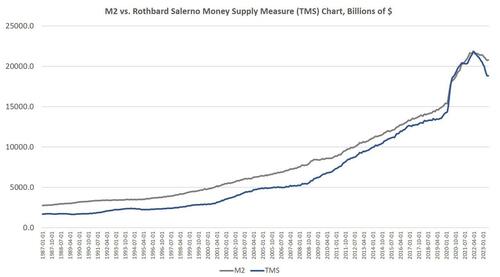
The fact that the money supply is shrinking at all is so remarkable because the money supply almost never gets smaller. The money supply has now fallen by $2.8 trillion (or 15.0 percent) since the peak in April 2022. Proportionally, the drop in money supply since 2022 is the largest fall we’ve seen since the Depression. (Rothbard estimates that in the lead up to the Great Depression, the money supply fell by 12 percent from its peak of $73 billion in mid-1929 to $64 billion at the end of 1932.)
In spite of this recent drop in total money supply, the trend in money-supply remains well above what existed during the twenty-year period from 1989 to 2009. To return to this trend, the money supply would have to drop at least another $4 trillion or so—or 22 percent—down to a total below $15 trillion.
Since 2009, the TMS money supply is now up by nearly 184 percent. (M2 has grown by 146 percent in that period.) Out of the current money supply of $18.8 trillion, $4.5 trillion of that has been created since January 2020—or 24 percent. Since 2009, $12.2 trillion of the current money supply has been created. In other words, nearly two-thirds of the money supply have been created over the past thirteen years.
With these kinds of totals, a ten-percent drop only puts a small dent in the huge edifice of newly created money. The US economy still faces a very large monetary overhang from the past several years, and this is partly why after fourteen months of slowing money-supply growth, we are not yet seeing a sizable slowdown in the labor market.
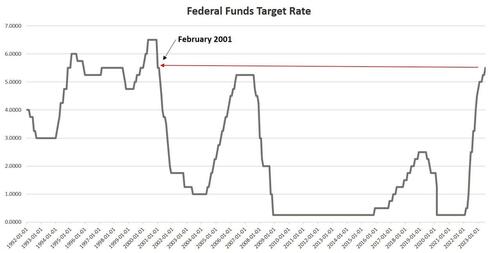
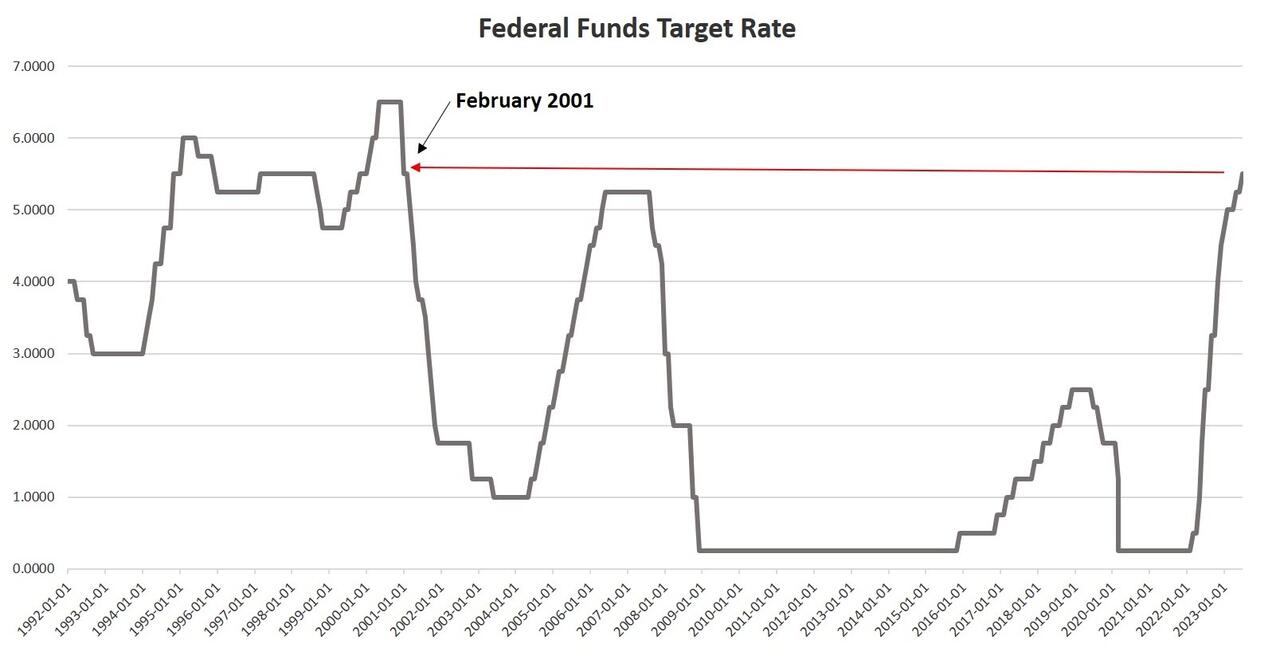
An inflationary boom begins to turn to bust once new injections of money subside, and we are seeing this now. Not surprisingly, the current signs of malaise come after the Federal Reserve finally pulled its foot slightly off the money-creation accelerator after more than a decade of quantitative easing, financial repression, and a general devotion to easy money. As of July, the Fed has allowed the federal funds rate to rise to 5.50 percent, the highest since 2001. This has meant short-term interest rates overall have risen as well. In June, for example, the yield on 3-month Treasurys remains near the highest level measured in more than 20 years.
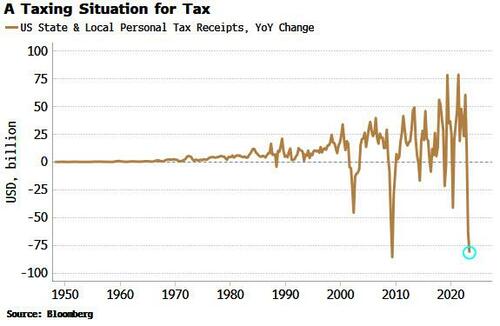
Without ongoing access to easy money at near-zero rates, however, banks are less enthusiastic about making loans, and many marginal companies will no longer be able to stave off financial trouble by refinancing or taking out new loans. For example, Yellow Corporation, a trucking company, has declared bankruptcy and will lay off 30,000 workers. Tyson Foods announced this week it is closing four chicken processing plants in an effort to cut costs. 3,000 workers are likely to lose their jobs as a result. These firms have experienced financial problems for years, but rising interest rates preclude additional delays of the inevitable. We will see more of this as more companies face the realities of higher rates. (In another sure sign of a slowing economy, state and local tax revenues have been falling.)
Meanwhile, as lenders get spooked by tightening cash availability, it’s getting more difficult to qualify for a home loan, and credit availability is the tightest its been in a decade. Meanwhile, the average 30-year mortgage rate rose in July to nearly the highest point since 2002.
One of the most troubling indicators is soaring credit card debt even as interest rates soar. As of May 2023, the commercial bank interest rate rose to the highest rate measured in at least 30 years. Just last year, the interest rate hovered around 15 percent. In May 2023, it reached over 20 percent. This is happening as credit card debt and other revolving loans have reached a new all-time high.
These factors all point toward a bubble that is in the process of popping. The situation is unsustainable, yet the Fed cannot change course without reigniting a new surge in price inflation. Any surge in prices would be especially problematic given the rising cost of living. Both new and used cars are becoming increasingly unaffordable. Ordinary Americans face a similar problem with homes. According to the Atlanta Fed, the housing affordability index is now the worst it’s been since 2006, in the midst of the Housing Bubble.
If the Fed reverses course now, and embraces a new flood of new money, prices will only spiral upward. It didn’t have to be this way, but ordinary people are now paying the price for a decade of easy money cheered by Wall Street and the profligates in Washington. The only way to put the economy on a more stable long-term path is for the Fed to stop pumping new money into the economy. That means a falling money supply and popping economic bubbles. But it also lays the groundwork for a real economy—i.e., an economy not built on endless bubbles—built by saving and investment rather than spending made possible by artificially low interest rates and easy money.
Either Powell is Cap’n (Credit) Crunch or Boss Biden because of his insane spending spree helping inflation hit 40 year high is Cap’n (Credit) Crunch.
While looking up baseball statistics, I found this picture of former Cincinnati Reds outfielder Wally Post. Or is that actor Nick Searcy from “Justified”?
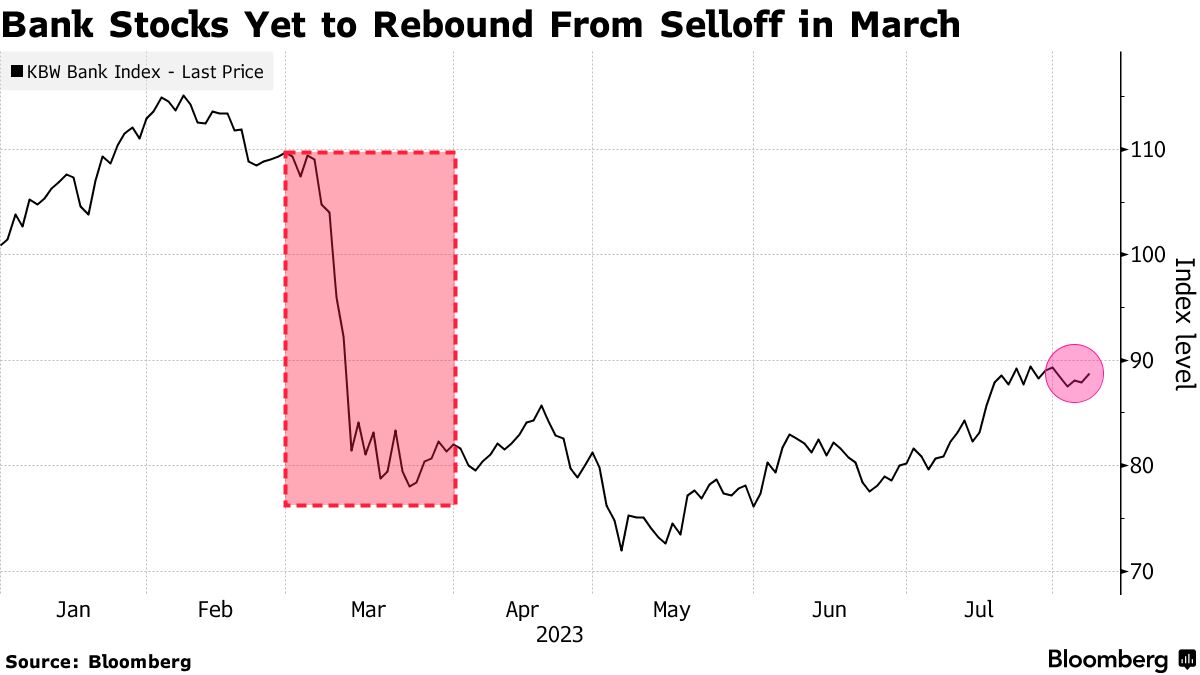
Higher funding costs, potential regulatory capital weaknesses and rising risks tied to commercial real estate are among strains prompting the review, Moody’s said late Monday.
“Collectively, these three developments have lowered the credit profile of a number of US banks, though not all banks equally,” the rating company said.
Moody’s Sees Problems Ahead for US Banks
Rating company issues raft of downgrades, outlook
Source: Moody’s
Shares declined for firms that had their ratings cut, including M&T Bank Corp., down 3.2%, and Webster Financial Corp., which lost 1.3%. Moody’s also adopted a “negative” outlook for 11 lenders, including PNC Financial Services Group, Capital One Financial Corp. and Citizens Financial Group Inc. Among those, PNC was down 2.2% and Capital One lost 2.4%.
Investors, rattled by the collapse of regional banks in California and New York this year, have been watching closely for signs of stress in the industry as rising interest rates force firms to pay more for deposits and bump up the cost of funding from alternative sources. At the same time, those higher rates are eroding the value of banks’ assets and making it harder for commercial real estate borrowers to refinance their debts, potentially weakening lenders’ balance sheets.
“Rising funding costs and declining income metrics will erode profitability, the first buffer against losses,” Moody’s wrote in a separate note explaining the moves. “Asset risk is rising, in particular for small and midsize banks with large CRE exposures.”
Some banks have curbed loan growth, which preserves capital but also slows the shift in their loan mix toward higher-yielding assets, Moody’s said.
Banks that depend on more concentrated or higher levels of uninsured deposits are more exposed to these pressures, especially banks with high levels of fixed-rate securities and loans.
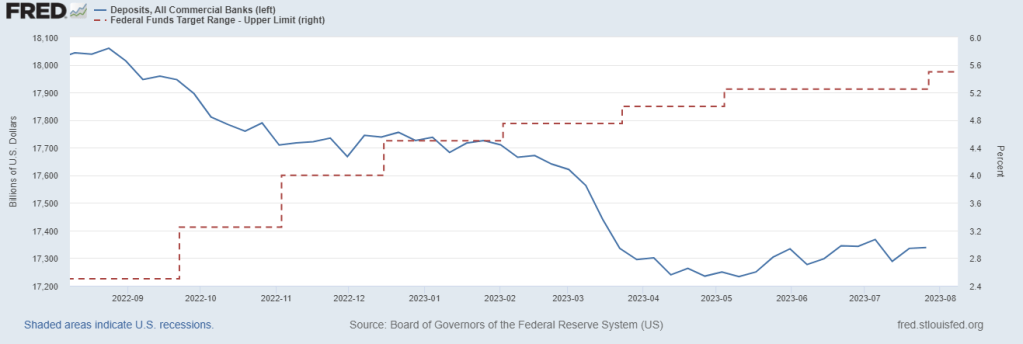
Deposits are declining as The Fed hikes rates.
So, Bidenomics reminds me of the film “Rollerball” where big corporations run the government and run a game akin to Rome’s gladiator fights.
Yes, Bidenomics is an FDR-type massive expansion of government into the private sectors requiring massive Federal spending … and inflation. Except that it beenfits anything BIG and powerful to the detriment of the small and weak.
(Bloomberg) Friday’s jobs data sparked a relief rally in bonds and a flatter yield curve, but the pain trade is still for higher yields and a steeper curve – the lesser-spotted bear steepener – with this week’s CPI a potential catalyst.
Last week was a turbulent one for bonds, but the continued softening in payrolls data served to remind the market that supply and fiscal-profligacy fears have to be counter-balanced with an economy that’s in its late-cycle stages.
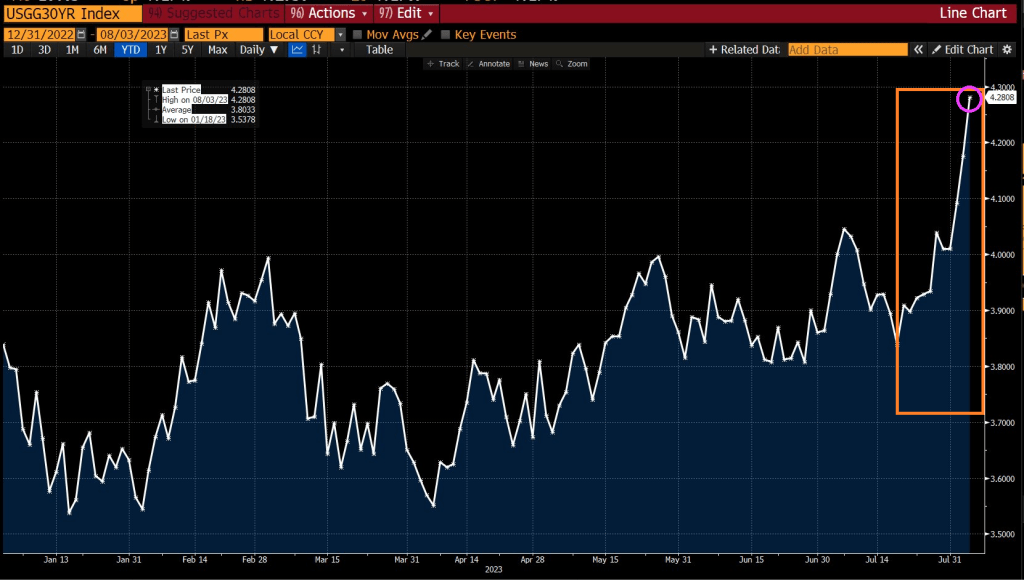
After the data, 10-year yields took the elevator back down to sub-4.05% after briefly going above 4.20%. They have since clambered back to 4.12%, but their next cue is likely to come from Thursday’s CPI report. Headline is expected to nudge back up to 3.3% (from 3% last month), mainly due to base effects, and core is expected to hold steady at 4.8%.
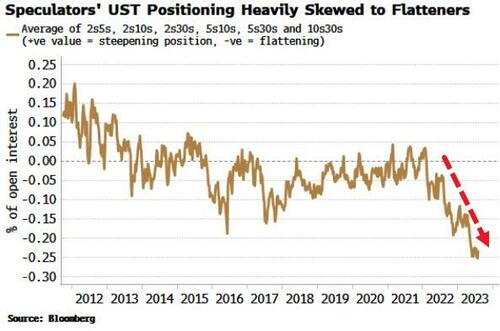
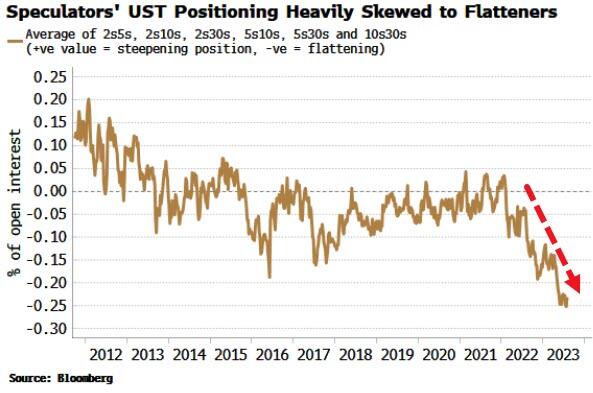
Still, stronger-than-expected data probably means higher yields in a market more acutely alert to inflation (and therefore supply) risks. As with last week, term premium would likely drive the move, meaning a curve steepening. After relentlessly flattening for the last two years, the pain trade is for a steeper curve. Implicit positioning of speculators from the COT report shows there is a heavy skew to a flatter curve.
The negative carry for most flatteners remains punitive (for 2s10s USTs it’s ~83bps over a year), but the large upside potential from supply/inflation worries and the covering of positions begins to make that look less insurmountable.
Finally, the Bundesbank’s decision to stop paying interest on domestic government deposits – which initially pushed short-term German bonds higher this morning – highlights the broader issue of central banks paying interest on reserves when they are superabundant.
In the days of QE and 0% interest rates, the ECB and Fed at al. remitted money to their treasuries from the income on their bond portfolios.
But now that is reversed as bond income is dwarfed by the cost of paying interest on trillions of bank reserves. Take the Fed, whose debt to the Treasury is now accruing at over $2 billion each week.
This is something that will become more politically contentious, especially as economies continue to slow and cost-of-living pressures bite further.
Bidenomics. The takeover of the US economy by BIG corporations, BIG labor unions, BIG tech, BIG pharma, BIG defense, BIG healthcare, BIG media, BIG banks, BIG tech, BIG … Well, anyting that is BIG and powerful that can buy influence in Congress and the Administration. Except BIG energy which lost out to BIG Progressive DC thinktanks.
Leading to BIG inflation!
But I feel good! Even though inflation expectations are soaring again as gasoline soars again.
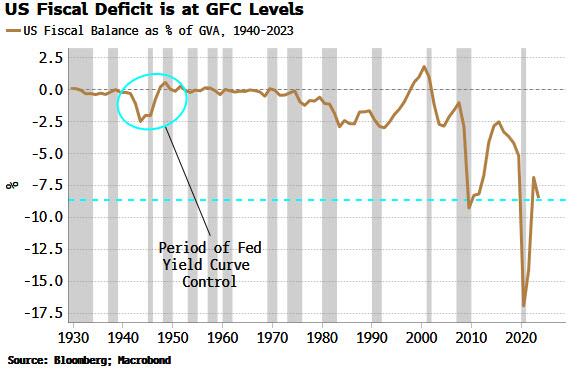
First, the deficit. It’s close to historical wides, bigger than it’s ever been outside of a recession, and almost as wide as it was in the depths of the GFC. It’s the largest in the world in GDP terms, and it is currently heading in the wrong direction. This heaps more pressure on the government debt-to-GDP level, already uncomfortably high at 112%.
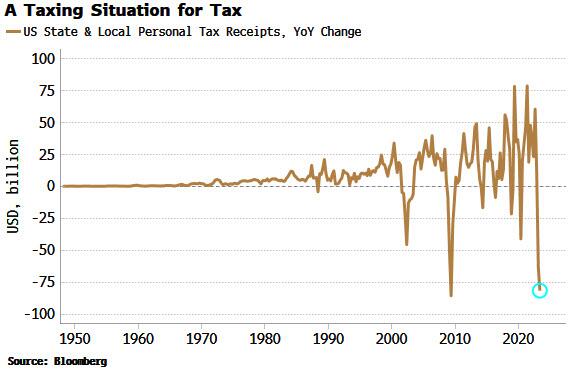
Second, tax revenues. These have seen almost their largest annual fall ever, in an economy that’s supposed to be growing at 2.4%.
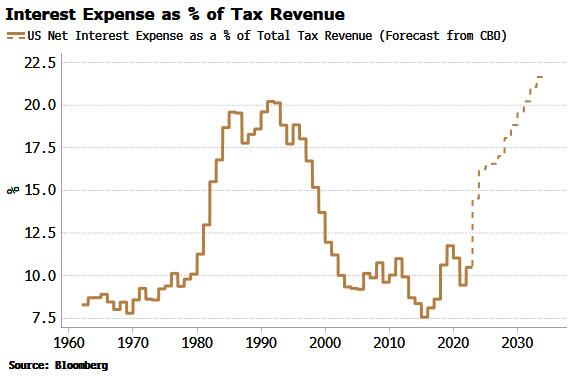
And then there’s rising interest-rate costs. The total interest expense as a percentage of tax revenue is expected to rise sharply in the next year or two, and make new highs by the end of the decade. However, these CBO forecasts should be taken with a grain of salt as they are based on a 10-year yield of only 3.8% (the ten-year average has been higher than that in every decade bar the 2010s and 2020s).
My former student at University of Chicago’s MBA program, Kevin Smith of Crescat Capital, has this charming chart of state and local income tax receipts collapsing.
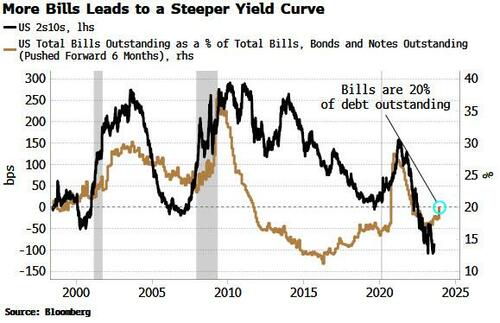
There is a view the Treasury is already implementing YCC, based on the fact it has been skewing its issuance towards bills and away from coupons. But issuing more bills is simply the easiest and fastest way for the Treasury to replenish its account at the Fed (the TGA). It was run down to almost zero in the lead-up to the debt-ceiling limit, and has now risen to over $500 billion.
This level of bill issuance is not unusual. The Treasury has an implicit target of about 20% for the amount of bills outstanding as a percentage of total debt. As we can see from the chart below, bills have often been more than 20% of debt outstanding over the last 30 years. Moreover, the Treasury announced this week it was raising its coupon-issuance amounts.
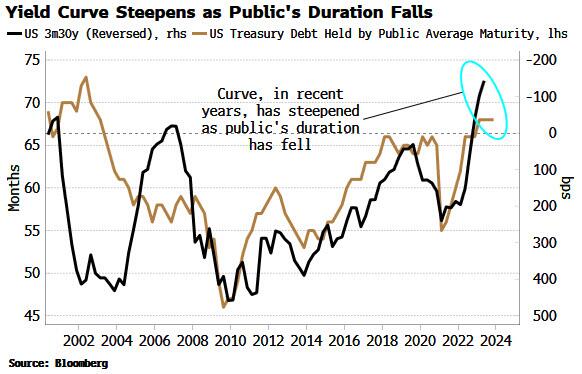
According to the stealth YCC thesis, less longer-dated Treasury issuance implicitly caps longer-term yields, but this has not historically been the case. As the chart above shows, the yield curve typically steepens – not flattens – when there is greater bill issuance – the opposite of what is desired by YCC.
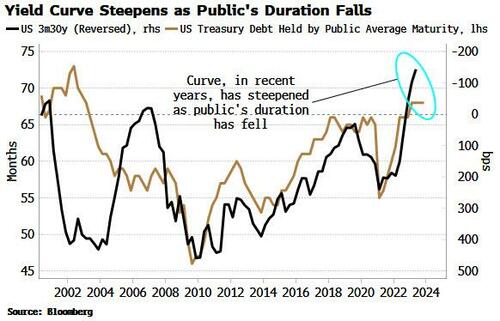
We see the same relationship if we look the duration of US government debt outstanding. When the average duration falls – as it would if issuance is skewed toward bills – the yield curve tends to steepen. The current average duration held by the public is consistent with a steeper, not a flatter, yield curve.
This sounds counter-intuitive. If issuance drives yields, then more issuance at the front-end of the curve versus the longer end – equating to a fall in duration – implies the yield curve should flatten.
But the fact the relationship is the other way implies it’s likely that demand is the more dominant driver of yields in the medium term. There is ready-made demand for bills, from MMFs, etc, so when supply increases, demand rises to meet it, suppressing the yield-curve impact.
It’s thus hard to argue the Treasury is engaging in yield curve control. But that does not detract from the rising possibility it will need to be implemented in some shape or form eventually.
Banks and the Fed are reducing their Treasury holdings, while foreigners now collectively own about $5 trillion less USTs – about 10% – than they did in 2021. At the same time the “Treasury put” means large fiscal deficits are likely to become a feature, not a bug. That means inflation is likely to become embedded.
Fiscal profligacy and elevated price growth are a combustible mix and a road to prohibitively high yields via rising term premium. Yield capping thus starts to look like the endgame.
How it’s done is another matter, whether it’s the Fed co-opted to cap yields as it was in WWII, Treasury buybacks, or financial repression, whereby domestic institutions are forced to hold more government debt. Whatever way, at some point yield curve control in the US is becoming increasingly likely – by stealth or otherwise.
But never fear! Janet “Too Low For Too Long Creating Asset Bubbles” Yellen is still US Treasury Secretary.
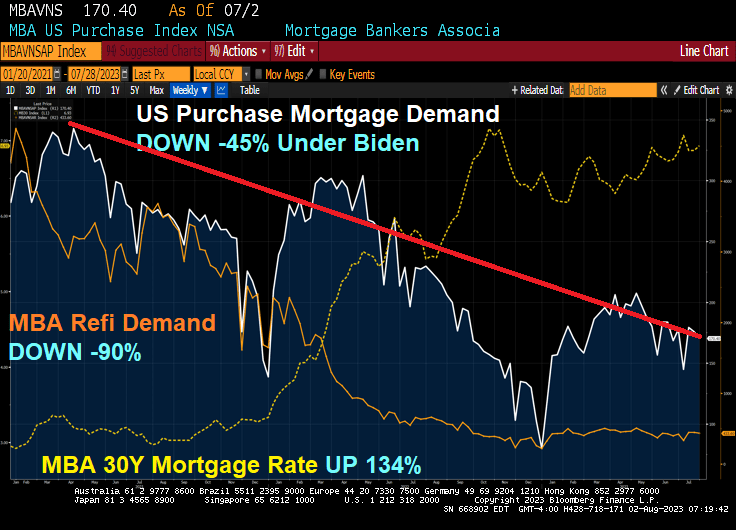
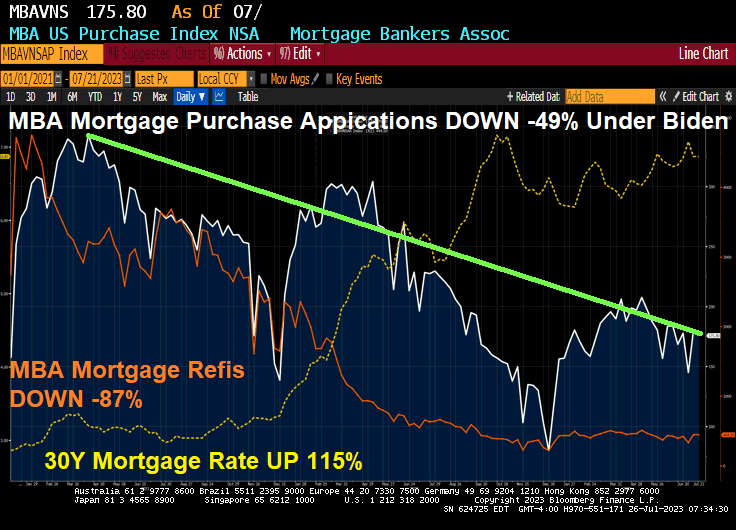
Inflation under Biden has been very painful for the US middle class and low wage workers. That inflation has resulted to surging mortgage rates thanks to The Fed’s counterattack.
The result? Mortgage rates are up 134% under Bidenomics, while mortgage purchase demand is down -45% since Biden was selected. And mortgage refinancing demand is down a staggering -90%!
Mortgage applications decreased 3.0 percent from one week earlier, according to data from the Mortgage Bankers Association’s (MBA) Weekly Mortgage Applications Survey for the week ending July 28, 2023.
The Market Composite Index, a measure of mortgage loan application volume, decreased 3.0 percent on a seasonally adjusted basis from one week earlier. On an unadjusted basis, the Index decreased 3 percent compared with the previous week. The Refinance Index decreased 3 percent from the previous week and was 32 percent lower than the same week one year ago. The seasonally adjusted Purchase Index decreased 3 percent from one week earlier. The unadjusted Purchase Index decreased 3 percent compared with the previous week and was 26 percent lower than the same week one year ago.
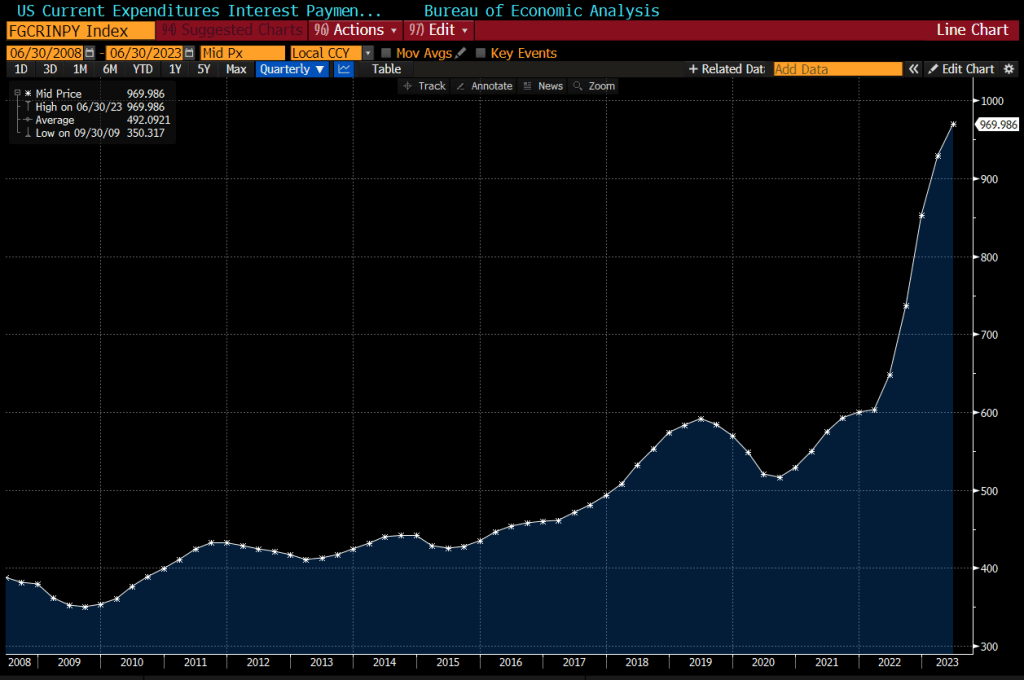
US interest expenses have surged by about 50% in the past year, to nearly $1 trillion on an annualized basis.
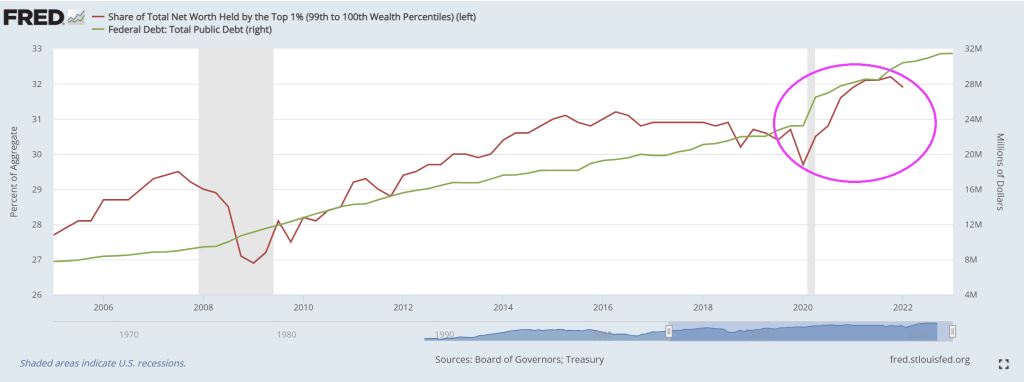
Look at the share of net worth by the top 1% as Treasury borrows more money.
Oddly, Biden is not talking about about putting US government policies up for sale to the highest bidders. But don’t worry. Biden is the King of Corruption in the District of Corruption (Washington DC).
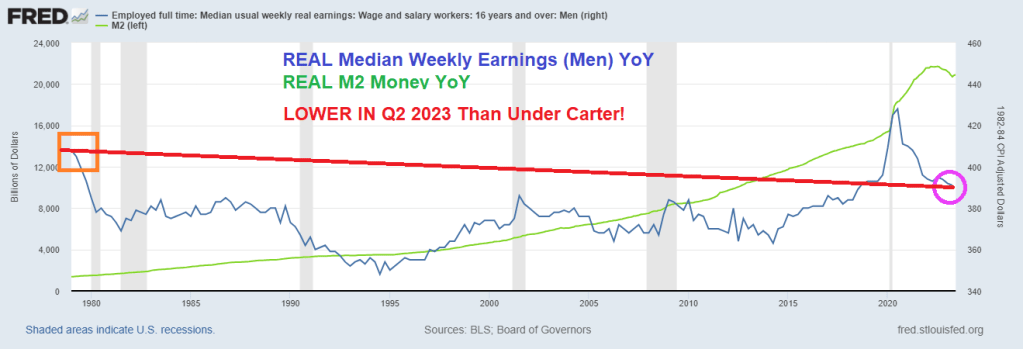
President Jimmy Carter is usually the bar for terrible Presidents. Under Carter, the US experienced economic stagnation and soaring inflation. At least it led to the election of Ronald Regan!
So, Biden’s much mentioned Bidenomics have produced REAL MEDIAN WEEKLY EARNINGS FOR MEN that is currently below 1979 levels under Jimmy Carter.
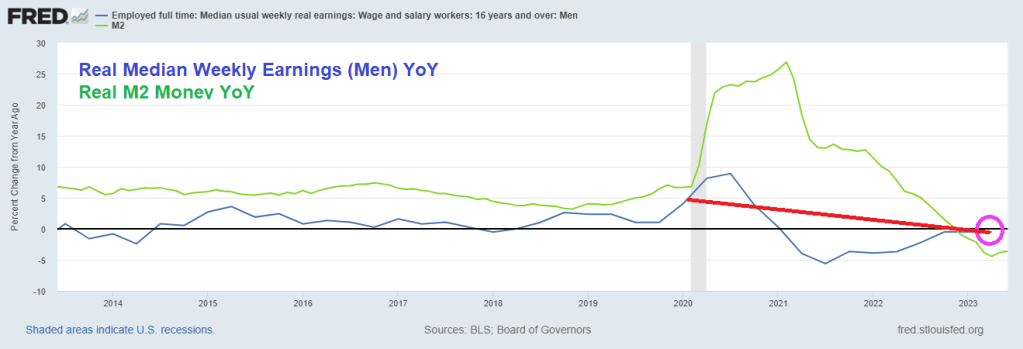
Even worse for Bidenomics, REAL MEDIAN WEEKLY EARNINGS GROWTH FOR MEN was -4.45% In April 2023, while the last reading prior to Covid under Trump was 6.674% YoY in February 2020. So, Bidenomics isn’t even back to Trump levels for men.
I like this chart which I call “Yellenomics” because it illustrates The Fed’s Folly of money printing and its impact on real earnings. After the Trump wage growth boom, real median weekly earnings for men has been steadily declining.
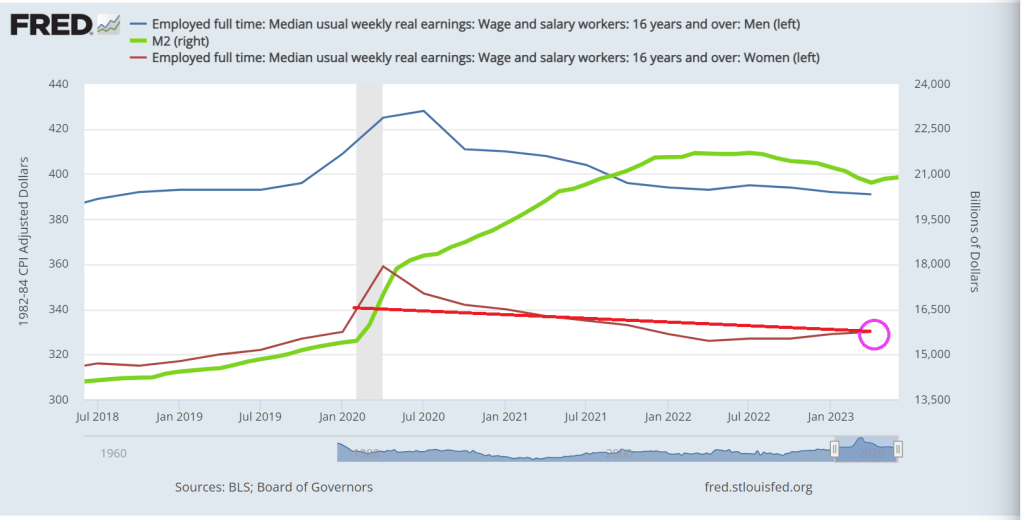
Women, on the other hand, did show a gain since Carter, but still lower than the last month before Covid struck. Women’s real median weekly earnings growth YoY since Q2 2021 are down -5%. So, Bidenomics has been less sucky for women than men.
Reminds me of The Yardbird’s classic “I’m A Man.” Worse off under Biden than under Jimmy Carter. Although The Yardbird’s “Over Under Sideways DOWN” is more emblematic of Bidenomics.
Bidenomics should be renamed Corruptionomics given Biden’s habit of selling government influence to anyone willing to waive a few million.
Bidenomics, aka the Federal government takeover of the US economy with Soviet-style economic central planning, is highly dependent on loose Federal Reserve monetary policy (Janet Yellen and Powell’s wild overreaction to the massively inappropriate Covid shutdowns),
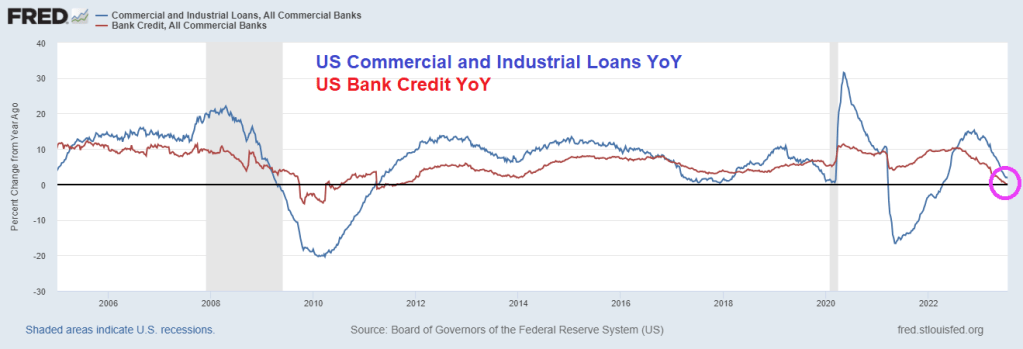
So, how is Bidenomics working out? On the bank lending front, commercial and industrial (C&I) lending growth is crashing along with bank credit growth YoY.
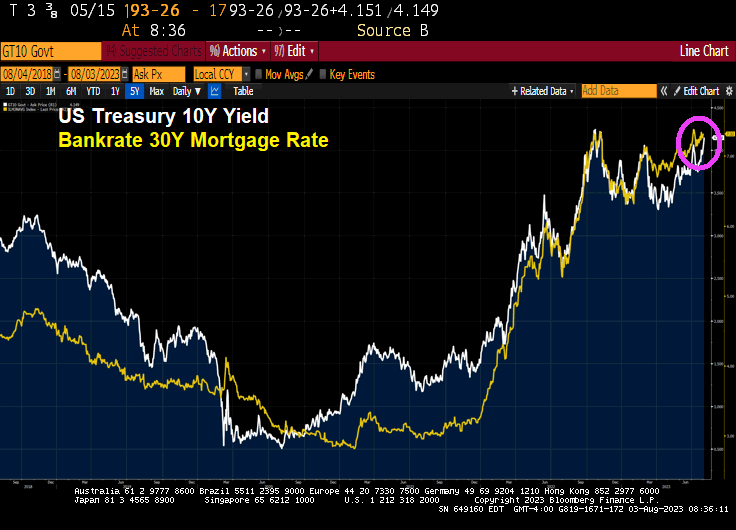
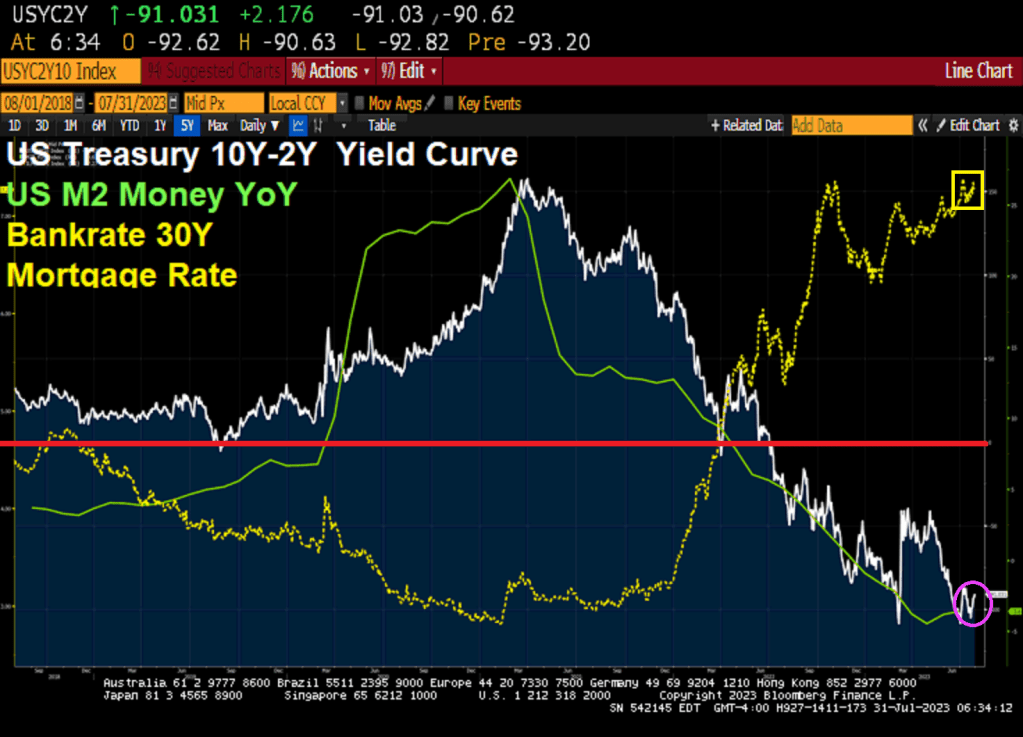
The US Treasury 10Y-2Y yield curve remains deeply inverted at -91.031 basis points and M2 Money growth has crashed. The 30 year mortgage rate is hovering around 7.27%.
Joe Biden said that Republicans will impeach him in the House of Representatives since inflation is coming down. Huh? No Joe, it is because your are the most corrupt President in history, a compulsive liar and your economic policies are pure World Economic Forum mandates (open borders, Central Bank Digital currency, green energy, etc). Biden started off his Presidency by declaring war on fossil fuels that helped drive prices through the roof. And the middle class are paying the price.
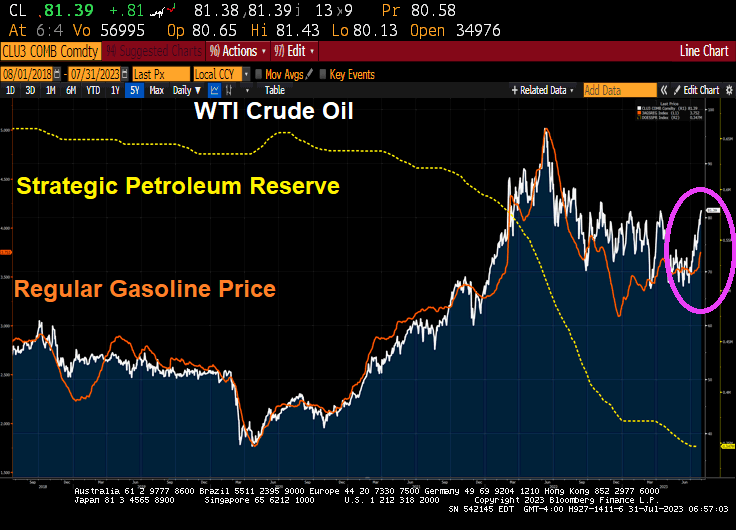
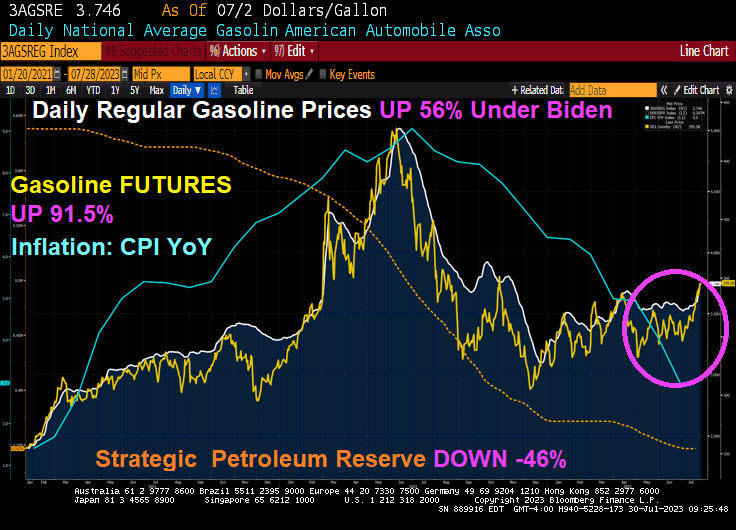
But as inflation cools (blue line) thanks in part to Biden draining the Strategic Petroleum Reserve (orange line), Biden can gloat. But remember, gasoline prices remain 56% higher under Biden’s Reign of Error. Even worse, gasoline FUTURES are up 91.5% under Biden. Yikes!
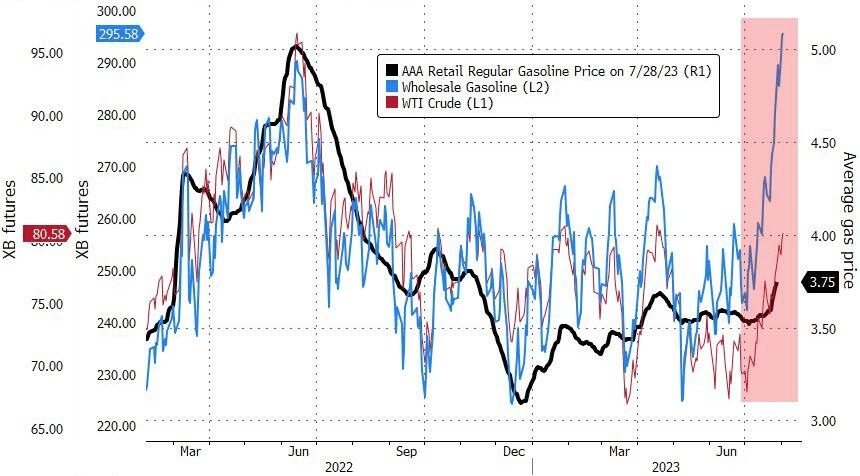
But look at how gasoline prices and gasoline futures have risen in July (pink circle). The last inflation report showed that inflation has declined to 3% (still higher than The Fed’s 2% target), gasoline prices are up almost 5% since July 19, 2023.
Gasoline, meanwhile, started the year at less than $2.50 per gallon. This week, gasoline topped $2.90 per gallon and may yet reach $3.
WTI Crude Oil futures have broken through the $80 barrier … again. Heating oil futures are up 1.43% today with WTI Crude futures up 0.61%.
So as energy prices keep rising (and Biden’s EPA keeps issuing green energy edicts and fails to recognize that our power grid can’t support all the electric cars and trucks envisioned by the Obama/Biden green dreamers). As such, energy prices will keep rising and with it … inflation.
Mortgage applications decreased 1.8 percent from one week earlier, according to data from the Mortgage Bankers Association’s (MBA) Weekly Mortgage Applications Survey for the week ending July 21, 2023.
The Market Composite Index, a measure of mortgage loan application volume, decreased 1.8 percent on a seasonally adjusted basis from one week earlier. On an unadjusted basis, the Index 1.5 percent compared with the previous week. The Refinance Index decreased 0.4 percent from the previous week and was 30 percent lower than the same week one year ago. The seasonally adjusted Purchase Index decreased 3 percent from one week earlier. The unadjusted Purchase Index decreased 2 percent compared with the previous week and was 23 percent lower than the same week one year ago.
Since April 2021, purchase mortgage demand is down -49%, refi mortgage demand is down -87% as mortgage rates are up 115%.


You must be logged in to post a comment.