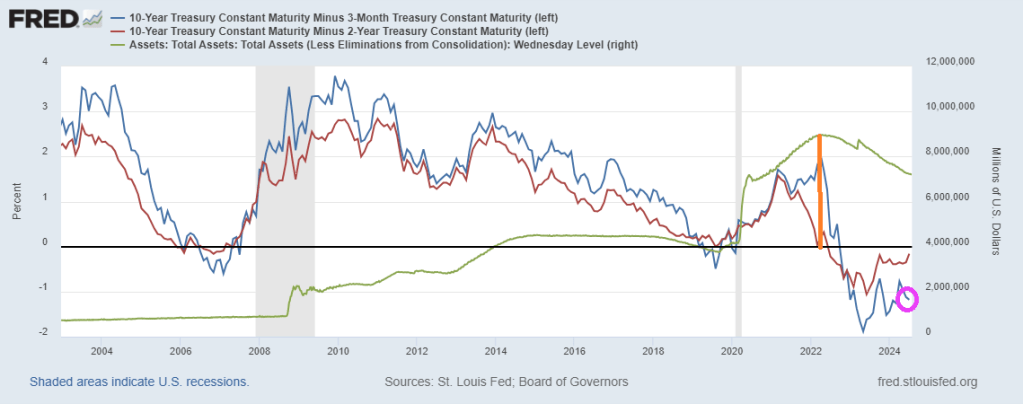
Up until 2022, the US Treasury yield curve behaved normally. In fact, as late as May 6th, 2022, the US Treasury 10Y-3M yield curve was at +227 basis points. Denote by the orange line in the following chart. That date corresponded with peak Fed balance sheet.
Then the massive spending by Biden/Harris/Congress hit the fan and inflation soared. The Fed counter attacked by raising rates and began scaling back their balance sheet. The 10Y-3M yield curve has been negative ever since.
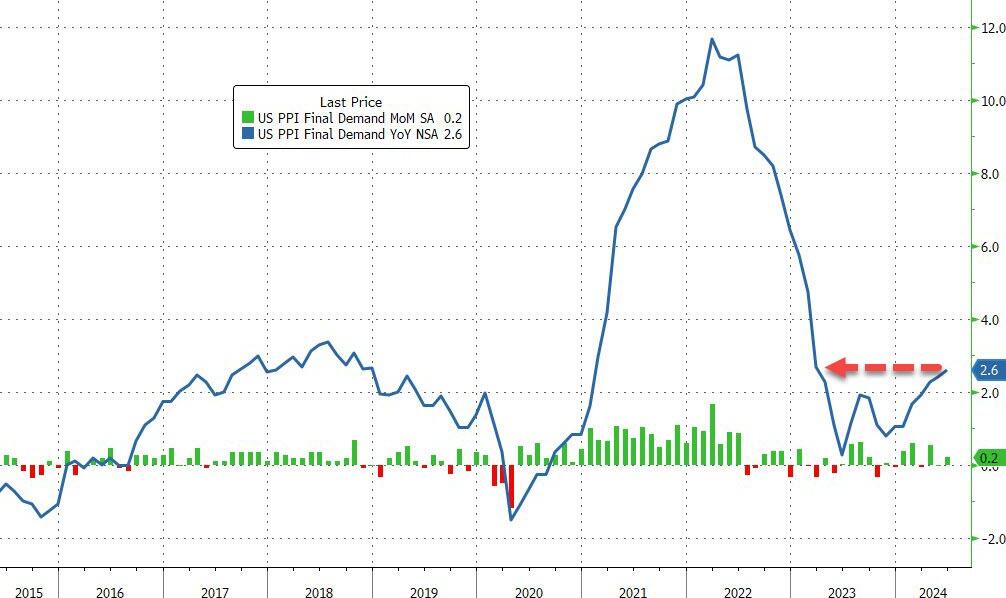
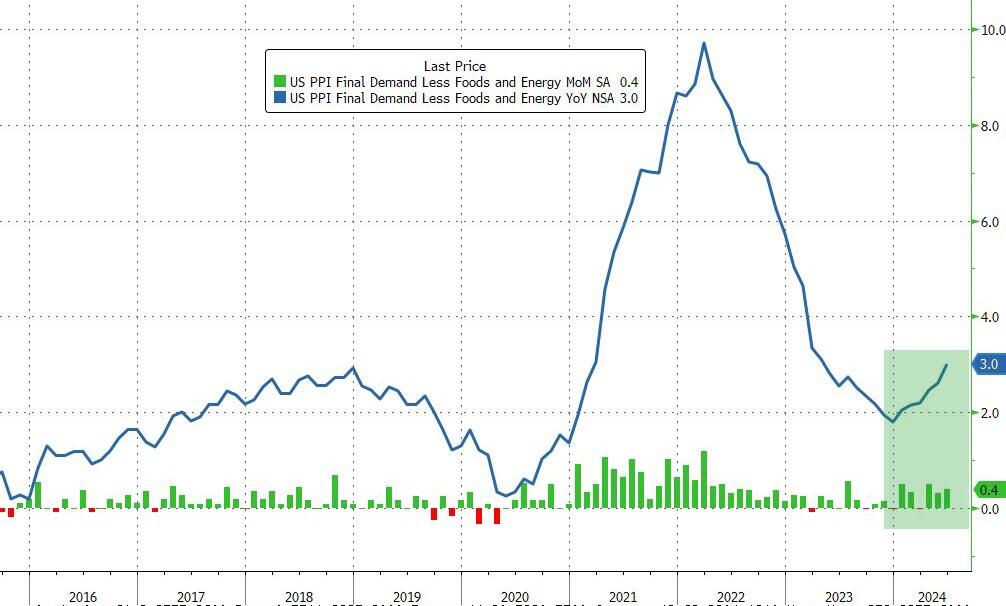
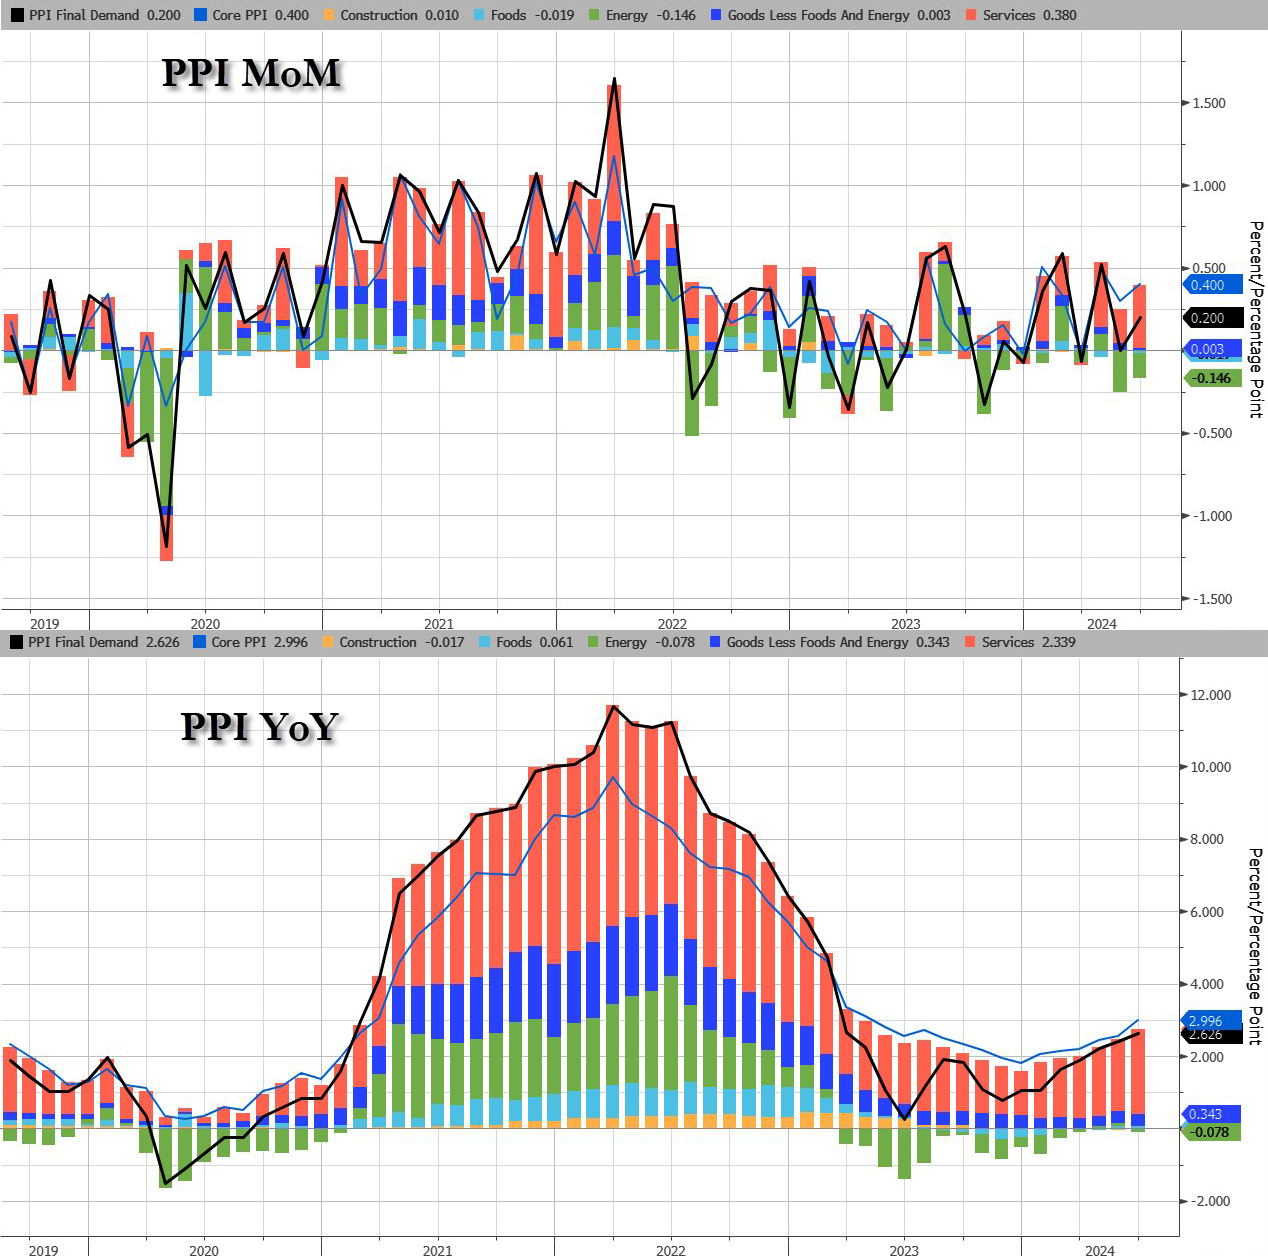
Core PPI rose by 0.4% MoM (double the 0.2% exp), sending the YoY price rise up by 3.0% (also the hottest since March 2023)…
Source: Bloomberg
The jump in PPI was driven by a resurgence in Services costs as Energy remains deflationary (for now)…
Source: Bloomberg
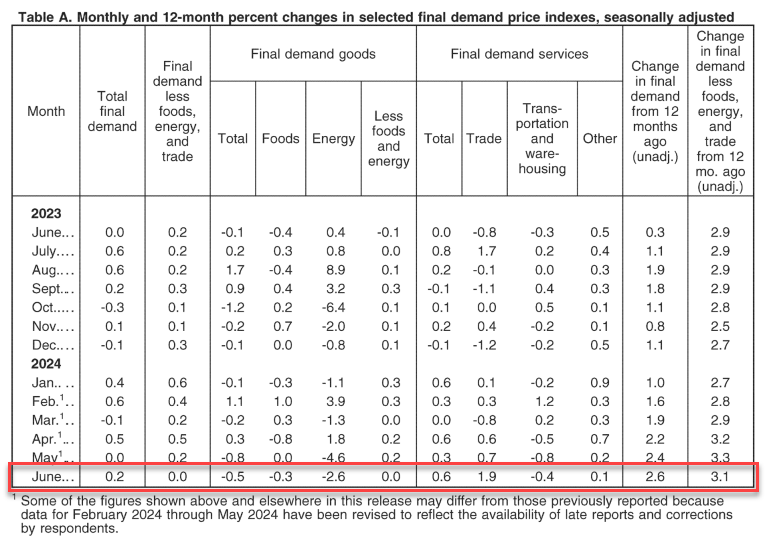
The June rise in the index for final demand can be traced to a 0.6-percent increase in prices for final demand services. In contrast, the index for final demand goods decreased 0.5 percent
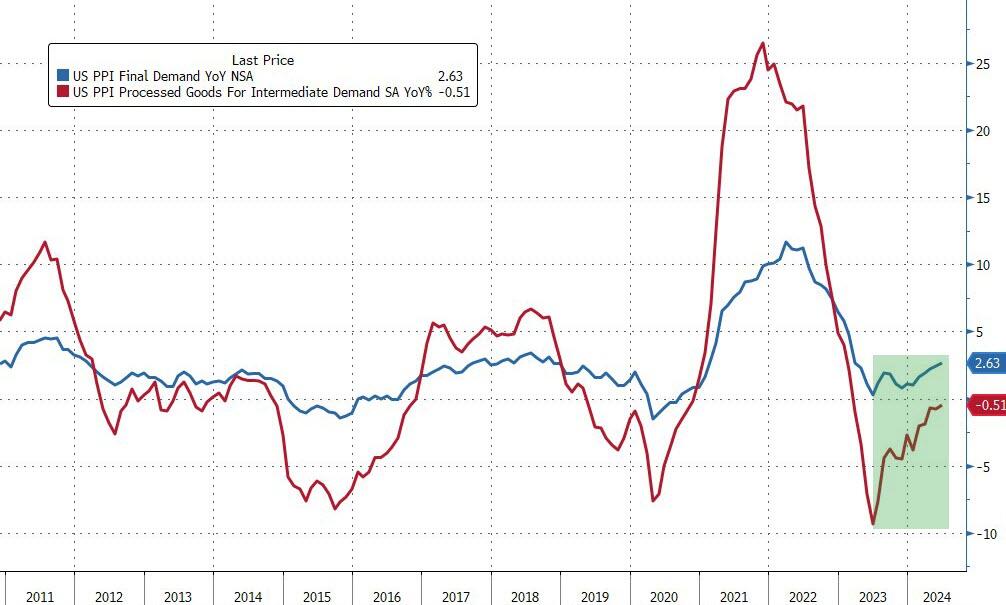
Perhaps worse still, the pipeline for PPI (intermediate demand) is accelerating…
Source: Bloomberg
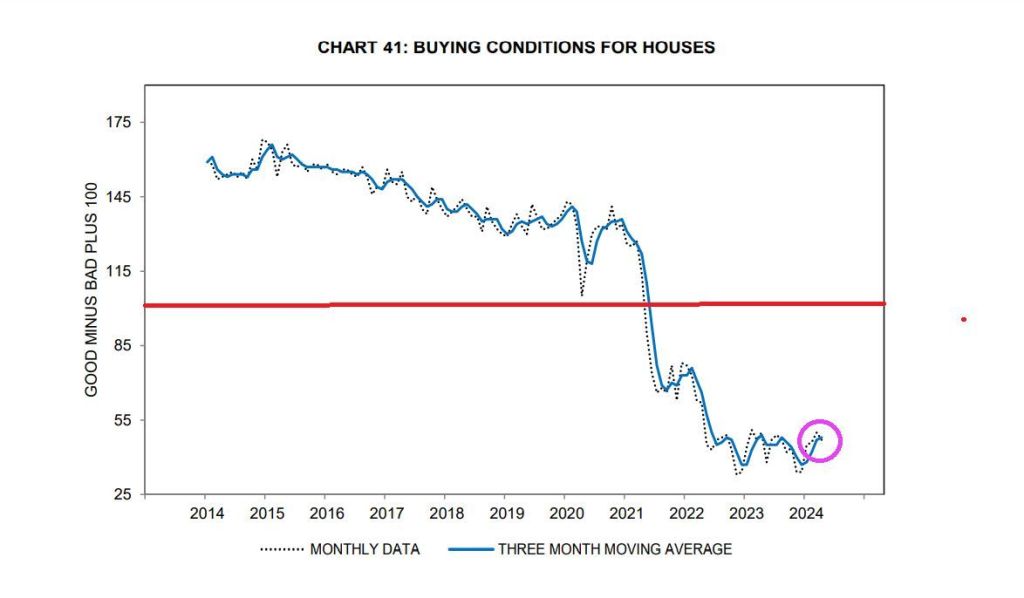
On the housing side, buying conditions for housing tanks to all-time low.
Yes. everyone can see the mental decline in President Biden and he should be in a nursing home. While he vows to run for President against Donald Trump, can you imagine what he will be like in 2 years? Let alone another 4 years??
This estimate is down from 4.2% seen in mid-May and from 2.2% seen on June 28th. If this estimate turns out to be correct it will be the 2nd consecutive quarter of GDP growth below 2.0% after Q1 2024 GDP of 1.4%.
Housing hasn’t slowed across the board … yet. But with mortgage payments as % of income near the highest since the early 1980’s, it will eventually slow down.
There is only one way out. CEASE Bidenomics and the crazy spending and debt and deficits!
MMT is mostly magic! The Federal Reserve relies on “The Power of Magic” to fool people. For example, the massive increase in money printing following Covid and Biden’s disastrous economic policies (or FOLLICIES).
But there is also a fair amount of hypocrisy in the non-Austrian (e.g., mainstream, Keynesian, monetarist) critiques of MMT by mainstream economists. The truth is that most, if not all, of these economists share the same faulty presuppositions regarding what is euphemistically called “monetary policy.” The difference between mainstream and MMT economists is usually one of degree, not of kind.
Alan Greenspan, former Federal Reserve chairman (1987–2006) and most definitely not an MMT proponent, made a very MMT-friendly claim: “The United States can pay any debt it has because it can always print money to do that, so there is zero probability of default.” While this is literally true, and points to the fact that the nominal debt and dollars are not the issue, it overlooks the distortionary consequences from this manipulation on the entire structure of production. Nevertheless, such a claim is often also repeated by proponents of MMT, as if it contains some magic missing ingredient to unlock greater stores of wealth.
In fact, MMT provides a warranted critique to other schools of economic thought that share an underlying premise while not arriving at the same conclusions. That assumption is so-called monetary policy—that governments via a central banking monopoly ought to be the sole entity that issues and controls money as a policy instrument. The dubious justifications for this are that it provides greater economic stability and expansion of money and credit according to the needs of trade. (Both of these are false, theoretically and empirically.) That said, MMT and mainstream economics both share this presupposition, assuming the validity of monetary policy.
As an example of presenting the broad mainstream on the definition of “monetary policy,” the popular financial encyclopedia Investopedia has previously stated the following:
“Monetary policy is a set of tools that a nation’s central bank has available to promote sustainable economic growth by controlling the overall supply of money that is available to the nation’s banks, its consumers, and its businesses. . . . The main weapon at its disposal is the nation’s money (italics added).”
The casual use of the word “weapon” is apt. In the hands of a state monopoly, money can indeed be “weaponized.” Inflation is the artificial expansion of money and credit that has the effect of transferring wealth from all money holders to the inflater(s). This may be done under the guise of “policy”—appearing official, orderly, and legitimate—but it involves elites in power taking actions that would otherwise be criminal behavior (e.g., fraud and counterfeiting).
Even without the ethical-philosophical discussion on whether changing the money supply is fraudulent, economically, the consequences remain. The inflation of money and fiduciary media (artificial credit) causes economic miscalculations and boom-bust cycles, distorts the structure of production, encourages capital consumption, undermines the actions of individuals, discourages saving, transfers wealth from the citizenry to the government and those who are politically connected, affects money’s purchasing power, and has a whole host of other unintended effects. All this, of course, is done under the legal cover of “policy” to achieve “stable economic growth,” as well as ambidextrously maintaining the false dichotomy between full employment and inflation.
Enter MMT, which takes “monetary policy” concepts to their logical conclusions, demonstrating the consequences in a striking way, and mainstream economists quickly want to disassociate themselves from this “crazy” new idea. People may not appreciate some MMTers claiming what they do about inflation, government spending, full employment, and debt; yet politicians and monetary bureaucrats sure seem to act like they believe MMT.
MMT correctly observes that government—through a balance of taxation, deficit spending, inflation, and monetary policy—attempts to centrally control an economy and does, in fact, direct real resources toward its ends. These are common policy tools of the state and central banks. MMT would just like to leverage these tools to a greater extent and direct them toward different ends. Likewise, Investopedia had further clarified:
“The Federal Reserve is in charge of monetary policy in the U.S. The Federal Reserve (Fed) has what is commonly referred to as a dual mandate: to achieve maximum employment while keeping inflation in check.”
Is this above statement not basically a statement of the goals of MMT? Other economic schools of thought that accept the underlying presuppositions of the necessity of monetary policy are not fundamentally in disagreement with MMT on this point; in fact, they are in fundamental agreement. This undermines the ability of these schools to effectively deliver a fundamental critique of MMT rather than just disagreements about how and to what extent monetary policy is to be utilized.
Economic criticism on these points—whether from MMT to the “other side” or from the “other side” to MMT—involves inconsistency. By condemning the other, they condemn themselves because they share core presuppositions. The existence of MMT is effectively a reductio ad absurdum of so-called monetary policy. MMT reasonably asks: What if we did more of the same? Obviously, the degree to which something is done can be critiqued without abandoning the whole thing, but the flawed assumptions are twofold: (1) that there is “just the right amount” of monetary policy and (2) that there are certain enlightened experts who know what it is and only need monopoly over the money supply to achieve it.
Whether MMT or otherwise, proponents of so-called monetary policy essentially believe that money is a policy instrument (or weapon) to be wielded by government elites to rearrange prices, resources, and the structure of production contrary to the demonstrated preferences of millions of individuals. Therefore, the United States has been under a monetary policy regime of “stabilizers” who have argued about how to implement a fundamentally flawed “policy” for over a century.
Whenever this fails and destabilizes the economy, we are treated to critics who blame the free market and deregulation and who want to use monetary policy to “run the economy” differently.
Instead, we ought to abandon the fraud of monetary policy and heed the words of F.A. Hayek concerning the results of monetary policy that led to America’s Great Depression:
“We must not forget that, for the last six or eight years [up to 1932] monetary policy all over the world has followed the advice of the stabilizers. It is high time that their influence, which has already done harm enough, should be overthrown.”
Mortgage rates have actually risen as The Fed has increased M2 Money printng. Like DARK magic.
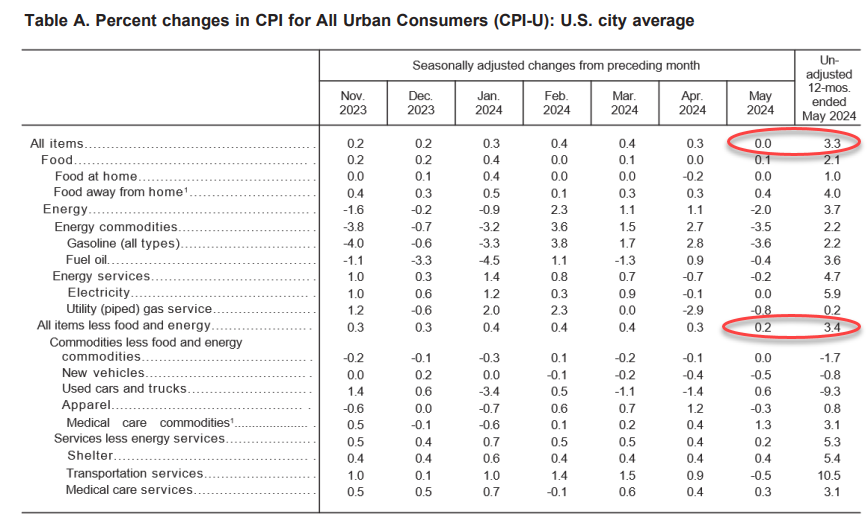
Energy was the biggest drag on the headline CPI MoM…(Gasoline prices tumbled 3.6% in May from April, one key reason why the headline CPI was flat on the month. )
Source: Bloomberg
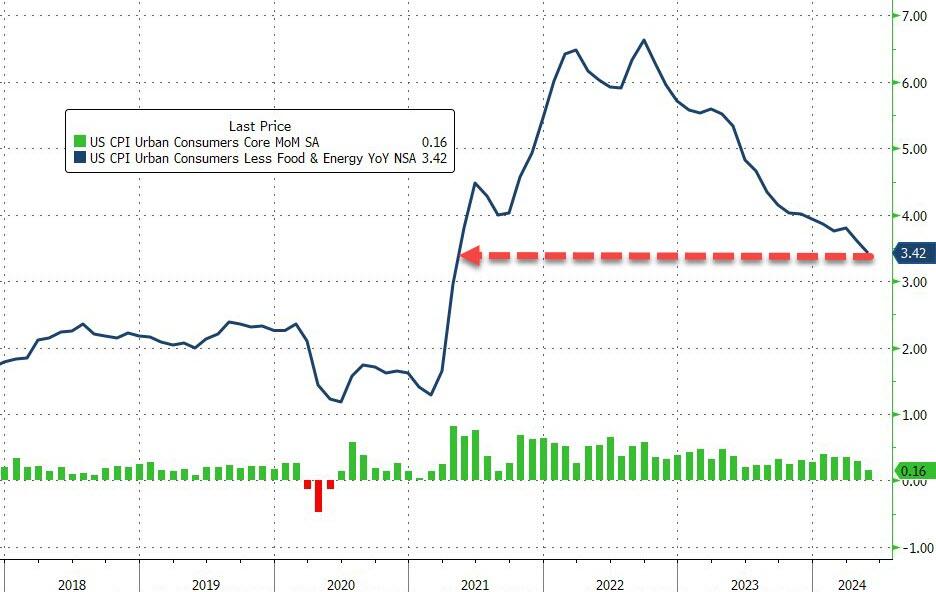
Core CPI rose 0.2% MoM (below the 0.3% exp) pulling the YoY change down to 3.4% (from 3.6% and below the 3.5% exp). That is the lowest Core CPI YoY since April 2021…
Source: Bloomberg
Core CPI has not had a down-month since President Biden was elected.
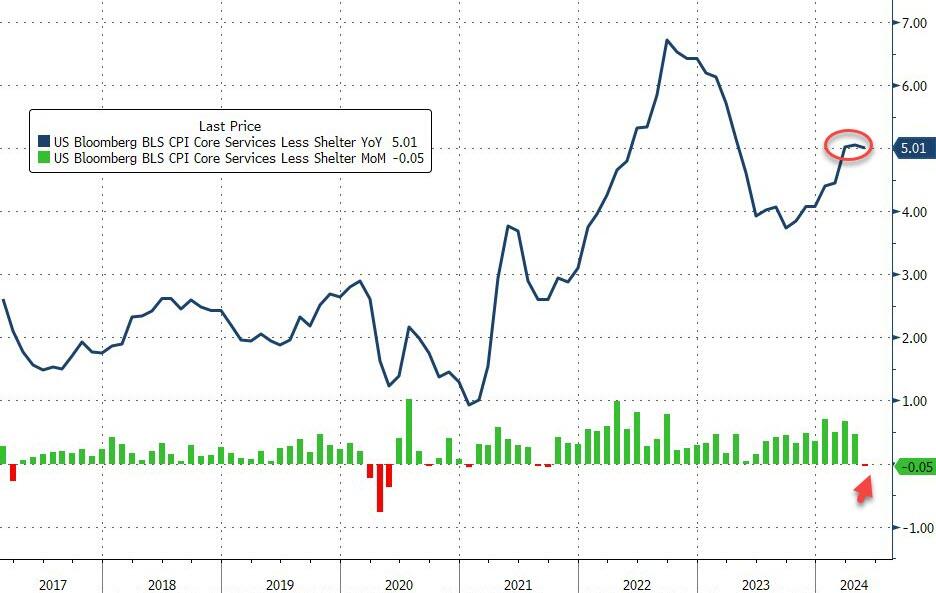
Core Services inflation slowed notably MoM…
Source: Bloomberg
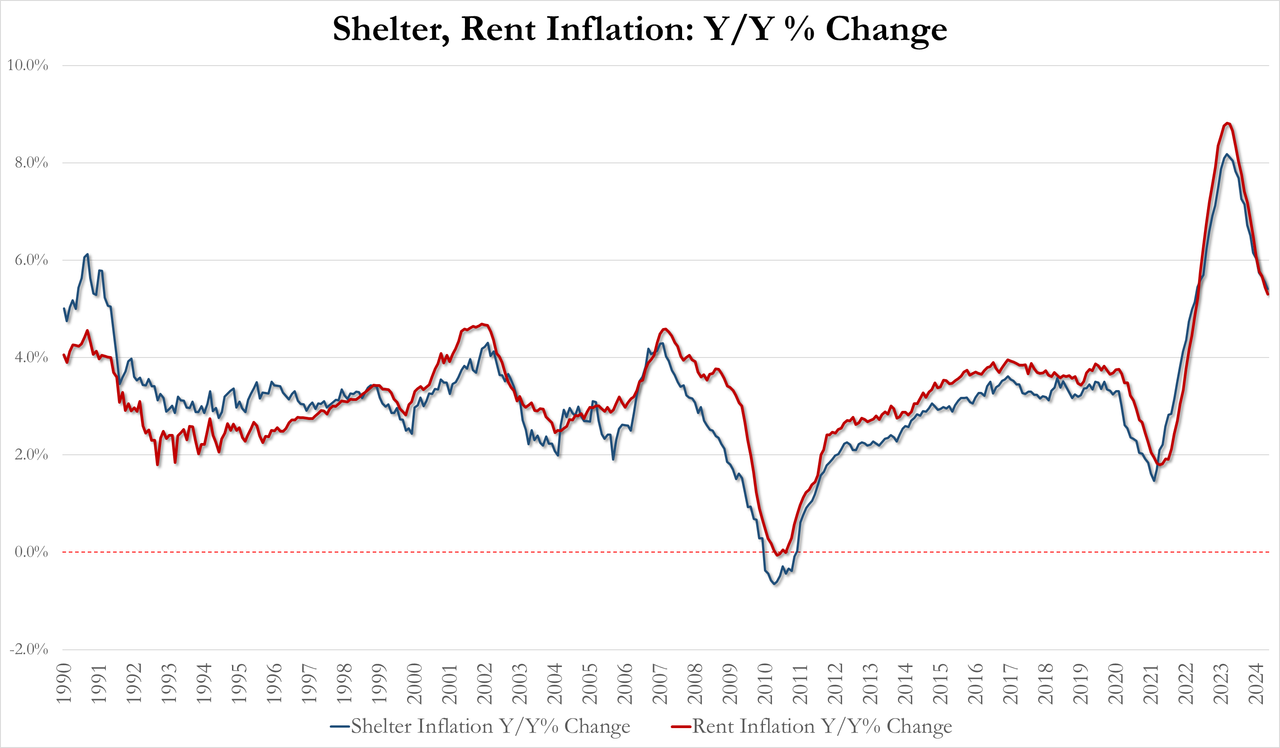
The shelter index increased 0.4 percent in May and was the largest factor in the monthly increase in the index for all items less food and energy.
May Shelter inflation 5.41% YoY, down from 5.55% in April and lowest since April 2022
May Rent inflation 5.30% YoY, down from 5.44% and lowest since May 2022
For context on how important housing costs are to US inflation data, the shelter index rose 5.4% over the last year, making up over two thirds of the total 12-month increase in the all items less food and energy index.
Source: Bloomberg
It does make one wonder were exactly the BLS is getting their BS OER data from…
The full breakdown…
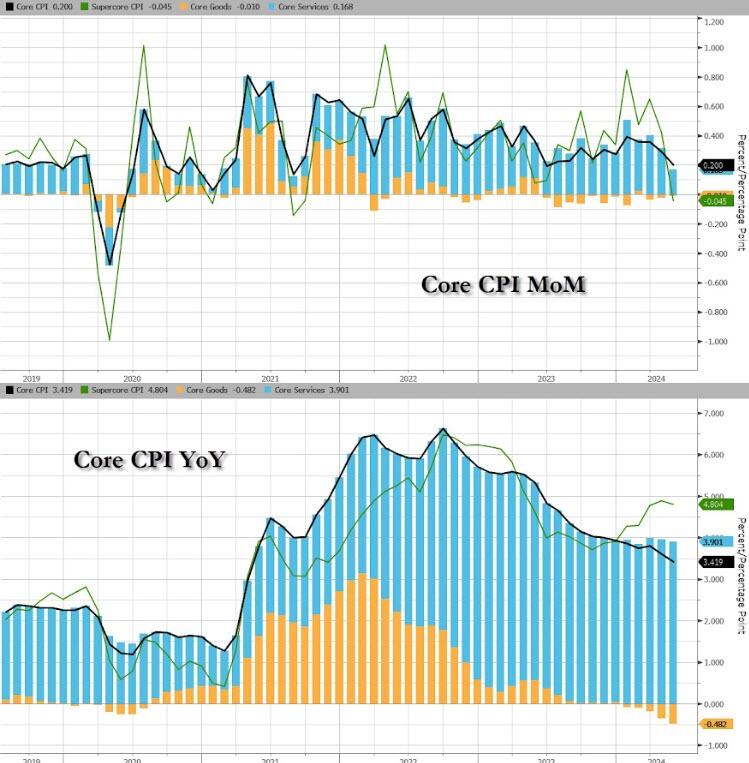
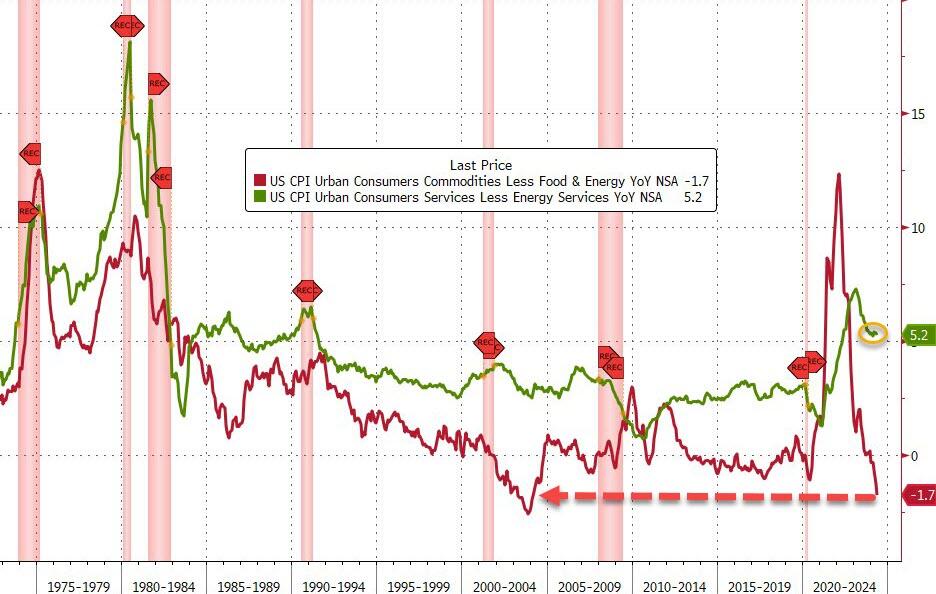
Services INflation remains awkwardly stuck above 5% while Goods DEflation is at its weakest since January 2004…
Source: Bloomberg
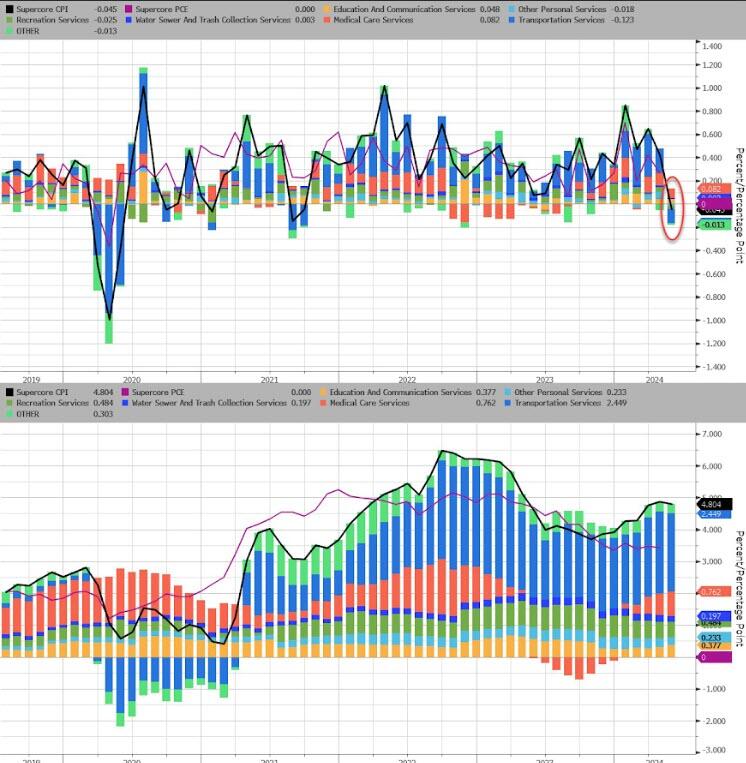
SuperCore CPI fell 0.05% MoM – its first drop since Sept 2021, but that left the YoY level still above 5.0%…
Source: Bloomberg
Transportation Services costs tumbled MoM to drag SuperCore lower MoM…
Source: Bloomberg
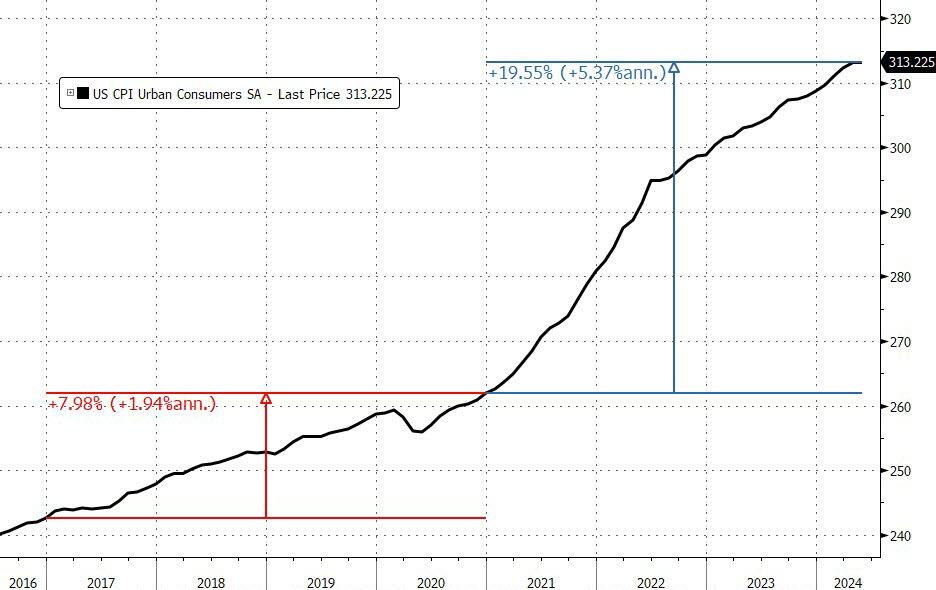
We note that consumer prices have not fallen in a single month since President Biden’s term began (July 2022 and May 2024 was the closest with ‘unchanged’), which leaves overall prices up over 19.5% since Bidenomics was unleashed (compares with +8% during Trump’s term).
And prices have never been more expensive…
That is an average of 5.4% per annum (almost triple the 1.9% average per annum rise in price during President Trump’s term).
Source: Bloomberg
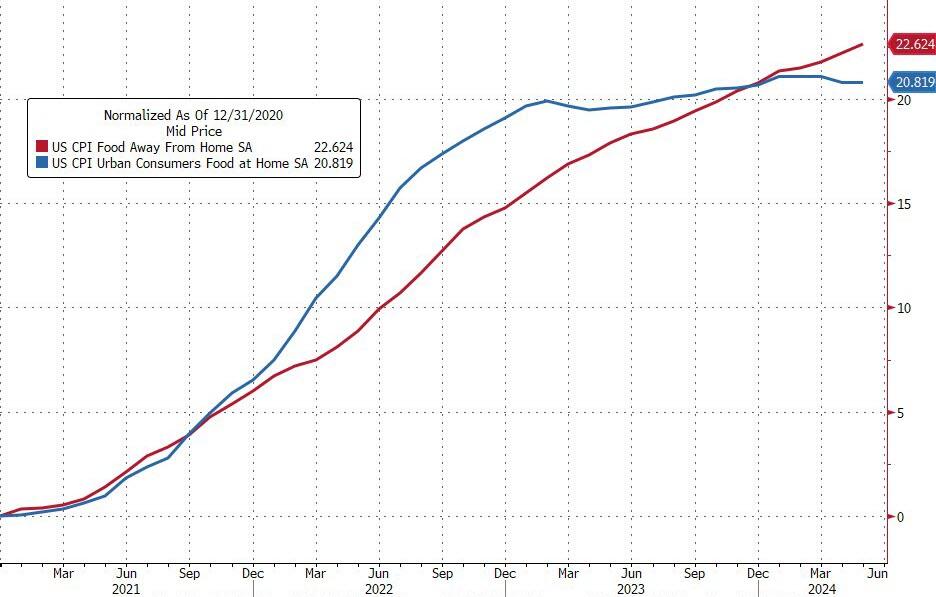
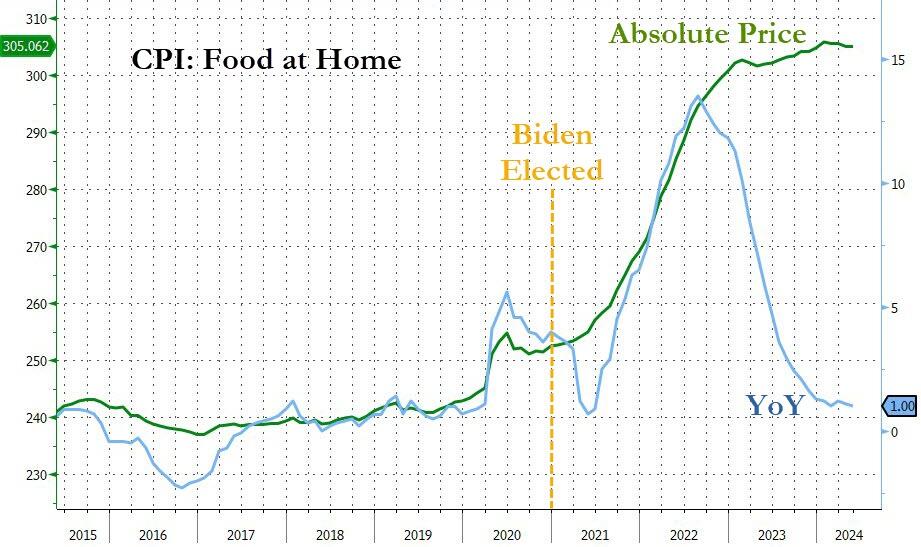
Since President Biden was elected, food prices at home are up around 21% and food prices away from home are up almost 23%…
And while the Biden administration will continue to gaslight voters with comments like “inflation is tumbling”… every man, woman, and child who actually buys food knows prices have NEVER been higher…
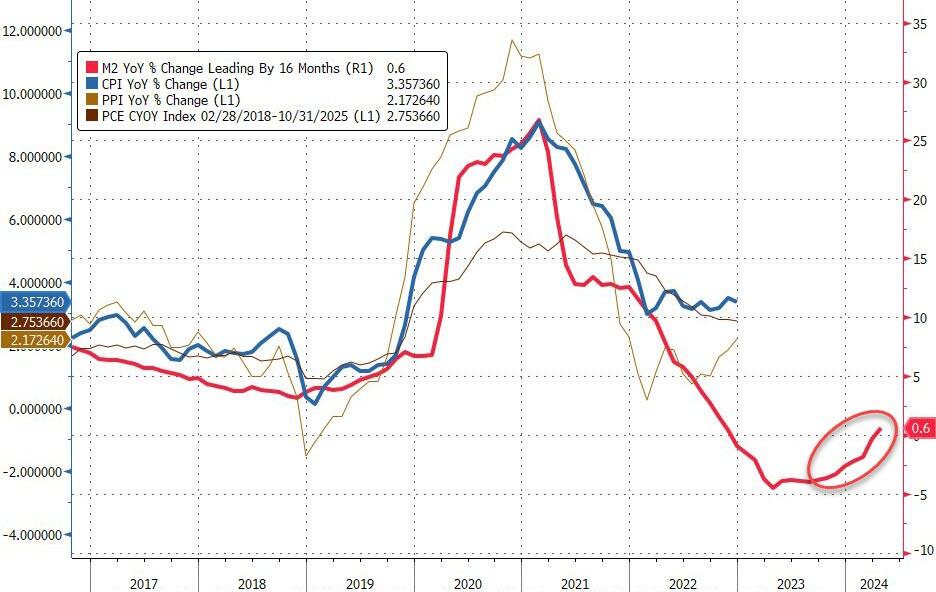
Finally, while the ‘flations’ have broadly tracked M2 lower, we note that M2 YoY is now starting to turn back higher once again…
Source: Bloomberg
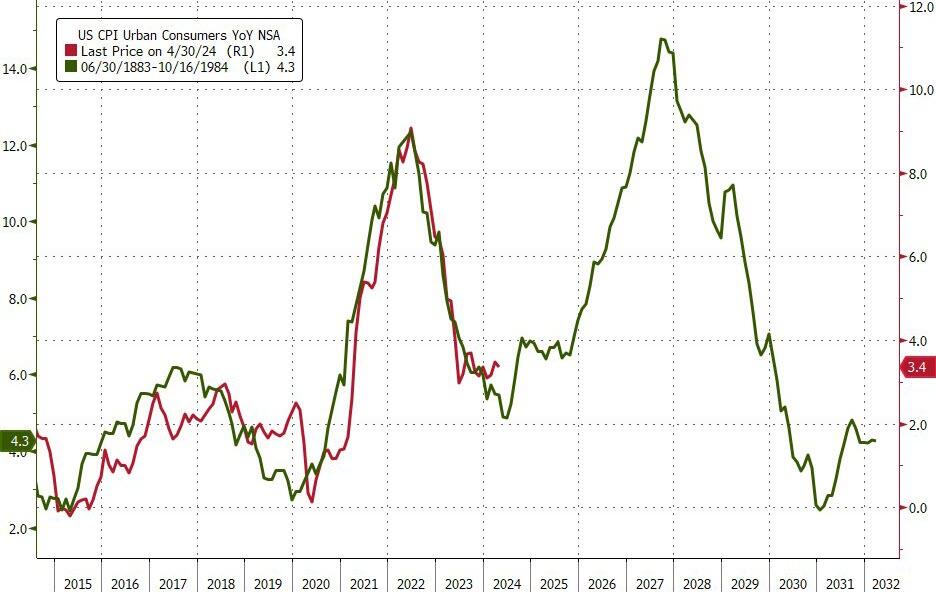
Will the next President and Fed head face a 70s redux?
Source: Bloomberg
And is this guaranteed if Powell decides “insurance” cuts are required (for Biden?)
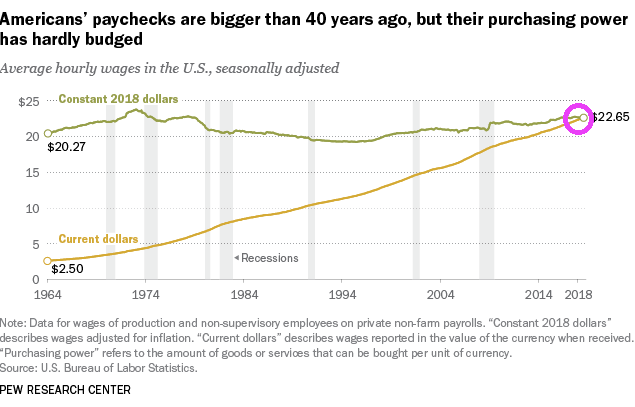
To begin with, America’s paychecks are bigger than 40 years ago, but purchasing power of those larger paychecks is about the sames as it was 40 years ago. Great job Washington DC!!! … NOT!!!!
Meanwhile, credit card delinquencies are at the highest level since 1991.
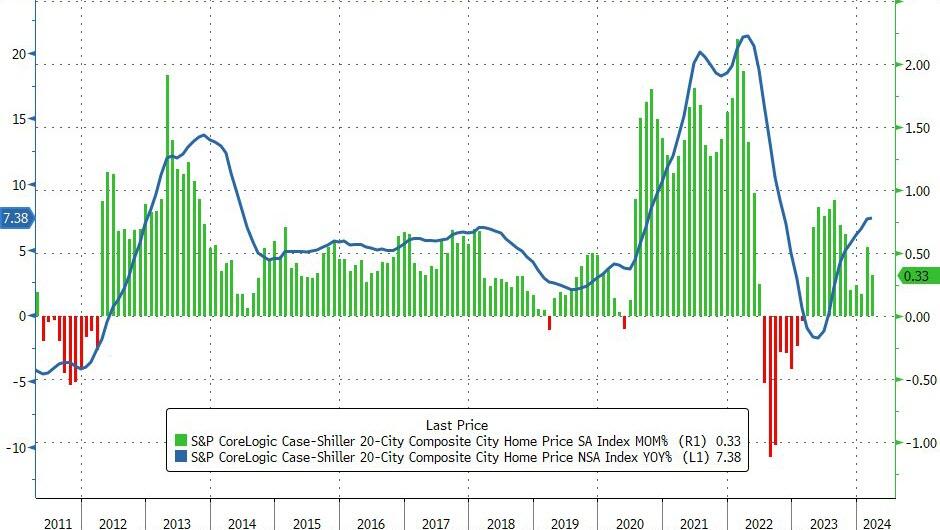
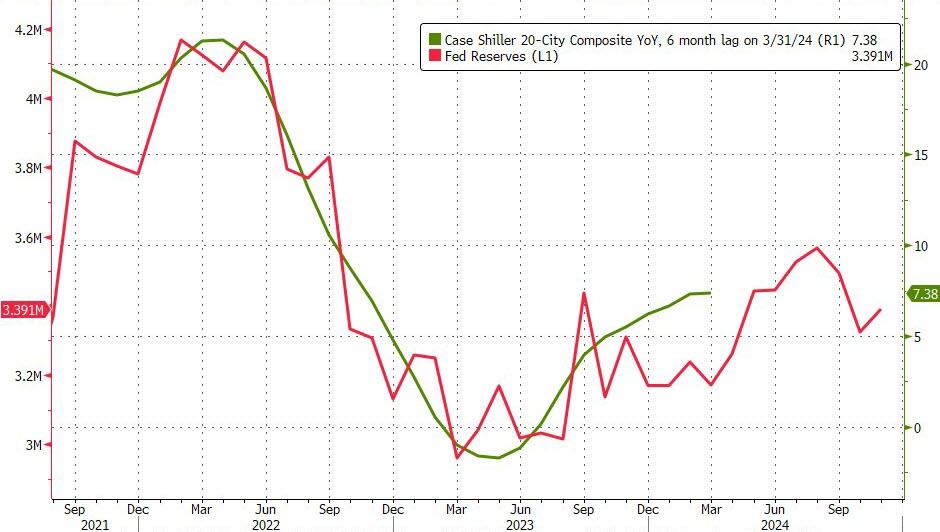
This pushed the price up 7.38% YoY – the fastest rise since October 2022…
“We’ve witnessed records repeatedly break in both stock and housing markets over the past year. Our National Index has reached new highs in six of the last 12 months.” says Brian D. Luke, Head of Commodities, Real & Digital Assets at S&P Dow Jones Indices.
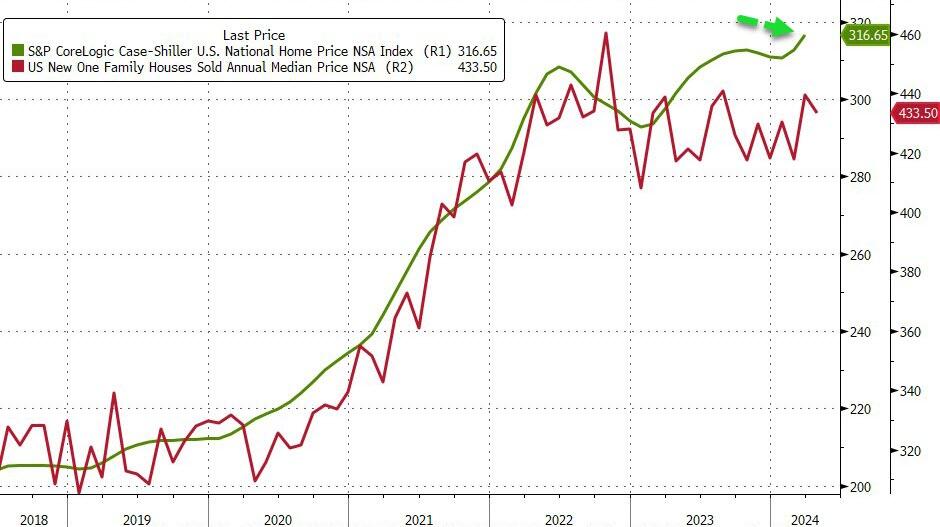
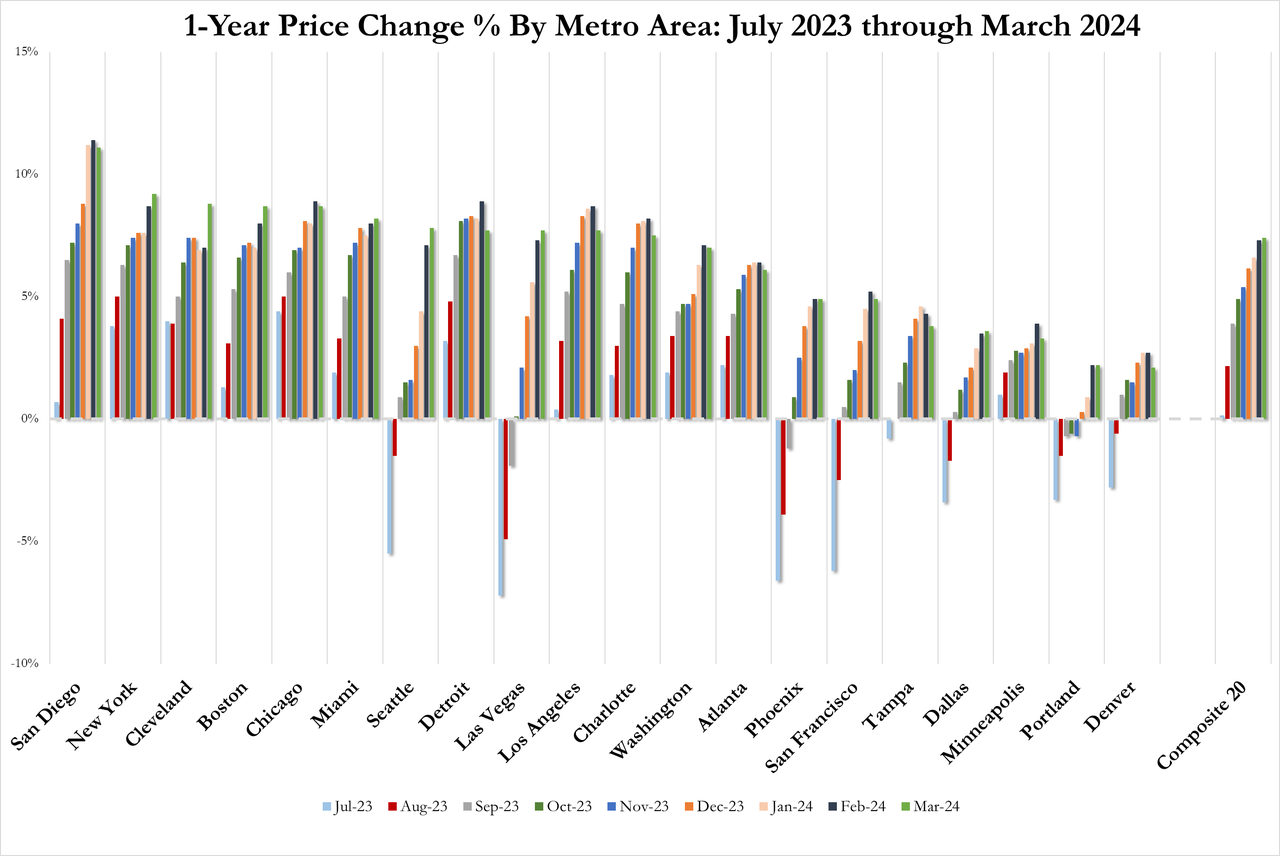
Overall, US home prices reached a new record high in March (as median new home prices began to fall)…
Source: Bloomberg
San Diego continued to report the highest year-over-year gain among the 20 cities this month with an 11.1% increase in March, followed by New York and Cleveland, with increases of 9.2% and 8.8%, respectively.
Portland, which still holds the lowest rank after reporting three consecutive months of the smallest year-over-year growth, posted the same 2.2% annual increase in March as the previous month.
Luke suggested this implies “a strong demand for urban markets.”
No city has seen a MoM decline in price in 2024.
Home prices continue to track Fed Reserves closely, but a turning point may come soon…
Source: Bloomberg
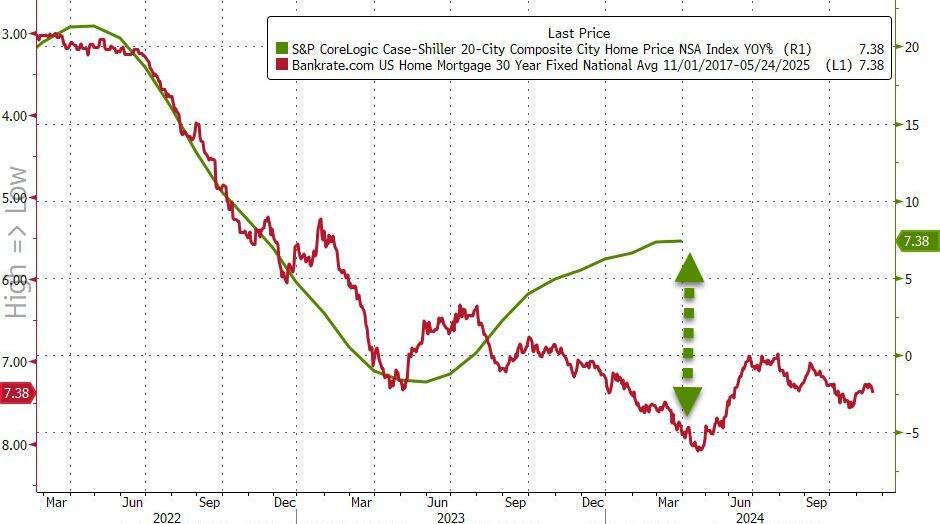
Given the smoothing and heavy lag in the Case-Shiller data, it’s hard to find a causal relationship between prices and mortgage rates…
Source: Bloomberg
…but with rates remaining above 7%, it seems hard to believe prices can continue their advance.
Who the heck is HUD Secretary? It was Cleveland’s Marcia Fudge (a typical Biden political appointment). Now it is Adrianne Todman, from the US Virgin Islands and former executive director of the District of Columbia Housing Authority. Not exactly a high-powered resume for a cabinet post, Joe!
I saw former President Obama criticizing former President Trump for not passing “transformative” changes. That is, Trump didn’t sign any Obama-like transformative changes (like Obamacare). Truimp did try to slow down the damage done by Obama and his transformative agenda (e.g., open borders, wealth redistritution, green energy) that Biden has attempted to continue.
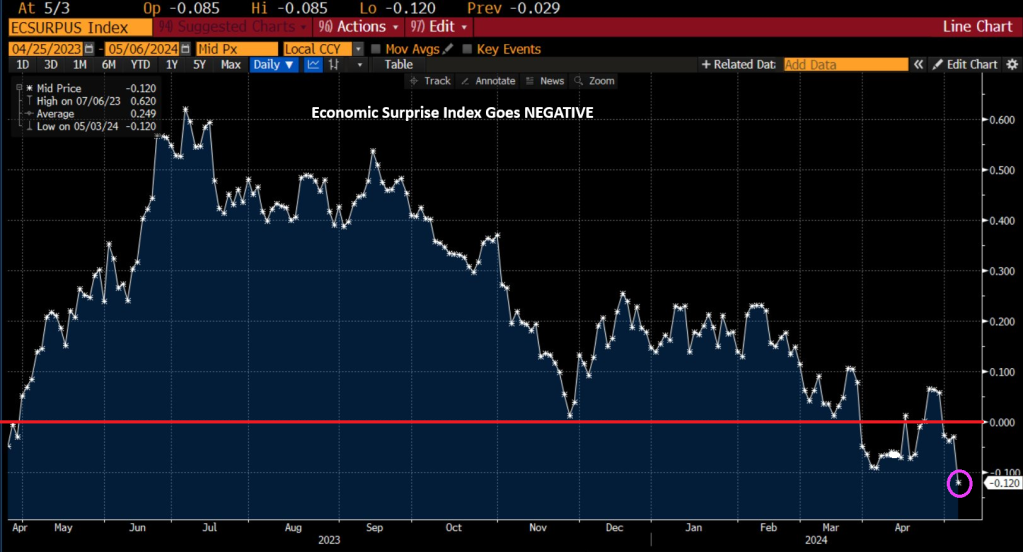
As we approach the party conventions and Presidential election of 2024, we saw the Economic Surprise Index (ESI) in May decline to -0.126.
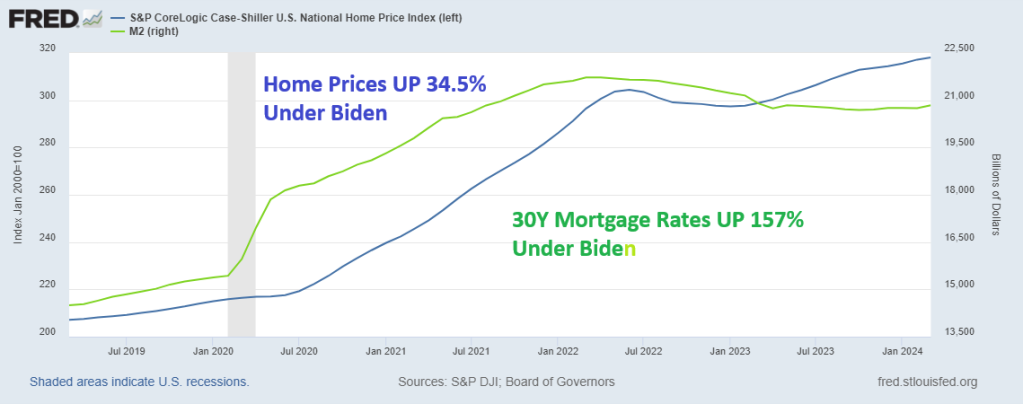
Coupled with Biden’s negative buying conditions for housing (higher mortgage rates and soaring house prices), Obama’s Jacobian transformative economic fantasty is on thin ice.
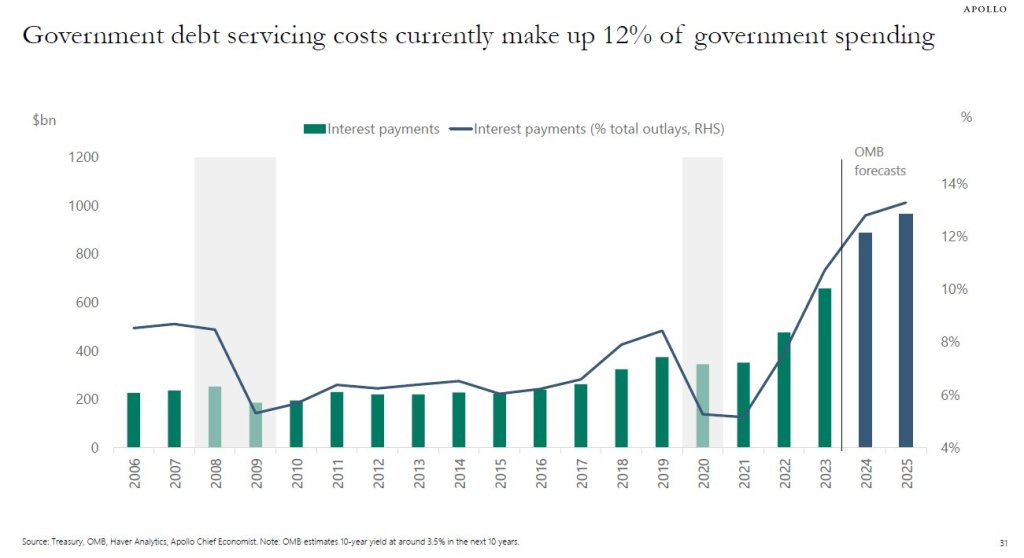
Speaking of higher interest rates, US debt servicing costs currently make up 12% of government spending. Jacobin revolution = Cloward-Piven.
Let’s hope the Obama/Biden Jacobin revolution doesn’t get to this point!
One year after regional banks crashed and burned due to the combination of tumbling debt/treasury prices coupled with cratering commercial real estate loans, fears about the current state of Commercial Real Estate – where most offices still see tenants at best 3 to 4 days a week and are literally burning through rents – appear long forgotten. Is that sensible?
For one answer, we turned to the latest report from Goldman’s REIT/CRE expert Chandhi Luthra who has published a visual assessment of the state of CRE in 2024 in terms of loan maturities, 2023 extensions, and property and lender groups. She also looks at the latest transaction and leasing volumes, and shares several key takeaways.
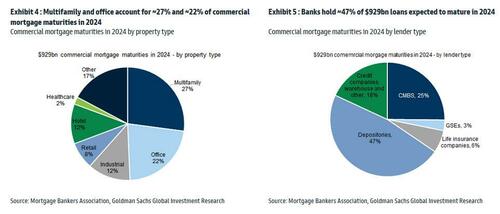
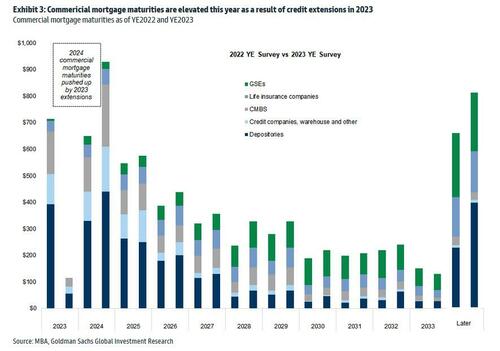
There are ~$4.7tn of outstanding commercial/multifamily mortgages outstanding, according to the Mortgage Bankers Association’s 2023 Commercial Real Estate Survey of Loan Maturity Volumes.
More specifically in 2024, $929bn of CRE mortgages are expected to mature, ~20% of ~$4.7tn total commercial mortgages outstanding. In terms of property type, multifamily and office account for ~27% and ~22% of commercial mortgage maturities in 2024 respectively. In terms of lender type, banks hold ~47% of debt maturing in 2024, followed by CMBS at ~25%.
It is worth noting that 2024 commercial mortgage maturities are pushed up by 2023 extensions. As shown in Exhibit 3, among the CRE loans scheduled to mature in 2023, ~$610bn were refinanced, with ~$300bn pushed into 2024 and the remainder into future years. As a result, the total CRE refinancing volume is expected to be ~$929bn in 2024.
Of course, it does not end there, and since there has been no fundamental improvement, it is certain that extension volumes in 2024 will be high as well. However, as interest rates are expected to come down, demand for refinancing in 2024 may outpace that in 2023 according to the Goldman analyst (rates are still far, far higher than where they were when most of the loans were originated several years ago). At the same time, for loans that have already been extended in the past, it is also likely that future extensions could be harder.
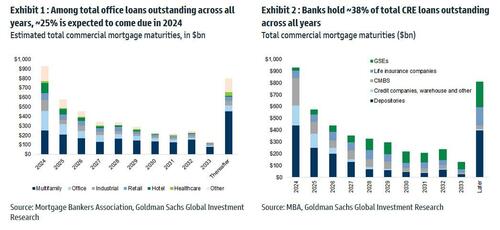
Among the loans backed by office properties overall, ~25% is expected to come due in 2024. In terms of lender type, banks (primarily small, regional banks) hold ~38% of total CRE loan outstanding across all years, followed by the GSEs at 20%.
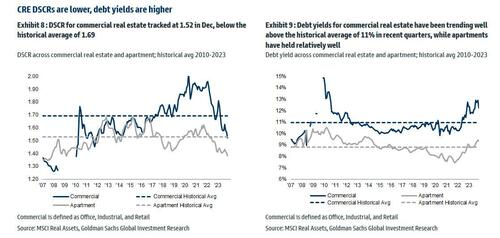
Looking at different debt metrics, DSCR for commercial real estate (office, industrial and retail combined) tracked at 1.52 in Dec, below the historical average of 1.69; debt yields for commercial real estate have been trending well above the historical average of ~11% in recent quarters, while apartments have held relatively well.
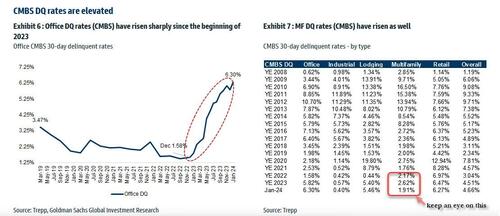
Office CMBS DQs have risen significantly, with Jan tracking at 6.3%, up significantly from 1.58% in Dec 2022. And while everyone knows the Office canary in the coalmine is dead and buried, keep an eye on Multifamily CMBS DQs which tracked at 1.91% vs 2.62% in December, with the sequential decline associated with a large San Francisco apartment loan that was recently disposed. The overall DQ rate tracked at 4.66% in January.
The Goldman strategist concludes with a word about CRE transaction and leasing: U.S. CRE transaction market continues to be muted, primarily driven by elevated interest rates, limited sources of capital, and the pricing gap between buyers and sellers. January volume was down -11% yoy, driven by easier compares in Jan 2023 (down -55%). In terms of leasing, Jan preliminary trends indicate weakness in activities, with office down -25% yoy and industrial down -28% yoy.
Here, Goldman trader Sara Cha chimes in (her report is also available to pro subs) and notes that we can see from the transaction data “why sentiment in CRE brokers is a bit more mixed of late – thought yesterday’s JLL print had mixed reception – while you’ve seen some signs of life in capital markets space broadly to start the year, not seeing that as much on the CRE front (remember those 3Q-4Q greenshoots?).“
Multifamily CRE
The commercial real estate sector continues to experience elevated stress . The latest crack to emerge is the increasing number of delinquencies on multifamily mortgages.
In April, about 8.6% of commercial real estate loans bundled into collateralized loan obligations were distressed, reaching the record high set in January, according to Bloomberg, citing new data from analytics firm CRED iQ.
The loans bundled into CRE CLOs were merged with funds from individual investors to acquire multifamily housing during the Covid era. After that, borrowing rates surged, catching many off guard. A significant portion of the deteriorating loans had floating-rate interest rates, putting massive pressure on landlords’ cash flows, diminishing the market worth of the properties, and obliterating equity in a large number of investments.
According to data provider Trepp, $78.5 billion of CRE CLO loans are outstanding. This means many CRE CLO issuers are racing to find ways to prevent a tsunami of bad loans from defaulting or risk losing the fees they collect on the securities.
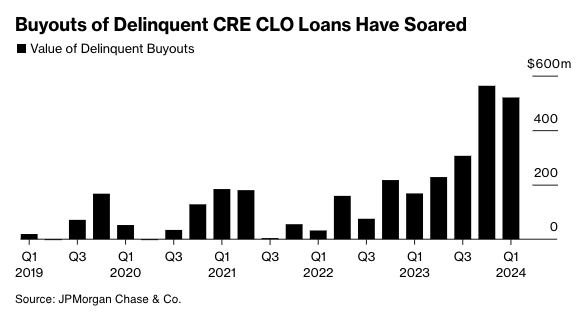
Recent estimates from JPMorgan show lenders purchased $520 million of delinquent loans in the first quarter of this year. Lenders have been ramping up the number of buyouts over the last four quarters because of mounting bad loans in a period of elevated rates.
Source: Bloomberg
JPMorgan strategist Chong Sin said he’s surprised by lenders’ ability to obtain warehouse lines to purchase bad debt, given tightening credit conditions.
“The reason these managers are engaged in buyouts is to limit delinquencies,” Sin said, adding, “The wild card here is, how long will financing costs remain low enough for them to do that?”
Anuj Jain, an analyst at Barclays Plc, expects buyouts to continue as distress increases across the CRE CLO space.
“If the outlook for the Fed shifts materially to hikes or no rate cuts for a while, that might lead to a sharp increase in delinquencies, which can stifle issuers’ ability to buy out loans,” Jain said.
Bloomberg explains much of the CLO space derives from multifamily bridge loans originated around 2021-2022:
CRE CLO issuance surged to $45 billion in 2021, a 137% increase from two years earlier, when buyers of apartment blocks sought to profit from the wave of workers moving to the Sun Belt from big cities. Three-year loans would give them time to complete upgrades and refinance, the thinking went.
Fast forward to today and the debt underpinning many of the bonds is coming due for repayment at a time when there’s less appetite for real estate lending, insurance costs have skyrocketed and monetary policy remains tight. Hedges against borrowing cost increases are also expiring and cost significantly more to purchase now.
Those blows helped increase multifamily assets classed as distressed to almost $10 billion at the end of March, a 33% rise since the end of September, according to data compiled by MSCI Real Assets.
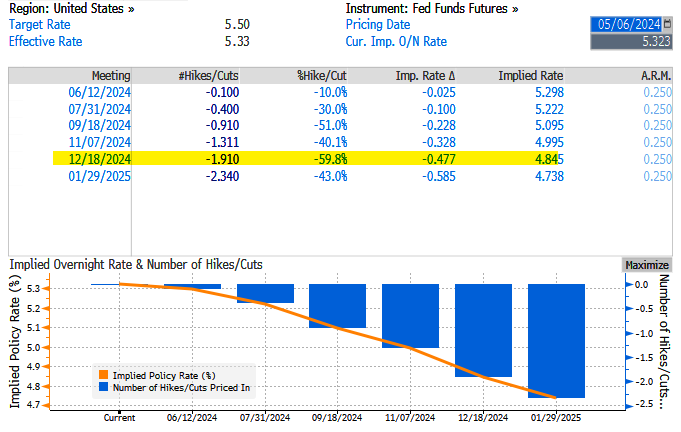
Last Wednesday, the Fed left interest rates unchanged at around 550bps as inflation data reaccelerates and economic growth tilts to the downside, stoking stagflation fears.
Fed swaps are pricing in just under two cuts – this is down from nearly seven earlier this year and about 1.14 before last week’s FOMC.
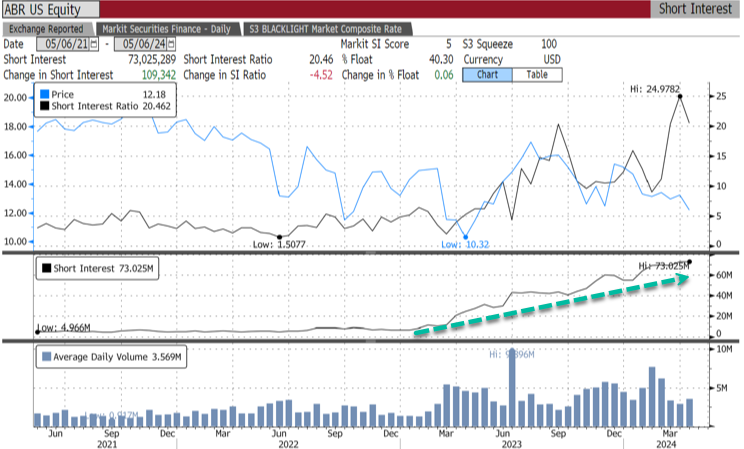
Meanwhile, bears are piling in on CRE CLO issuer Arbor Realty Trust Inc., with 40.3% of the float short, equivalent to 73 million shares short.
“The multifamily CRE CLO market was not prepared for rate volatility,” said Fraser Perring, the founder of Viceroy Research, which has placed bear bets against Arbor, adding, “The result is significant distress.”
The longer the Fed delays rate cuts, the worse the CRE mess will get.


You must be logged in to post a comment.