I admit, I follow market data to get a signal of what is happening to mortgage rates and I got one. With Putin and Russia invading Ukraine, markets are in turmoil
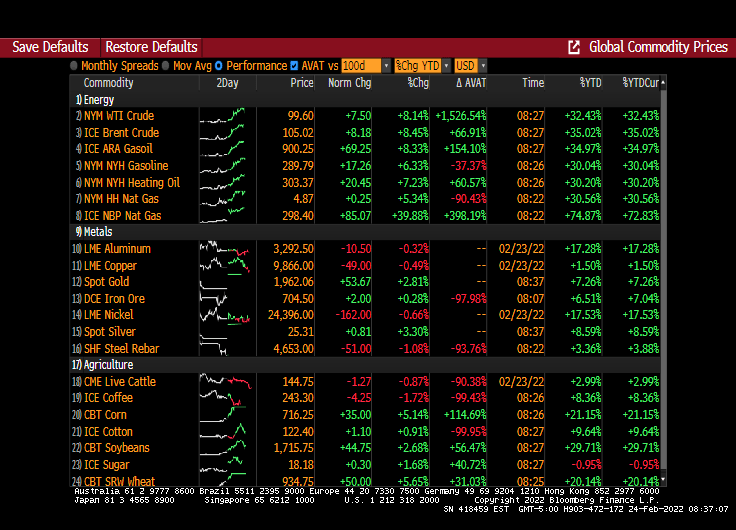
WTI Crude is up 8.14% this morning, Brent Crude is up 8.45% and NBP (UK) Natural gas is up 40%.
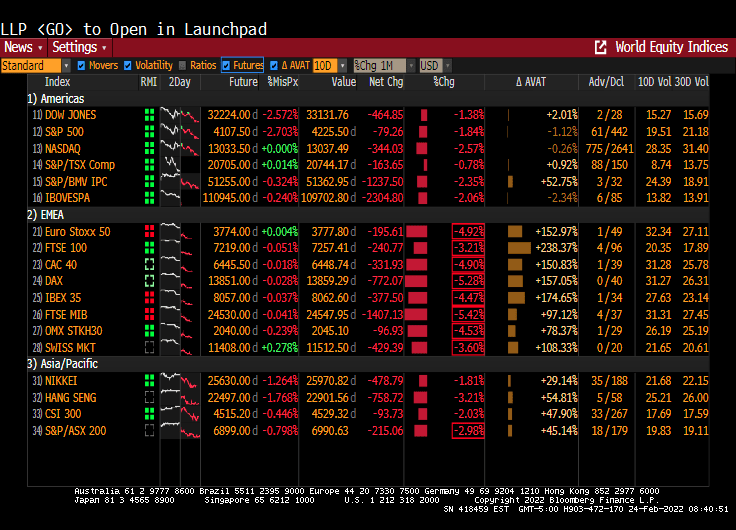
Europe is having a bad day equity market-wise. Eurostoxx 50 was down 4.92%. The US Dow is braced for a 2.5% opening.
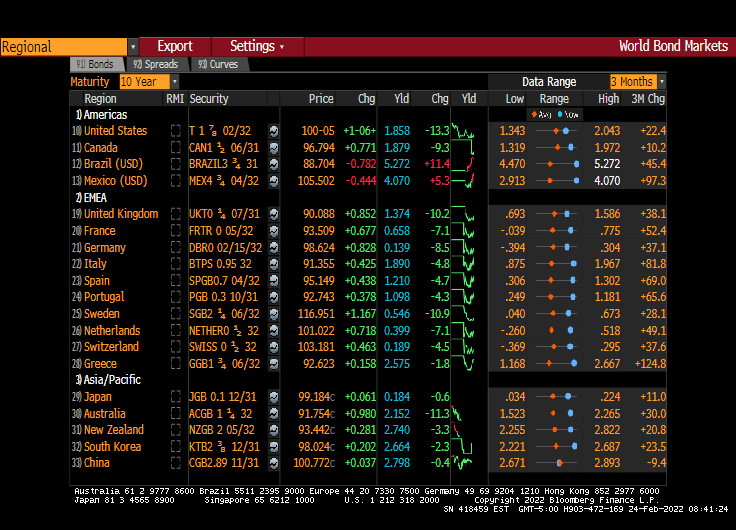
Now to bonds. The 10-year Treasury yield is down 13.3 bps this morning. Sweden and UK are down 10 bps as well.
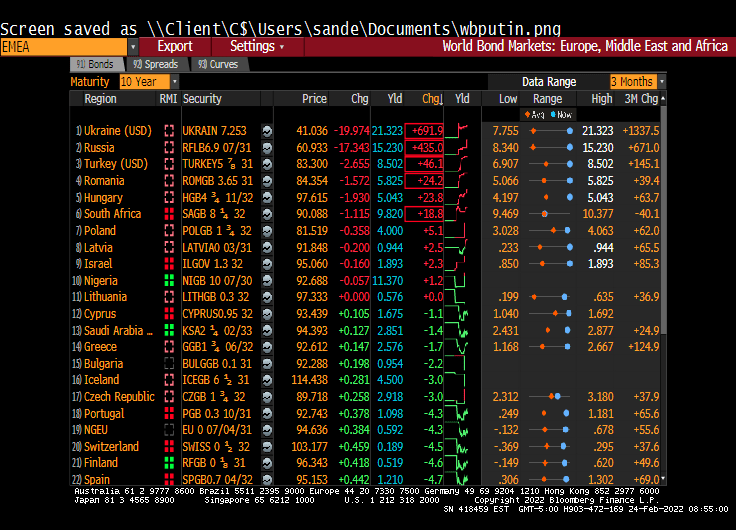
How about the new Russian front? Ukraine’s 10y yield rose 691.0 bps while Russia’s 10Y yield rose 435 bps.
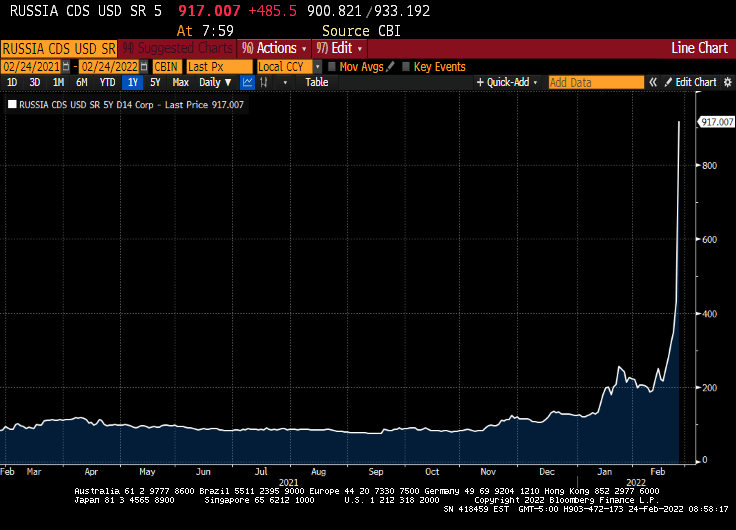
Russian 5Y Credit Default Swaps (CDS) leaped to a Greek-like 917.
Well, it looks like the sanctions imposed by Winken (US VP Harris), Blinken (US Secretary of State) and Nod (US President Biden because he always looks half-asleep) apparently didn’t work as intended.
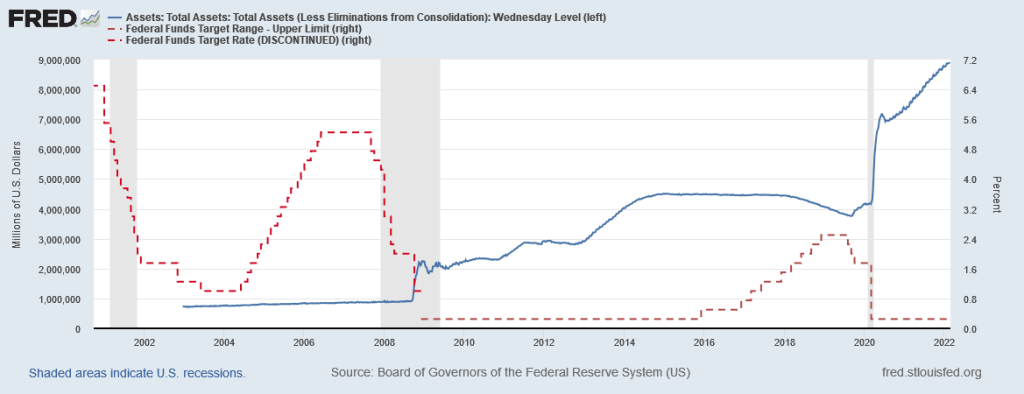
It has been almost 14 years since The Federal Reserve under Ben Bernanke unleashed zero interest rate policies (ZIRP) and quantitative easing (QE) in late 2008. And Fed monetary stimulypto is still running strong after almost 14 year of monetary mismanagement and asset bubble stimulation.
The Federal Reserve under Bernanke and Yellen raised their target rate exactly once under President Obama before the election of Donald Trump. After Trump was elected, The Fed raised their target rate 8 times, lowered it 5 times. There have been no rate hikes under Biden.
There seemingly never-ending Fed monetary stimulus has resulted in the top 1% seeing their share of total net worth soar relative to the share of net worth of the bottom 50%. But note that starting in 2014 just as The Fed was engaged in QE 3. But the real divergence occurred after The Federal government heaped trillions in fiscal stimulus on top of the skyrocketing monetary stimulus.
In terms of income inequality (as measured by the GINI coefficient), it just keeps getting worse and worse.
Let’s see if The Fed actually delivers by reducing their monetary stimulypto.
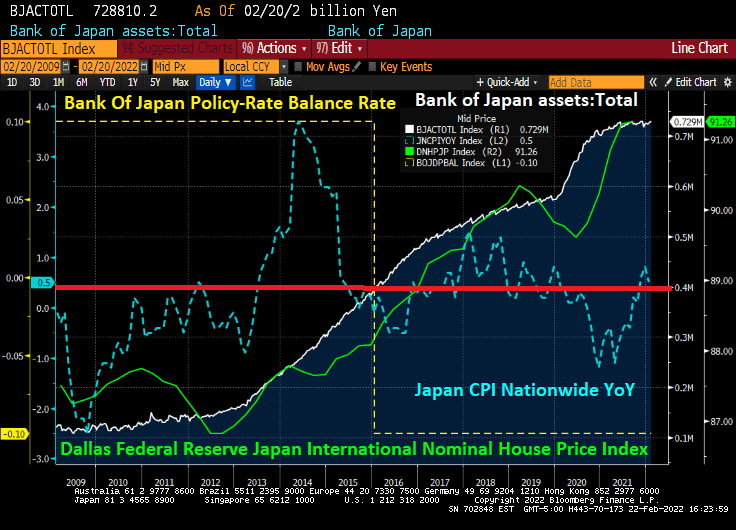
It’s taken nine years and the Bank of Japan supersizing its balance sheet to the $5 trillion mark, but Asia’s second-biggest economy finally has some inflation.
Officials in Tokyo are realizing the hard way, though, that it’s best to be careful what you wish for as bond yields spike.
Granted, the gains in consumer prices Japan is reporting are negligible compared to those in the U.S. and China. And inflation is still a good distance from the BOJ’s 2% target. Still, the 0.5% rise in consumer prices in January year-on-year is already unnerving the bond market. It followed a 0.8% jump in December and marks the fifth straight month of increases.
The worry is that Japan’s inflationis the “bad” kind. Haruhiko Kuroda was hired as BOJ governor in March 2013 to end deflation. Kuroda unleashed tidal waves of liquidity. That drove the yen down 30%, generated record corporate profits and sent Nikkei 225 Average stocks to 31-year highs.
Despite a staggering balance sheet with a -0.10 bps policy rate, Japan has only 0.5% inflation.
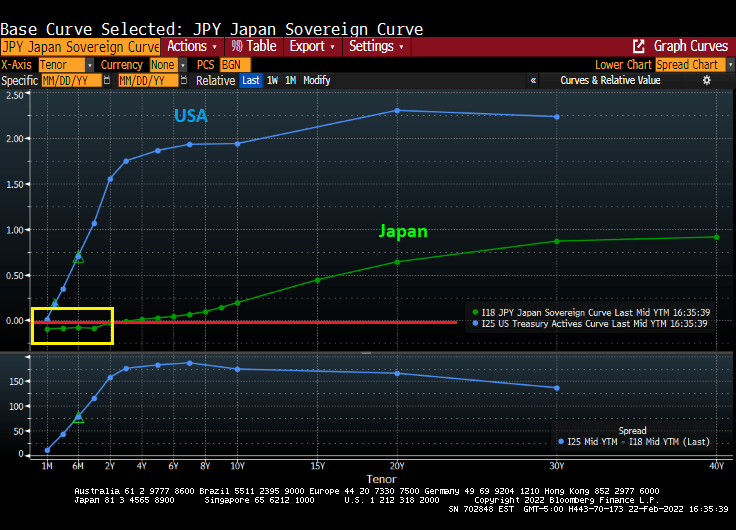
And Japan’s yield curve is negative at 3 year tenor and less.
How is it that Japan has virtually no inflation with negative rates but the USA has 7.5% inflation with a 0.25% target rate? Could it be the USA undertook massive fiscal spending related to COVID and reduced energy sources in an effort to go “green” that led to 7.5% inflation??
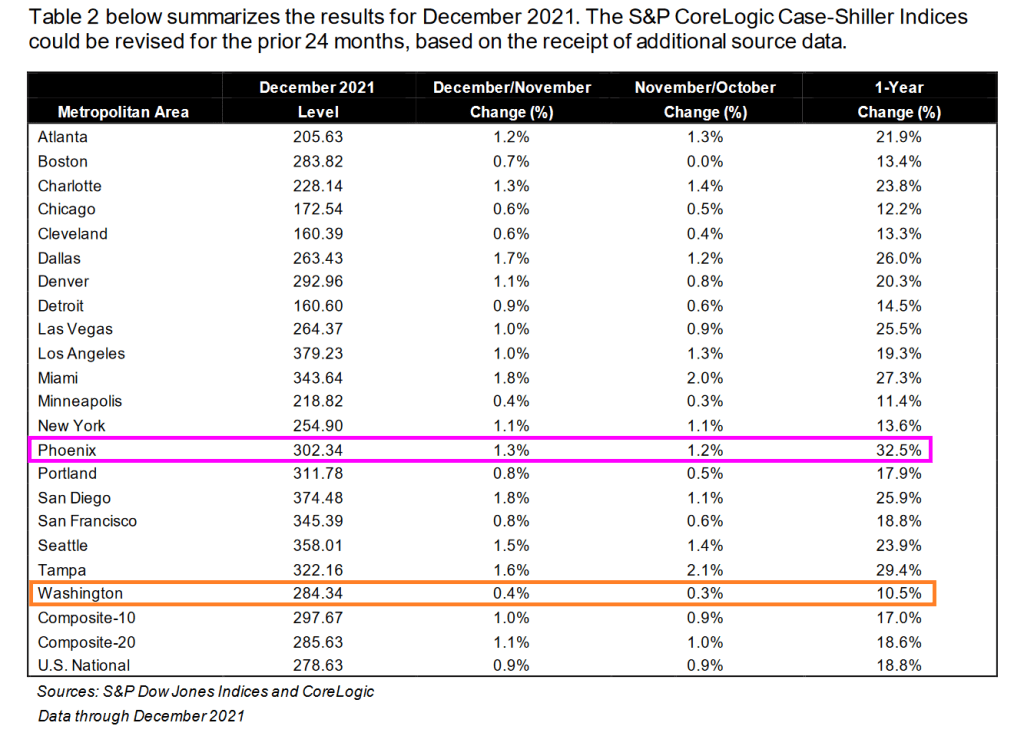
All 20 metro areas in the Case-Shiller 20 index grew at 10% or higher YoY with my former home city Phoenix leading the way at 32.5% YoY house price growth. Washington DC, aka Mordor on The Potomac, was in last place at 10.5% YoY.
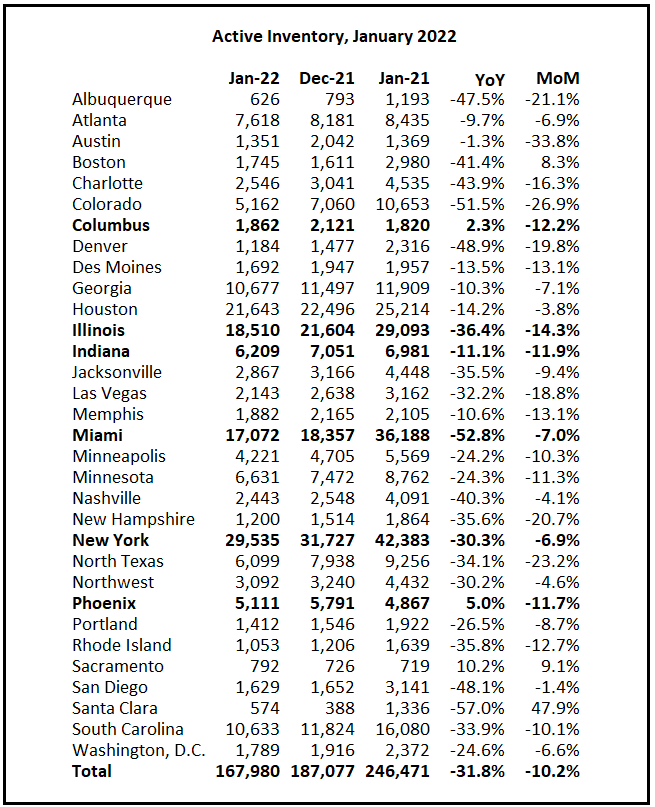
In terms of active inventory of housing, only Phoenix and Columbus Ohio are showing positive growth in active inventory YoY. But even Phoenix and Columbus saw a decline MoM (or month-over-month).
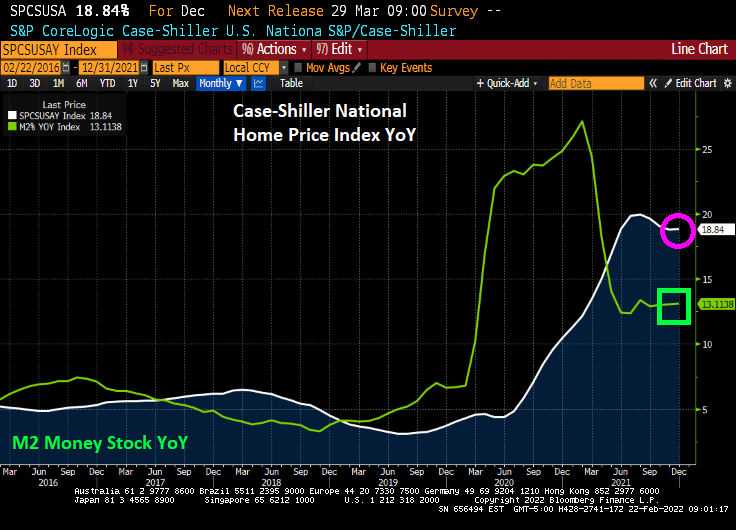
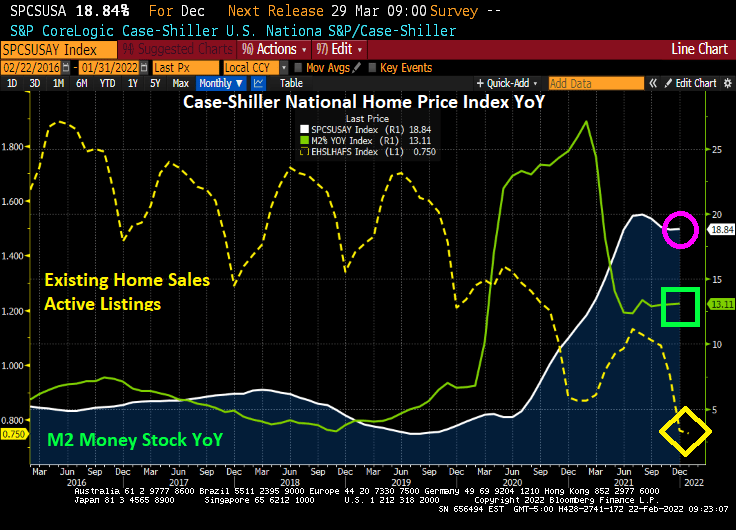
Including Existing Home Sales Active listings in the first chart, we see The Federal Reserve continuing to pump money at at 13.11% clip while active inventory is at an all-time low.
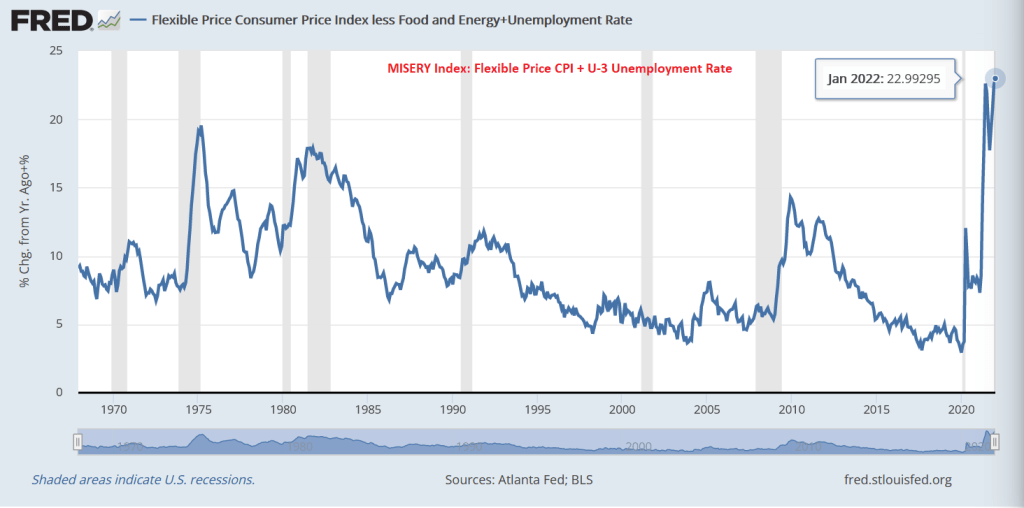
It is truly a miserable time for many Americans as demonstrated by the Misery Index (inflation rate + unemployment rate). But rather than using the CPI YoY measure at 7.5%, I am using the FLEXIBLE CPI YoY to compute the misery index. And is it ever miserable!
In January, the CORE flexible CPI YoY + U-3 unemployment rate hit a modern high at 22.99%. Or at least since 1967.
Like the movie “50 Shades of Gray,” we have 50 shades of inflation. Examples?
How about hardwood? Producer Price Index for hardwood is up 30.8% YoY.
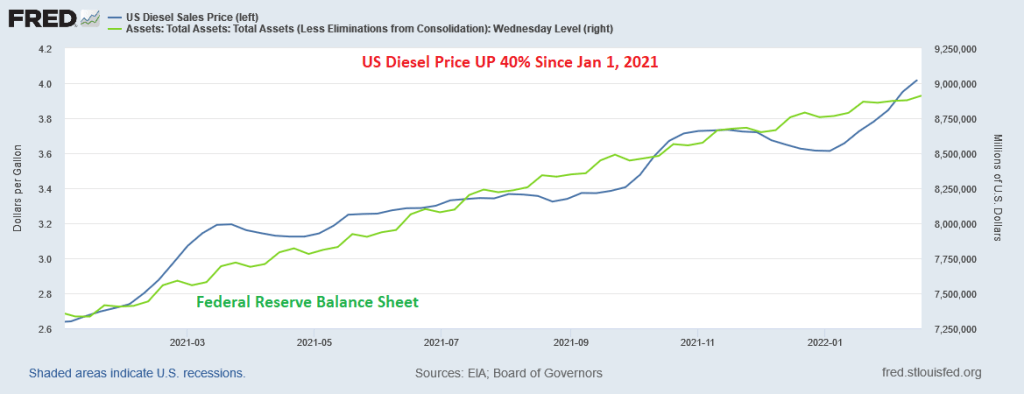
How about diesel fuel prices? They are UP 40% since January 1, 2021.
How about housing? UP 20% YoY according to Zillow’s home value index.
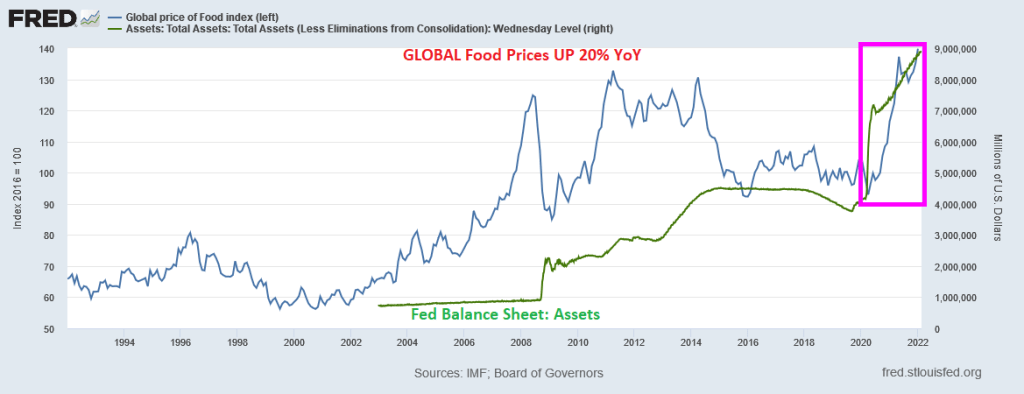
Global food prices? UP 20% YoY.
I could go on and on, but you get the picture. Rising energy, food and construction materials are soaring making many Americans miserable.
But Powell and The Fed have promised to whip inflation. Whip it good … with interest rate increases.
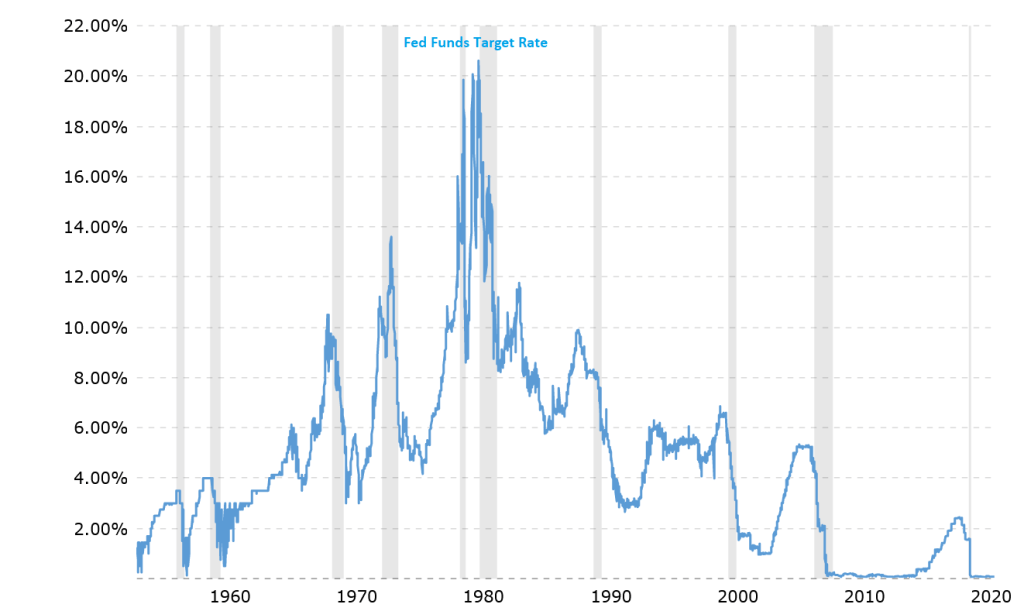
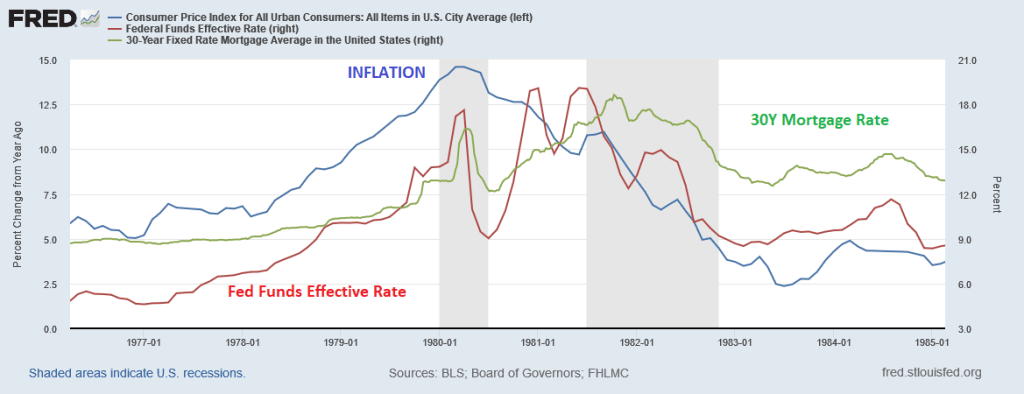
In August 1979, when Paul Volcker became chairman of the Federal Reserve Board, the annual average inflation rate in the United States was 11%. Inflation peaked in 1980 at 14.6%. Volcker raised the federal funds rate from 11.2% in 1979 to 20% in June of 1981.
Inflation (defined as CPI YoY) declined from over 14.6% in 1980 to 3.6% by 1985. But 30-year mortgage rates resumed their upward trajectory and peaking in October 1981 at 18.63 before beginning a gradual decline as inflation was tamed.
But will Powell enact another Volcker moment by raising the target rate abruptly?
The bank is joining others on Wall Street in ramping up bets for faster policy tightening, after U.S. consumer prices posted the biggest jump since 1982 in January. Goldman Sachs Group Inc. is forecasting seven hikes this year, up from its earlier prediction of five.
“We now look for the Fed to hike 25bp at each of the next nine meetings, with the policy rate approaching a neutral stance by early next year,” the JPMorgan team, led by chief economist Bruce Kasman, said in a research note.
January U.S. inflation readings “surprised materially to the upside,” the economists wrote. “We now no longer see deceleration from last quarter’s near-record pace.”
On inflation, the economists said a “feedback loop” may be taking hold between strong growth, cost pressures, and private sector behavior that will continue even as the intensity of current price pressures in the energy sector eventually fade.
Strong growth? 1.3% is strong growth??
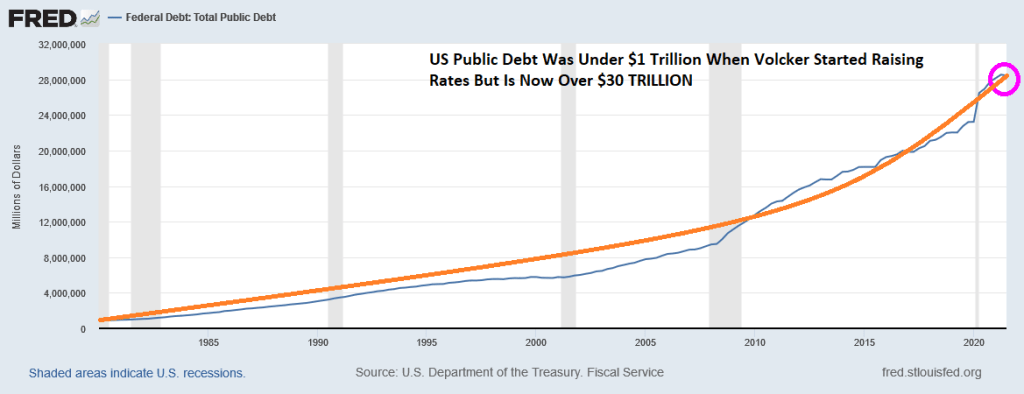
Be that as it may, the US economy is at a different place today than under President Jimmy Carter. When Volcker started raising The Fed Funds Target rate, US public debt was still under $1 trillion. It has ballooned to over $30 trillion today.
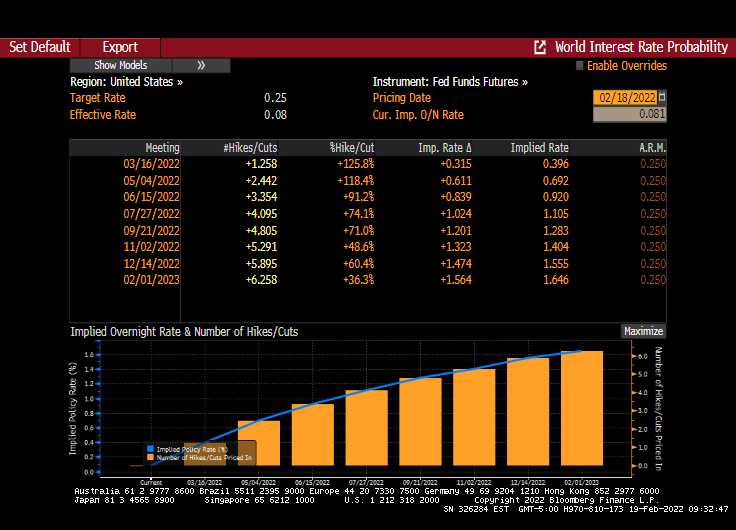
9 rate increases is above what is being priced in The Fed Funds FUTURES market which is 6 rate increases over the coming year.
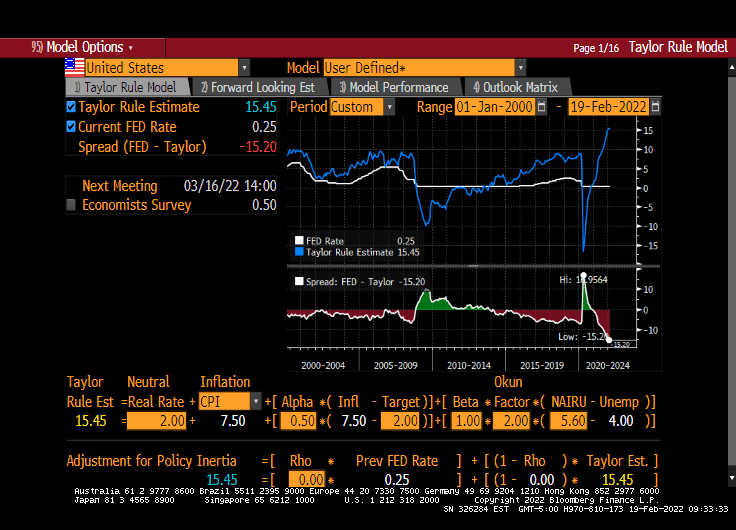
With 7.5% inflation, the Taylor Rule suggests a target rate of 15.45%. Talk about “Shock and Awful!”
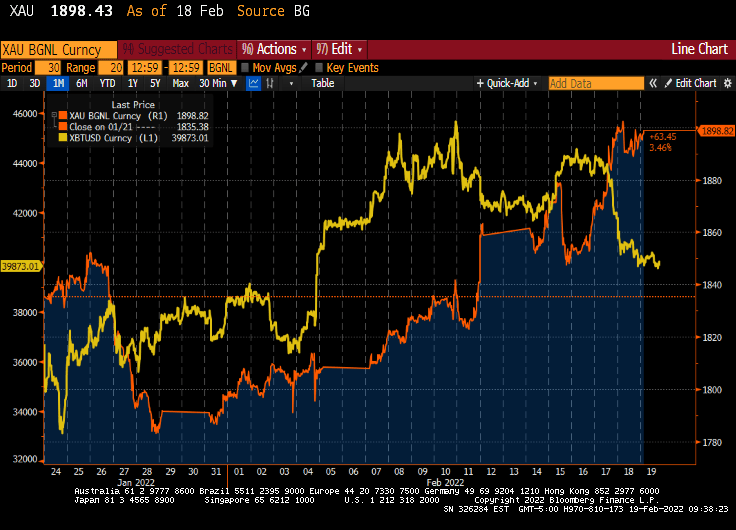
We are starting to see GOLD (gold) surging and Bitcoin (yellow) falling as The Fed prepares “shock and awful” rate hikes and Biden continues to beat the war drums over Russia invading Ukraine.
If The Fed actually raises rates 9 times and dramatically pares back its massive monetary stimulus, it will be “shock and awful.”
If The Fed does its expected “shock and awe” (or shock and awful), it will be more than the stock markets will crash. The housing market could crash too.
Take the current US housing situation with its limited inventory of listings combined with massive Fed stimulypto.
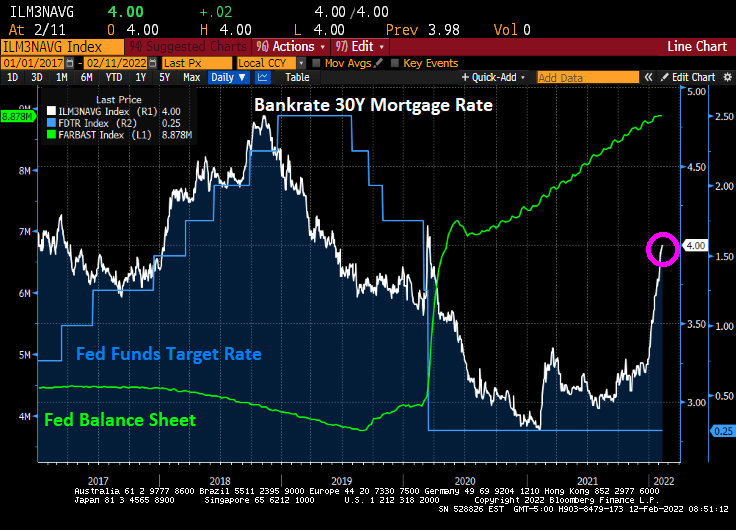
US 1-unit housing starts are down -4.1% in January. But heck, it is January! But on a year-over-year basis, 1-unit housing starts are down -2.4%. But what will happen if The Fed ACTUALLY withdraws its gargantuan monetary stimulus (green line)?
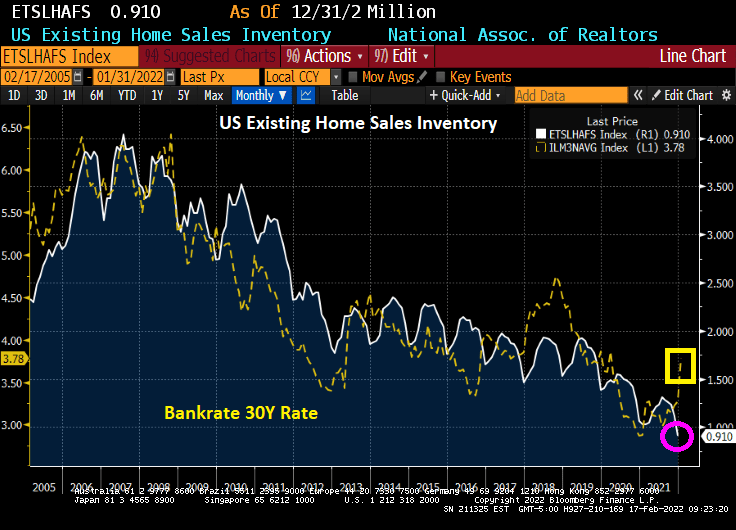
Existing home sales inventory continues to decline as Bankrate’s 30-year mortgage rate starts to climb with expectations of Fed “Shock and Awful.”
Say hello to The Federal Reserve Board of Governors!
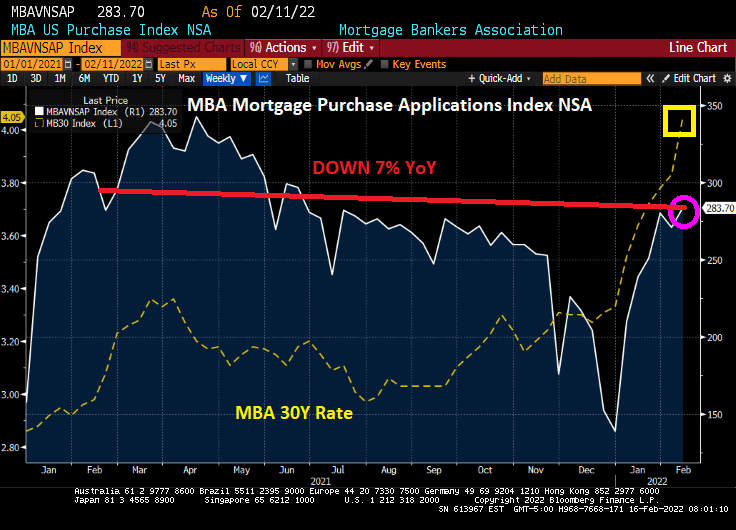
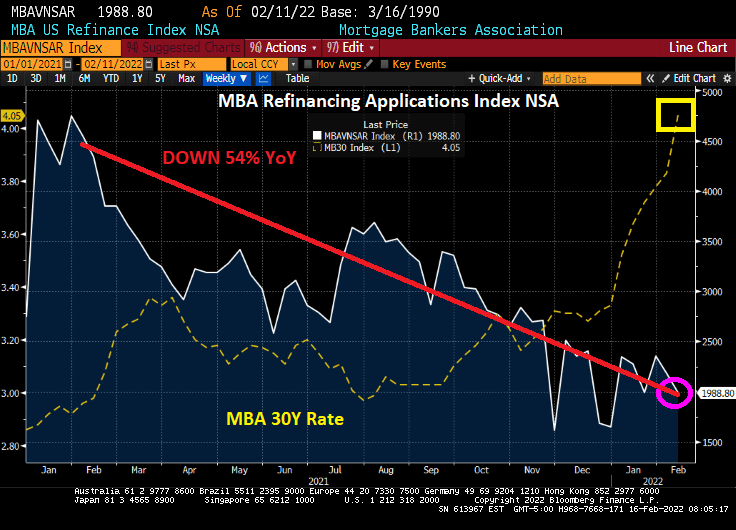
The good news is that borrowers are continuing to apply for a mortgage. The bad news is that they are applying at a 7% slower rate than the same time last year.
Mortgage applications decreased 5.4 percent from one week earlier, according to data from the Mortgage Bankers Association’s (MBA) Weekly Mortgage Applications Survey for the week ending February 11, 2022.
The seasonally adjusted Purchase Index decreased 1 percent from one week earlier. The unadjusted Purchase Index increased 5 percent compared with the previous week and was 7 percent lower than the same week one year ago.
The Refinance Index decreased 9 percent from the previous week and was 54 percent lower than the same week one year ago.
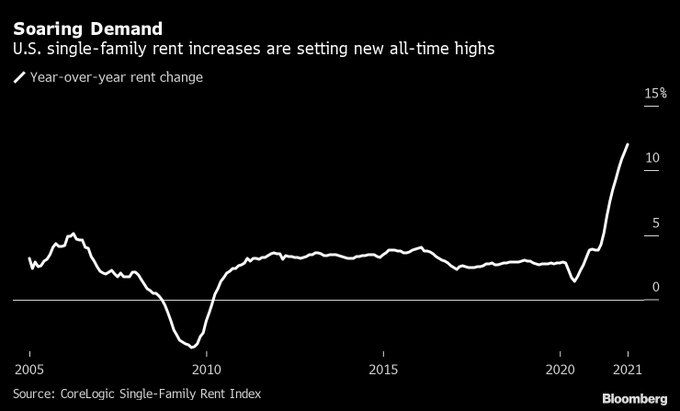
Call this a double whammy! Red-hot rents combined with a slowing economy.
According to CoreLogic, single-family annual rent growth finished 2021 at a new record: 11.7% YoY for high tier rental properties and 10.4% YoY for low tier rental properties.
Of course, southern and southwest rental properties are seeing the fastest rent growth. Particularly Miami at 36% YoY. Phoenix is no slouch at 19% growth in rents.
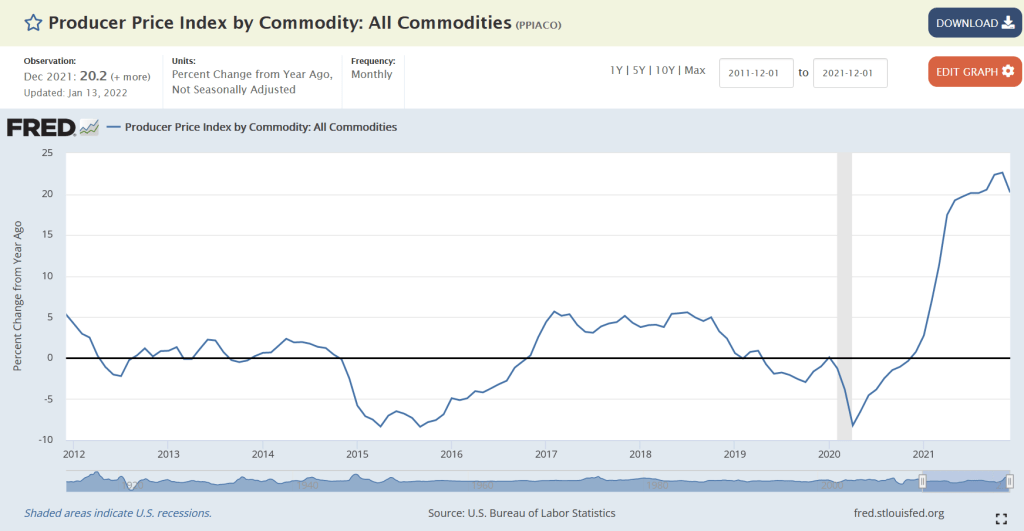
I thought the last inflation report of 7.5% inflation was bad. But then the Atlanta Fed updated their inflation measure for flexible prices. Flexible inflation, less food and energy, is roaring at 19% YoY!
Flexible prices are those prices that adjust rapidly. Along with commodity prices.
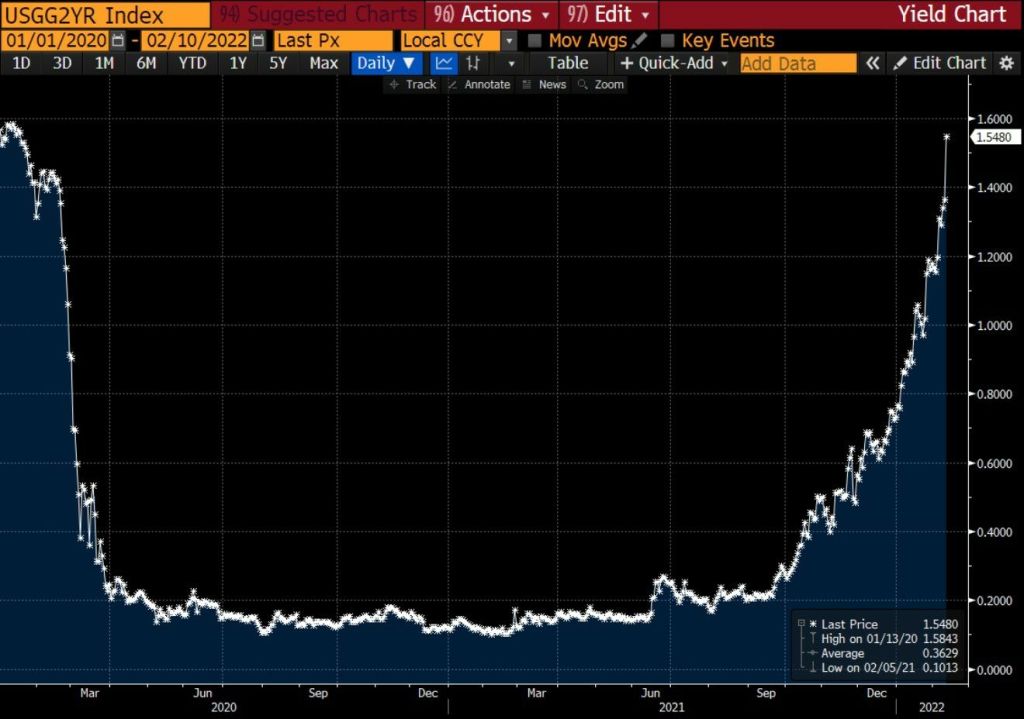
Speaking of rapid rises, take a look at the 2-year US Treasury yield since COVID struck in early 2020.
We did see 2-year Treasury yields generally correlated with The Fed Funds Target Rate … at least until COVID struck. Since mid-2020, The Fed Funds Target Rate remains at 0.25% while the 2-year Treasury yield is roaring back with fuzzy expectations from The Fed’s leadership.
The 10-year Treasury yield is not rising as rapidly as the 2-year Treasury yield, but it is hovering around 2%.
But Bankrate’s 30-year mortgage rate is rising like a comet, similar to the 2-year Treasury yield.


You must be logged in to post a comment.