Today is all quiet of the financial market front since the US stock
Today is all quiet of the financial market front since the US stock and bond markets are closed. But as the new year starts, we have to ask the following question: is the US already in a recession?
Well, if you follow the NBER business cycle tracker, the answer is no. Unfortunately, the NBER only tells us if we are in a recession after it has already happened.
A simple measure of IMPENDING recession is the US yield curve which is currently inverted. Typically, a recession occurs within months of the yield curve inverting. But if we look at real GDP growth, the Atlanta Fed GDP tracker is at 3.7%, so no recession there (two consecutive quarters of negative GDP growth is often used as a measure of recession).
But another indicator of “all is not well” is the CBOE Put/Call Ratio. Typically, the Put/Call Ratio spikes during a recession. But on December 28, 2022, the Put/Call Ratio spiked to its highest level since 1996. Although it has calmed down to 0.84 on December 30, 2022. Suffice it to say that there is enormous uncertainty in markets.
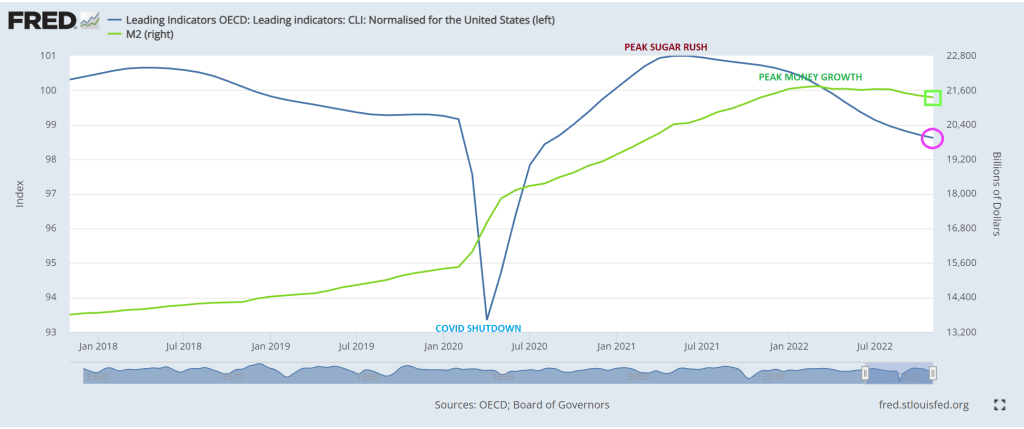
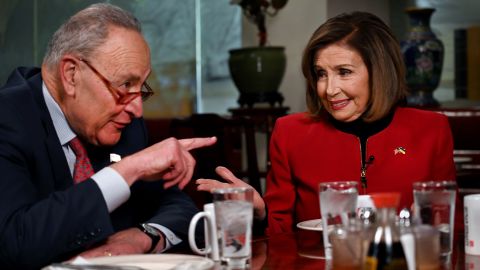
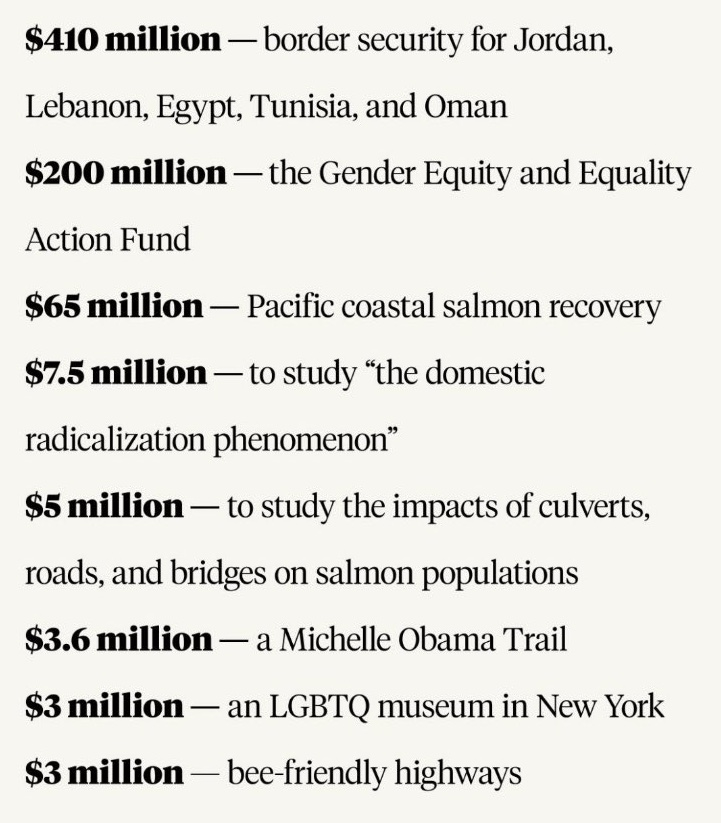
Covid begat massive Fed monetary stimulus and an excuse for the Federal government to go on a series of spending sprees (Covid “relief”, Instrastructure, Inflation Reduction, and now the $1.7 Trillion pork-laden Omnibus bill). Now that historic big spender Nancy Pelosi (CA-D) is no longer Speaker, will her successor have such a voracious spending appetite? The US economy is still benefitting from Covid-related stimulus which also helped generate 40-year highs in inflation.

Thanks to inflation, US workers have had 20 consecutive months of negative wage growth. But as M2 Money growth slows to a halt, so will real average hourly earnings.
The traditional measures of recession (unemployment and Real GDP growth) are NOT pointing to recession, but 20 straight months of negative wage growth points to bad news for workers. Throw in an inverted yield curve and massive volatility in the CBOE Put-Call Ratio and we have a party … that I don’t want to attend.
In other news, the Washington Commanders football team unveilved a new hog mascot. Of course, the Washington Hogs mascot could also apply to the Federal government with their incessant pork-barrel spending. Nancy Pelosi (D-CA) is the honorary hog.
Hey big spenders, spend TRILLIONS on Ukraine and pork barrel projects.
and bond markets are closed. But as the new year starts, we have to ask the following question: is the US already in a recession?
Well, if you follow thme NBER business cycle tracker, the answer is no. Unfortunately, the NBER only tells us if we are in a recession after iti has already happened.
A simple measure of IMPENDING recession is the US yield curve which is currently inverted. Typically, a recession occurs within months of the yield curve inverting. But if we look at real GDP growth, the Atlanta Fed GDP tracker is at 3.7%, so no recession there (two consecutive quarters of negative GDP growth is often used as a measure of recession).
But another indicator of “all is not well” is the CBOE Put/Call Ratio. Typically, the Put/Call Ratio spikes during a recession. But on December 28, 2022, the Put/Call Ratio spiked to its highest level since 1996. Although it has calmed down to 0.84 on December 30, 2022. Suffice it to say that there is enormous uncertainty in markets.
Covid begat massive Fed monetary stimulus and an excuse for the Federal government to go on a series of spending sprees (Covid “relief”, Instrastructure, Inflation Reduction, and now the $1.7 Trillion pork-laden Omnibus bill). Now that historic big spender Nancy Pelosi (CA-D) is no longer Speaker, will her successor have such a voracious spending appetite? The US economy is still benefitting from Covid-related stimulus which also helped generate 40-year highs in inflation.
Thanks to inflation, US workers have had 20 consecutive months of negative wage growth. But as M2 Money growth slows to a halt, so will real average hourly earnings.
The traditional measures of recession (unemployment and Real GDP growth) are NOT pointing to recession, but 20 straight months of negative wage growth points to bad news for workers. Throw in an inverted yield curve and massive volatility in the CBOE Put-Call Ratio and we have a party … that I don’t want to attend.
In other news, the Washington Commanders football team unveilved a new hog mascot. Of course, the Washington Hogs mascot could also apply to the Federal government with their incessant pork-barrel spending. Nancy Pelosi (D-CA) is the honorary hog.
Hey big spenders, spend TRILLIONS on Ukraine and pork barrel projects.


You must be logged in to post a comment.