Like the poem, Casey At The Bat, the US economy struck out with a shockingly bad jobs report for September.
Oh, somewhere in this favored land the sun is shining bright; The band is playing somewhere, and somewhere hearts are light, And somewhere men are laughing, and somewhere children shout; But there is no joy in Mudville USA—mighty Casey Biden has struck out.
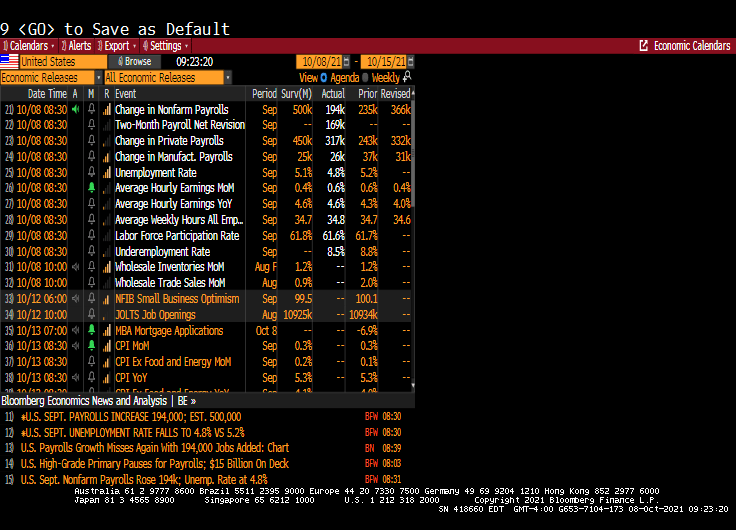
The U.S. economy added fewer jobs than forecast for a second straight month in September. Nonfarm payrolls increased by just 194,000 last month after an upwardly revised 366,000 gain in August, Labor Department figures showed Friday. 500K was expected.
The U-3 unemployment rate declined to 4.8% (meaning that the labor force shrank due to people dropping out of the labor force). In fact, 338,000 people dropped out of the labor force.
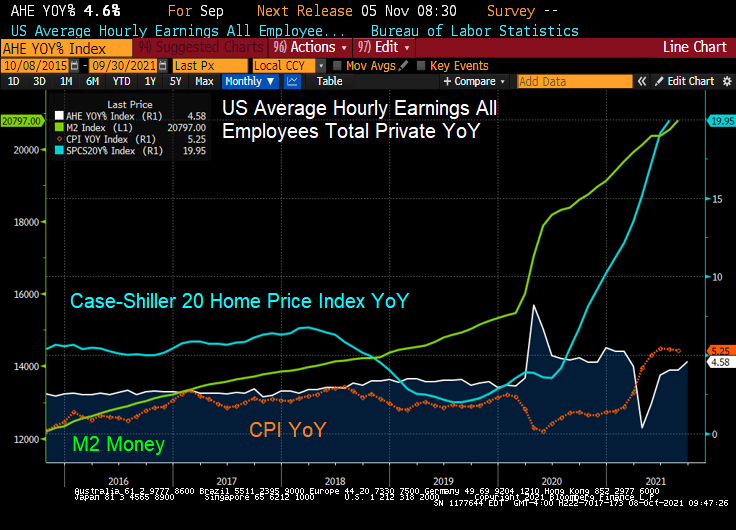
Average hourly earnings YoY rose to 4.6%. While that is an improvement, but it is lower than the inflation rate of 5.25% YoY and house price inflation of 20% YoY.
This miserable jobs report is a victory for Fed doves that don’t want to raise rates or slow down the balance sheet growth.
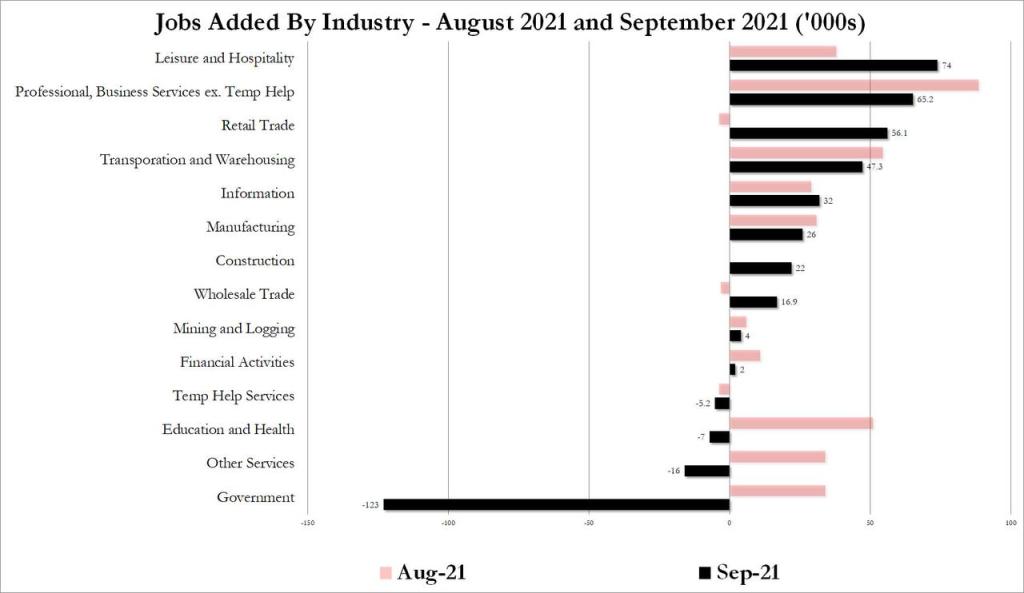
Where were the jobs created? Leisure and hospitality, as usual, leads in job gains.
It was great to be a “Master of the Universe” (Treasury and MBS trader) since October 1981 when the US 10Y Treasury yield peaked at 15.84% and mortgage rates peaked at 18.63%. Treasury and mortgage rates have generally fallen ever since. But what happens if Treasury and mortgage rates rise?
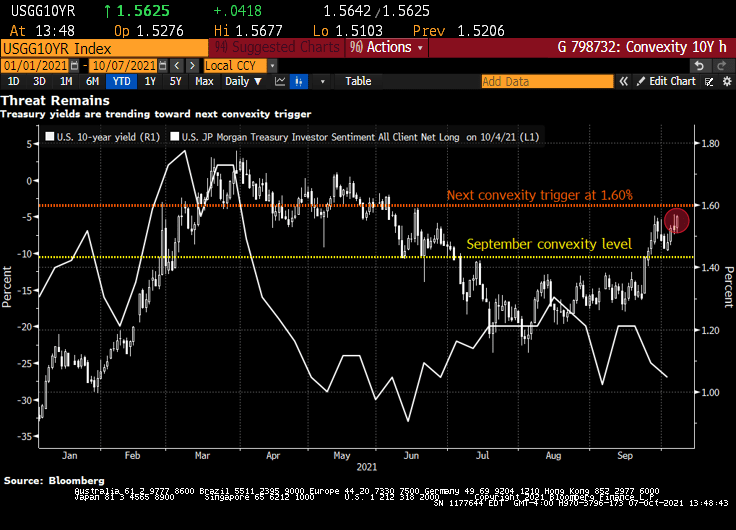
Bond investors are piling back into short positions, motivated not only by the specter of inflation but also by the risk that yields are approaching levels that will unleash a wave of new selling by convexity hedgers.
That level is around 1.60% in the U.S. 10-year Treasury yield, less than 10 basis points from its current mark, according to Brean Capital’s head of fixed income strategy, Scott Buchta. It’s the mid-point of “a key threshold” between 1.40% to 1.80%, an area “most critical from a convexity hedging point of view.”
Convexity hedging involves shedding U.S. interest-rate risk to protect the value of mortgage-backed securities as yields rise, slowing expected prepayment rates.
It’s already begun to pick up as yields stretched past the 1.40% level. Another wave is expected at around 1.6% — a point of “maximum negative convexity” in agency MBS, “where 25bp rallies and sell-offs should have an equal effect on convexity-related buying and selling,” Buchta says.
Signs that short positions are accumulating include Societe Generale’s “Trend Indicator.” Among its 10 newest trades are short positions in Japanese 10-year debt, German 5-year debt futures, U.K. 10-year gilts, U.K. short sterling and U.S. 2- and 5-year notes. Meanwhile, CFTC positioning data for U.S. Treasury futures show asset managers flipped to net short in 10-year note contracts in the process of dumping the equivalent of $23 million per basis point of cash Treasuries over the past week. Hedge-fund shorts also remain elevated in the long-end of the curve, as measured by net positions in Bond and Ultra Bond futures.
“Bond-bearish impulses remain in place,” says Citigroup Inc. strategist Bill O’Donnell in a note, citing tactical and medium-term set-ups. Traders should be aware of short-covering rallies in the meantime, however, he says.
“Potentially extreme short-term positioning and sentiment set-ups could easily allow for a counter-trend correction under the right conditions,” he said.
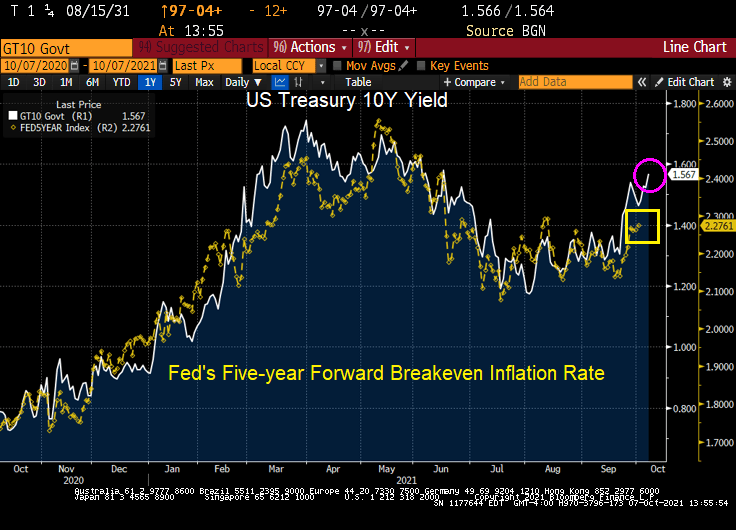
U.S. 10-year yields topped at 1.57% this week, the cheapest level since June, spurring the breakeven inflation rate for 10-year TIPS to 2.51%, the highest since May. Friday’s September jobs report could add fuel to this inflationary fire, rewarding bond shorts.
Here is a chart of the rising 10Y Treasury yield against The Fed’s 5Y forward breakeven rate.
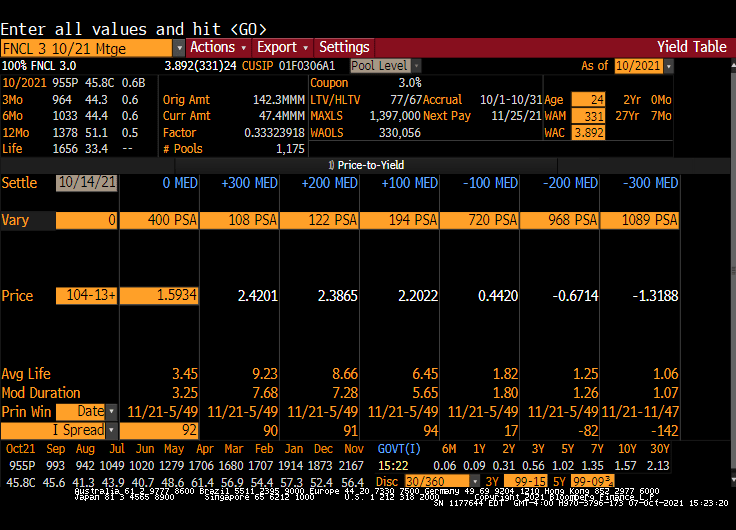
Here is a Fannie Mae 3% coupon MBS. Note the rise in Modified Duration with an increase in interest rates.
Initial jobless claims dropped below their recent range last week, falling to the second lowest level since the COVID-lockdowns crushed the economy. Only 326k Americans filed for jobless benefits for the first time last week, down from 364k last week and below the 348k expectation.
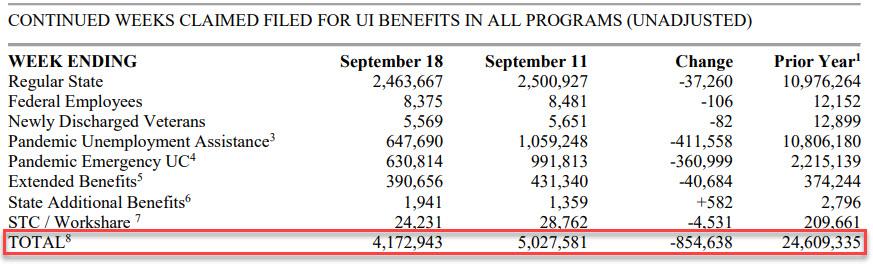
Continuing claims also declined from the previous week, again largely from Pandemic Unemployment Assistance and Pandemic Emergency Claims programs ending.
On a related note, Challenger job cuts were down -84.9% YoY. But for September, there was a surge in low-paying retail jobs and transportation jobs as Panademic stimulus ran out and governments have pretty much stopped their destructive government shutdowns of economies.
Well, Janet, we are headed there anyway with GDP crashing to a measly 1.33%.
The fear of not approving a debt ceiling increase (laughable since Democrats can do it on their own) has caused there to be a “little dipper” in the US Treasury actives curve. Meaning that the 1-month T-bill yield is higher than the 1-year T-bill yield.
The culprits? Declining auto sales, manufacturing, etc.
I have discussed soaring prices since Biden’s election (food, energy, housing, rent, etc). But another soaring price component is shipping costs. Up 315% since mid-February.
While Trump’s slogan was “Make American Great Again”, Biden and The Fed’s slogan should be “Make America Far More Expensive For The Middle Class.” But that won’t fit on a bumper sticker.
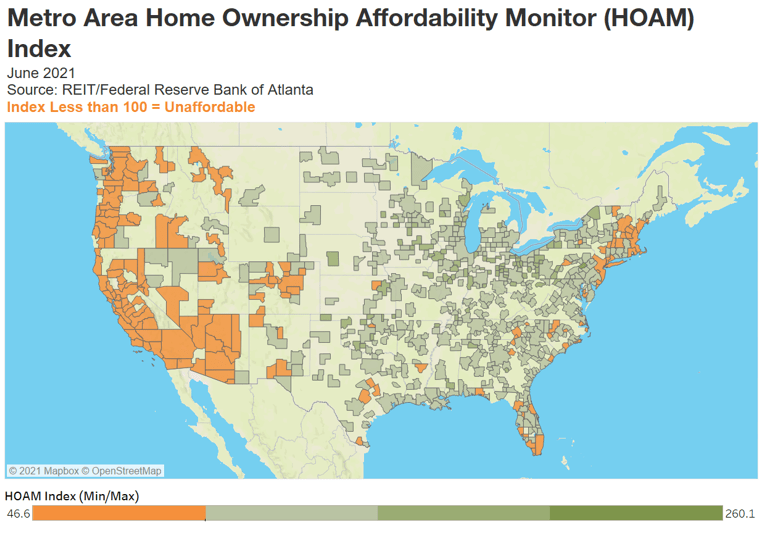
The national HOAM index stood at 92.2 in June, its lowest level since 2008.
National housing affordability fell 11.9 percent in June, the sharpest drop since 2014.
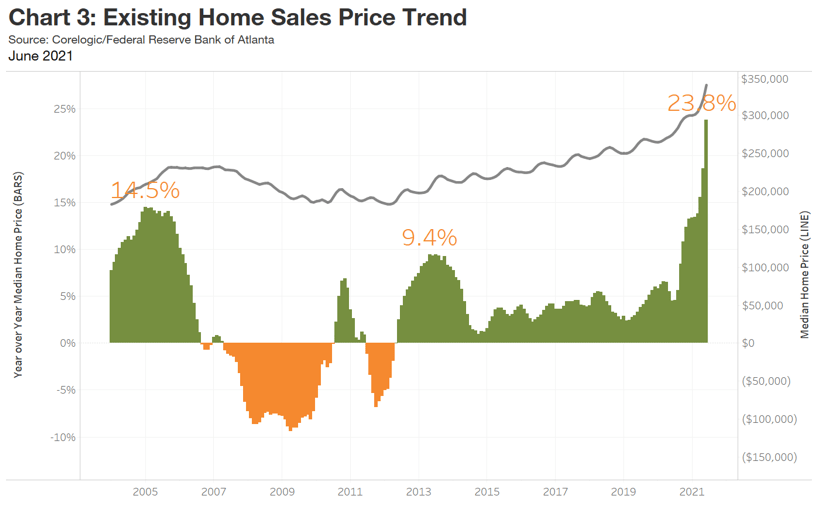
Home sale prices were up 23.8 percent over the past year.
On average, a median-income household would need to spend 32.6 percent of its annual earnings to own a median-priced home.
Although demand for housing remains strong, steadily declining affordability is beginning to affect buying decisions.
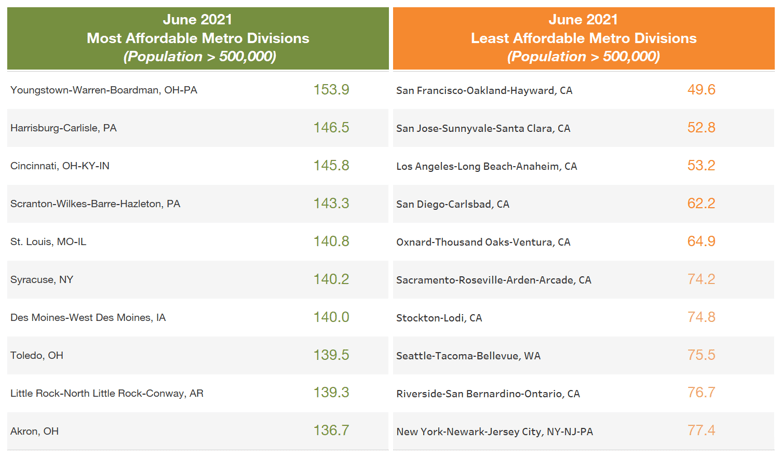
The latest reading of an Atlanta Fed measure and US housing trends show home ownership is becoming out of reach for many buyers and resistance to higher prices is building. More than 80 percent of US metro areas had a drop in affordability.
Where is housing most and least affordable?
ddd
Of course, the one chart that The Fed never includes is home price growth and Fed monetary policy.
So, if The Fed is so concerned with median-income households being priced out of housing markets, why are the still sticking with their unorthodox monetary policies?
Since Joe Biden took office in January 2021, we have seen several actions from The White House. First, was the cancellation of the Keystone Pipeline (making the US more energy dependent on others). Second, Biden waived US sanctions on Russian pipeline to Germany. Big winner? Russia. Big loser? US consumers trying to heat their homes.
Here is a chart of natural gas prices since Biden took office in January.
Biden reminds me of Dwight Schrute from the TV show “The Office” as he loves to punish people. In this case, families trying to heat their home. And have his own currency, Schrute Bucks.
Perhaps The Federal Reserve should rename the US Dollar as “Biden Bucks.”
Can you say “All the king’s horses and all the king’s men ..” Or “All The Fed’s stimulus and all of Biden’s jobs bills ..”
Yes, the Atlanta Fed’s GDPNow Q3 tracker slumped to 2.3% despite the massive stimulus coming from The Federal Reserve and the Biden Administration. Down from 13.7% GDP growth as of 5/5/2021.
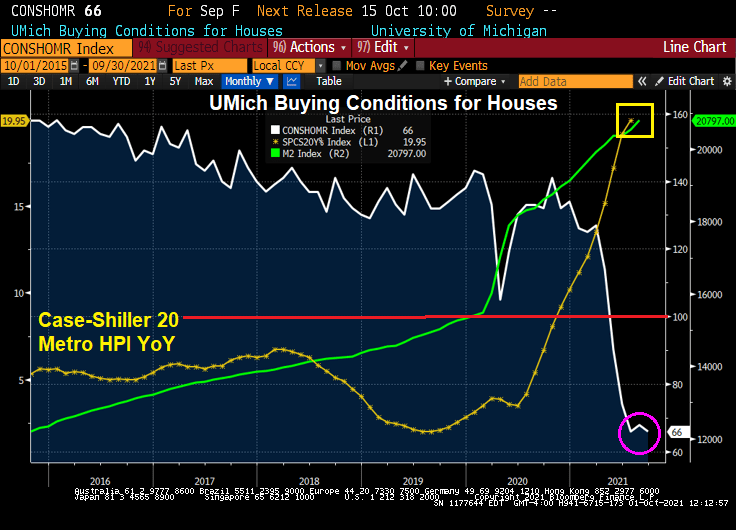
I have a new term for consumers that get beaten-up by The Fed’s massive distortion of markets. I call this being “Powell’d”.
The latest example of consumers getting Powell’d is in the University of Michigan consumer survey. Buying conditions for housing just fell to the lowest level since 1982.
“I am in the camp that believes it will soon be time to begin slowly and methodically — frankly, boringly — tapering our $120 billion in monthly purchases of Treasury bills and mortgage-backed securities.”
Here they go again! A cautionary tale of a government gone wild resulting in gut-wrenching inflation and 76.7% of the population living in extreme poverty.
Venezuelais launching a new version of the bolivar in the latest attempt to salvage a currency so beaten down by years of hyperinflation that residents have adopted the U.S. dollar.
The so-called digital bolivar, which is being introduced Friday, effectively removes six zeroes from the “sovereign bolivar,” which started circulating just three years ago.
New banknotes and coins will be put into use. Bank accounts will be adjusted to reflect the redenomination. And debit and credit card purchases will become easier: there were so many digits involved in some transactions that merchants were forced to split the transaction into multiple card swipes.
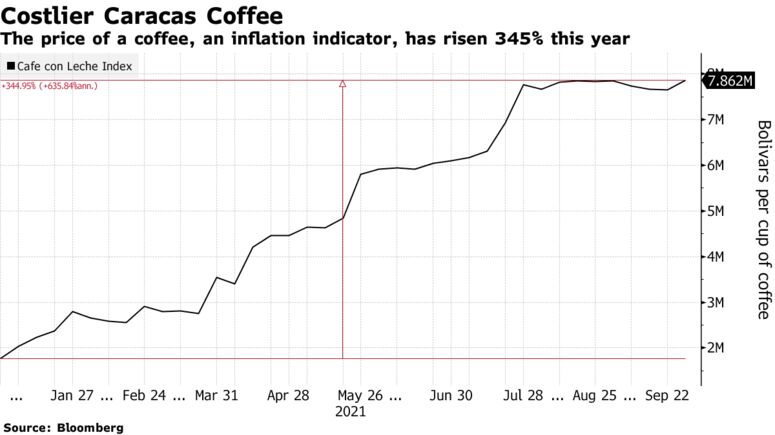
It’s another maneuver aimed at propping-up the national currency, even though President Nicolas Maduro’s government is permitting the use of the U.S. dollar as a way to cope with runaway inflation and shortages. The government has implemented two other currency changessince 2008, dropping eight zeroes. Hyperinflation, among the highest in the world, has slowed to 2,146% per year from more than 300,000% in 2019, according to Bloomberg’s Cafe Con Leche index.
Under Friday’s change, the largest former banknote, for 1 million bolivars — worth about $0.23 –will be replaced by a 1-bolivar coin. One dollar will fetch around 4.2 bolivars instead of 4.2 million bolivars at the official exchange rate.
“This is useless. Prices will continue to rise and, in a few months, the new bills will be useless,” said Leida Leon, a 37-year-old cleaning worker at a Caracas school.
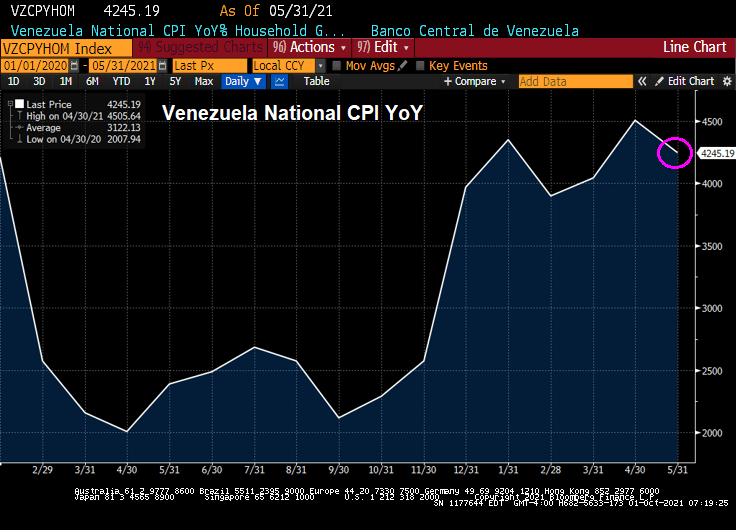
And Venezuela’s official inflation rate for household goods is a blood-curdling 4,245% YoY.
On Thursday, demand for dollars rose as people feared a prolonged suspension of banking services as the redenomination is rolled out, said Luis Arturo Barcenas, senior economist at Caracas-based financial analysis firm Ecoanalitica.
Two-thirds of retail transactions involve the U.S. dollar, according to Ecoanalitica. Yet, many Venezuelans need bolivars for everyday transactions, like bus fares and to buy gas subsidized by the government. While the government is attempting to boost the use of digital payments, many regions are beset by regular electrical blackouts that affect communications.
Venezuelans have faced disastrous government policies and pressure from U.S. sanctions that have put the country on the brink of its eighth-straight year of economic contraction. More than 5 million people have fled the country, once one of Latin America’s wealthiest.
An estimated 76.6% of Venezuelans are living in extreme poverty, up from 67.7% last year, according to a university survey on living conditions known as Encovi.
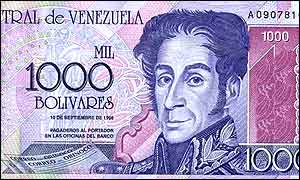
As least Venezuela’s Treasury Department could produce a likeness of Simón Bolívar (aka, Simón José Antonio de la Santísima Trinidad Bolívar y Ponte Palacios y Blanco) that doesn’t look like a bad cartoon character.


You must be logged in to post a comment.