Covid is the gift that keeps on giving … to lazy bureaucrats and teachers union members. And a horror for small businesses and students since small businesse go bankrupt and students suffer from lack of education. And now The Federal Government is fearmongering (hey, that’s all they do!) ANOTHER Covid outbreak with Deep State Joe Biden advocating for more Federal spending on vaccines and telling everyone to get yet ANOTHER vaccination. And wear useless masks as a sign of obidience to The Democrat Party.
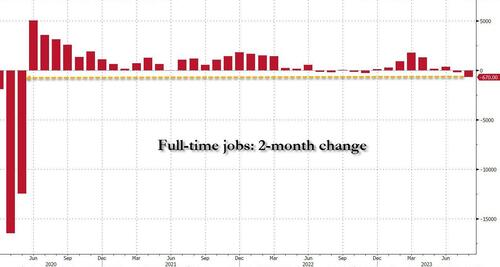
The Bureau of Labor Statistics (BLS) reported that in August the number of full-time jobs dropped again, sliding by 85K to 134.2 million, and followed the whopping 585K plunge in July which brings the two-month total drop in full-time jobs to a whopping 670K, the biggest 2-month plunge since the covid lockdowns in early 2020 when 12.5 million full-time jobs were lost in one month!
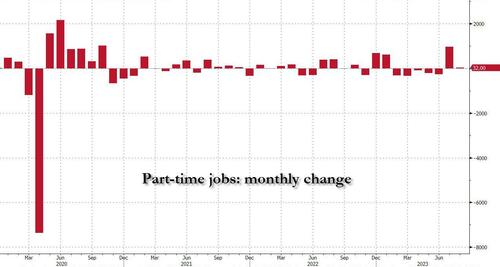
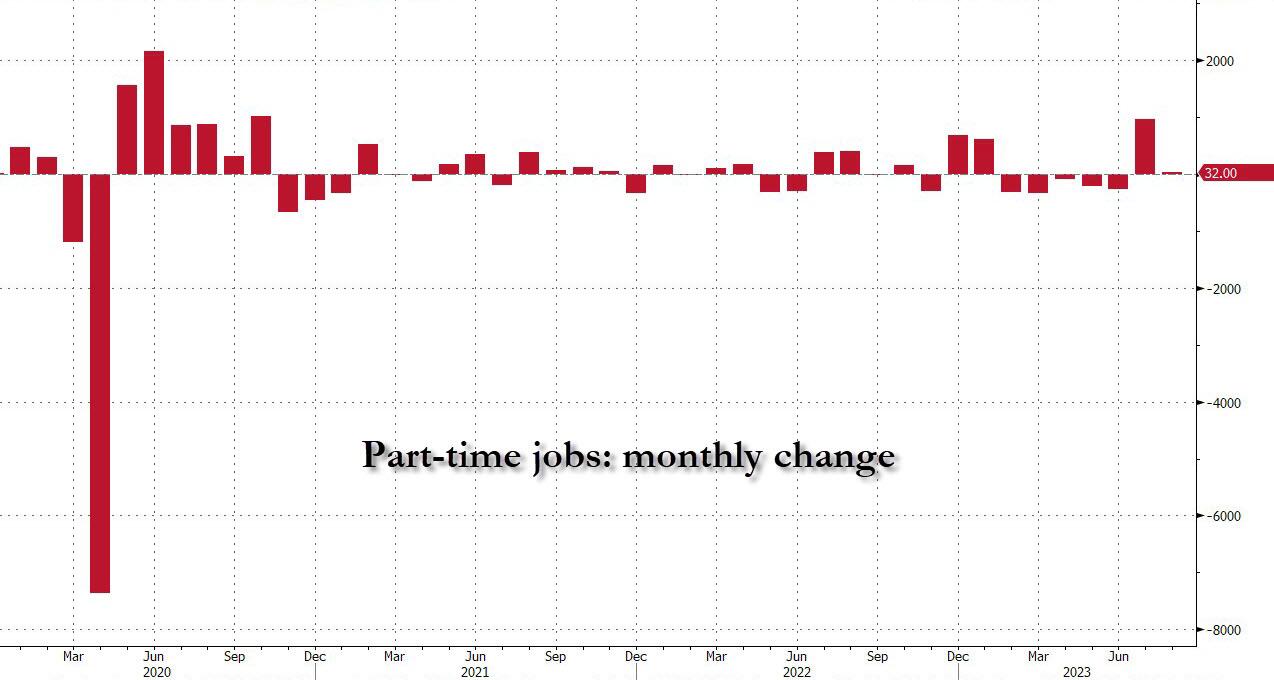
But if full-time jobs crashed how did the BLS get an increase of 222,000 employed workers? Simple: it was all in the latest jump of part-time workers. Indeed, in August the number of reported part-timers jumped by 32K and when added to the near-record 972K surge in July, the 2-month total was just over one million – 1,004,000 to be precise – to 27.185 million.
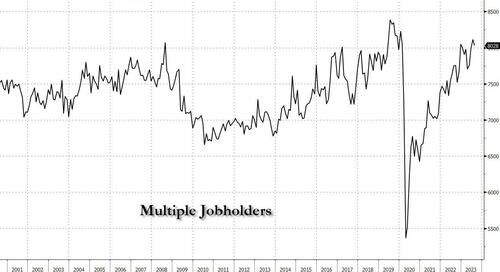
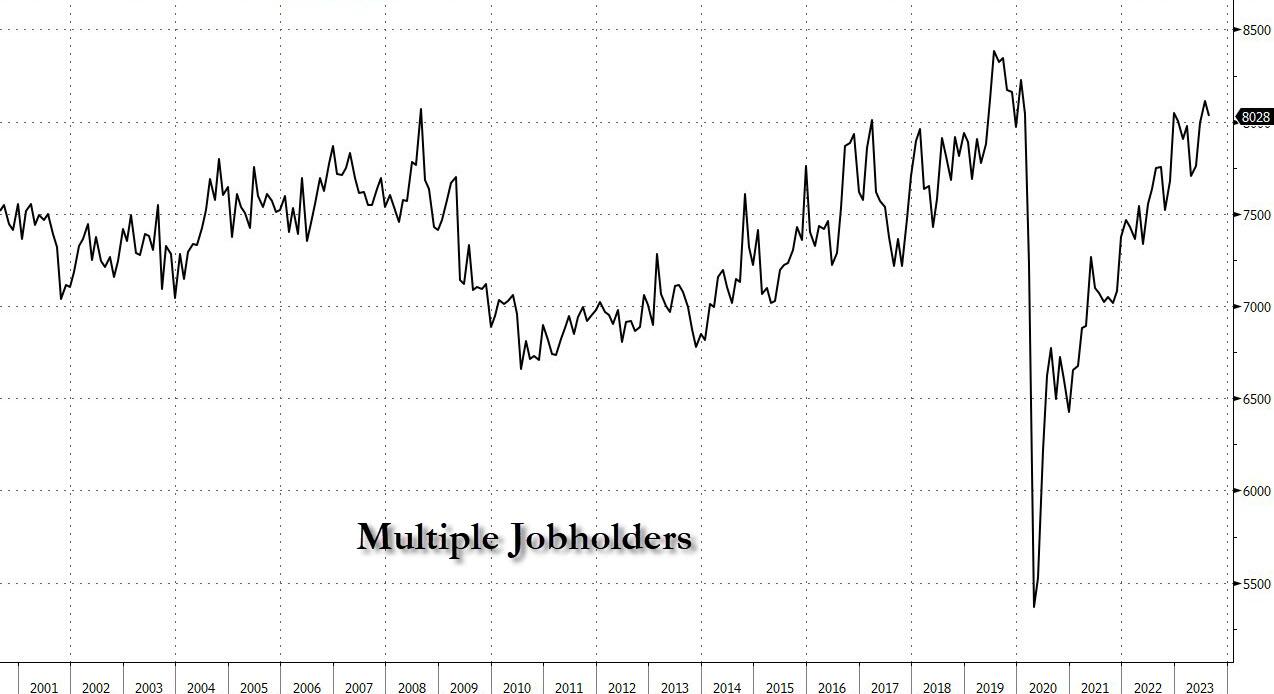
Going back to a quantitative read of the data, we look at the number of multiple jobholders – those workers who have to work more than one job at a time to make ends meet. In August this number was actually a modest silver lining, as it dropped by July, that number dropped by 85K to 8.028 million, but it remains just shy of the pre-covid record.
Given the extreme level of corruption in the Biden Administration, the Democrat Party should be renamed after New York’s Tammany Hall.
And require all people to wear a Tammany Hall fez instead of a mask.
The glories of Bidenomics is on fully display. Despite what Lyin’ Biden says, Bidenomics is only working for the elites (top 1%). How Soviet/CCP command economy of him!
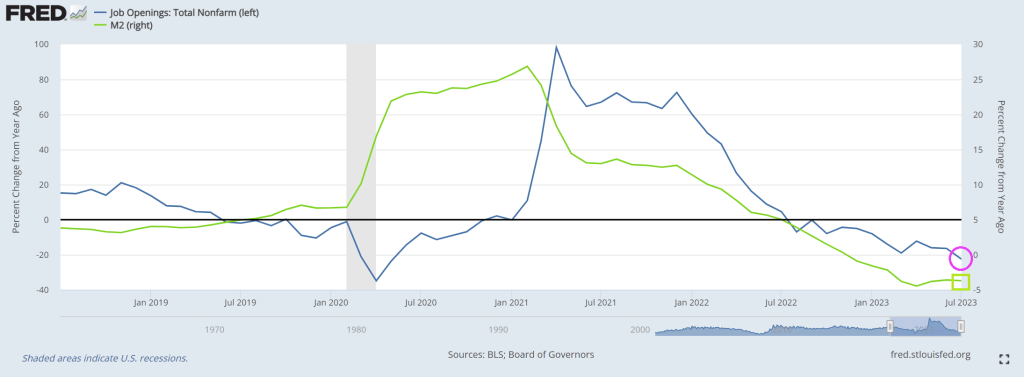
Here is an ugly chart showing Bidenomics in action! We all know that Covid unleashed a torrent of Fed monetary stimulus AND Federal spending on Covid relief and green energy subsidies (most to large Democrats donors). BUT we now have experienced 3 consectutive quarters of negative gross domestic income (GDI) growth. And nominal GDI growth is falling with falling M2 Money growth.
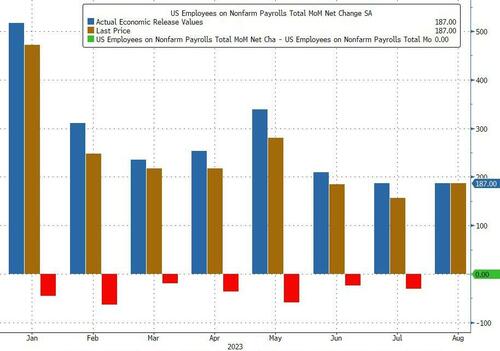
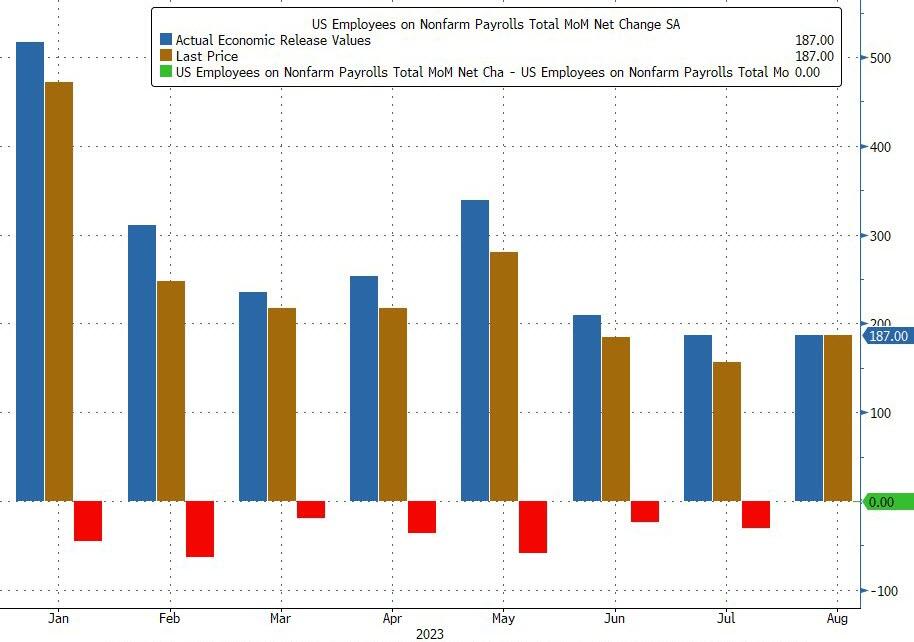
And today’s jobs report for August showed that only 187k jobs were added.
Superficially this would have meant an unchanged print from last month when the BLS also reported 187K jobs, however in keeping with recent trends that number was revised – drumroll – lower again, to 157K, meaning that every single monthly payrolls print in 20-23 has been revised lower (see chart below), a 12-sigma probability and virtually impossible unless there was political pressure to massage the data higher initially and then revise it lower when nobody is looking. (As if the mainstream media is at all honest!)
But wait there’s more: while July was revised down by 30K from +187,000 to +157,000, June was revised even more, by 80,000, from +185,000 to +105,000, which means that a number that was originally reported as 209K has been reivsed 50% lower, to 105K and a collapse vs original expectations of 230K. Here, the BLS was proud to report that “with these revisions, employment in June and July combined is 110,000 lower than previously reported.”
And we have The Conference Board’s confidence index at -65. Yikes!
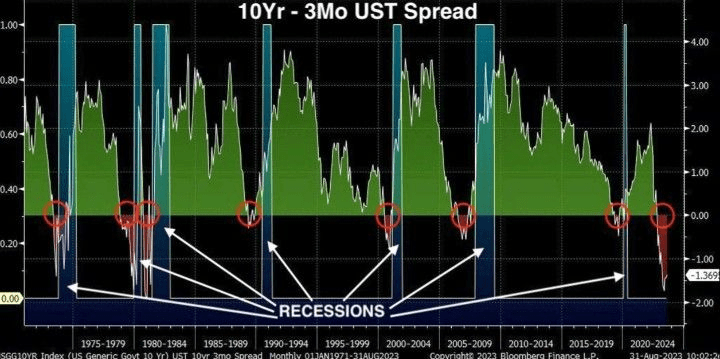
Finally, we have the 10Y-3M UST spread SCREAMING recession!
So, the economy is slowing under Bidenomics and Cadavar Joe.
Will Cadavar Joe actually go out on the campaign trail and debate ANY Democrat or Republican?? Remember, this is the man with the nuclear launch codes.
Another economic report on Bidenomics. This one is for housing.
Realtors Pending Home Sales Index (PHSI)* – a forward-looking indicator of home sales based on contract signings – rose 0.9% to 77.6 in July. Year over year, pending transactions fell by 14.0%. An index of 100 is equal to the level of contract activity in 2001.
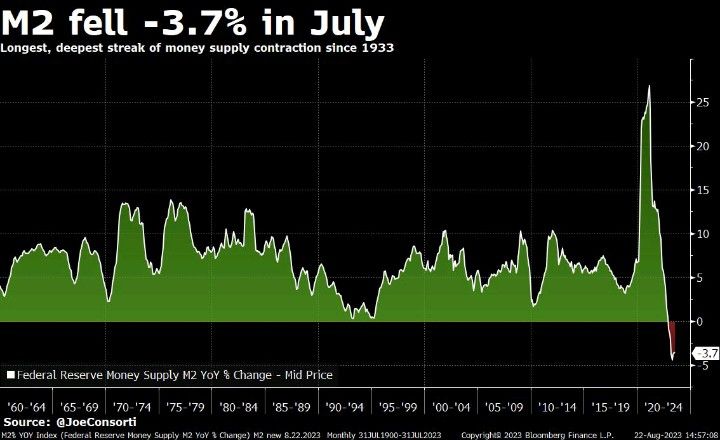
Combine that with crashing M2 Money growth (lowest since 1933 and The Great Depression (and The Dust Bowl). The difference is that the US had the soothing talks of Franklin Roosevelt “I can assure you that it is safer to keep your money in a reopened bank than under the mattress.” —President Franklin Roosevelt in his first Fireside Chat, March 12, 1933. Unfortunately, we have Joe Biden, the WORST public speaker in history and a completely unempathetic person.
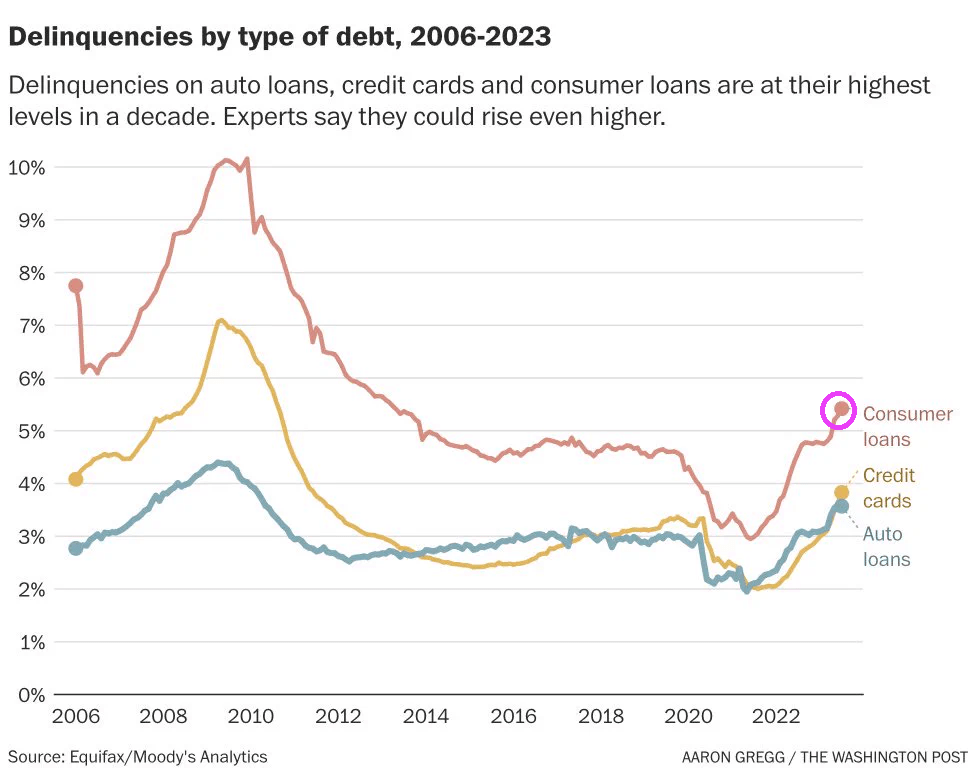
Delinquencies on auto loans, credit cards and consumer loans are at their highest levels in a decade.
Instead of Sleepy Joe, Middle Class Joe, Corrupt Joe (sounds like Cuppa Joe), and any of the multitude of unflattering nicknames, we now have REVEREND JOE.
Billions Biden, the President who loves to (recklessly) spend taxpayer money (mostly on large donors). is going to have difficuly spinnig the latest employment figures.
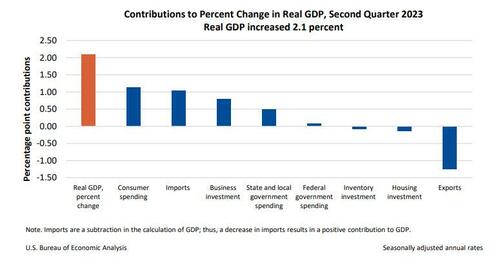
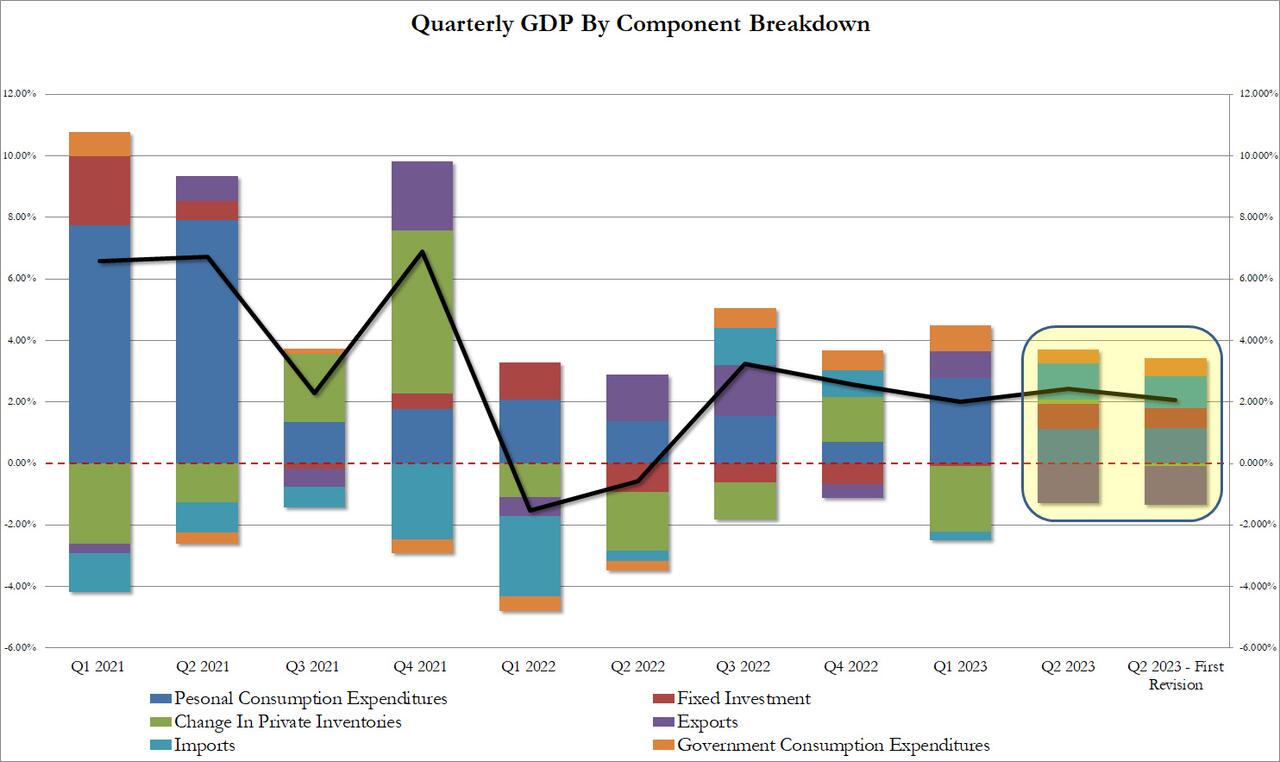
The GDP estimate released today is based on more complete source data than were available for the “advance” estimate issued last month. In the advance estimate, the increase in real GDP was 2.4 percent (refer to “Updates to GDP”). The updated estimates primarily reflecteddownward revisions to private inventory investment and nonresidential fixed investmentthat were partly offset by an upward revision to state and local government spending.
The increase in real GDP reflected increases in consumer spending, nonresidential fixed investment, state and local government spending, and federal government spending that were partly offset by decreases in exports, residential fixed investment, and private inventory investment. Imports, which are a subtraction in the calculation of GDP, decreased.
The revision according to the BEA, “reflected a smaller decrease in inventory investment and an acceleration in business investment. These movements were partly offset by a downturn in exports and decelerations in consumer spending and federal government spending. Imports turned down.” In short, everything was uglier,
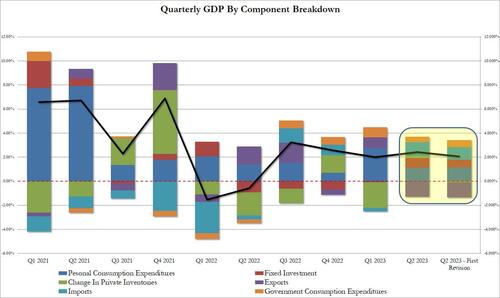
Taking a closer look at the data, we find the following changes to the bottom line:
Personal consumption added 1.14% to the bottom line print or just over half, up from 1.12% in the original print; annualized this comes out to 1.7% which was below the 1.8% estimate.
Fixed investment contributed 0.66%, down from 0.83%
Change in private inventories now subtracting 0.09% from the bottom line number, a big swing from the positive 0.14% print in the original estimate. And it will be revised even lower next month as more of the “shrink” emerges.
Net exports were also revised lower, with gross exports trimmed from -1.28% to -1.26%, while imports were revised from 1.16% to 1.04%
Finally the ever handy plug that is government consumption (which is a garbage concept since the government does not actually create anything of economic value in the economy but merely allocated graft and embezzlement of public funding), actually rose from 0.45% to 0.58% (of bottom line GDP). Without this revision, Q2 GDP would have printed below 2.0%
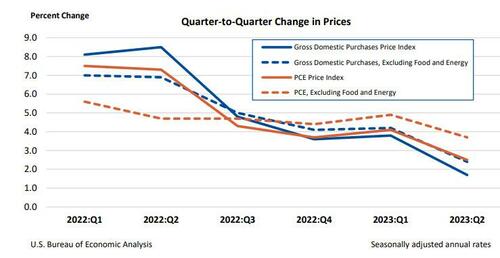
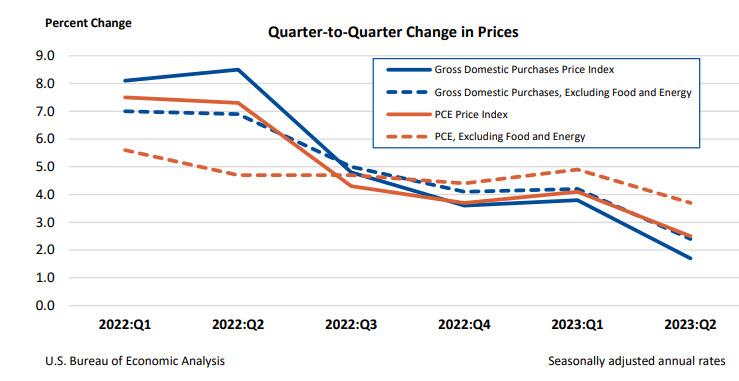
Separately, gross domestic purchases prices, the prices of goods and services purchased by U.S. residents, increased 1.7% in the second quarter after increasing 3.8 percent in the first quarter, above the 1.6% estimate last month but below the consensus 1.8%. Excluding food and energy, prices increased 2.4% after increasing 4.2%.
Personal consumption expenditure (PCE) prices increased 2.5% in the second quarter after increasing 4.1% in the first quarter. Excluding food and energy, the PCE “core” price index increased 3.7% after increasing 4.9%. This number was also revised lower from 3.8% and missed estimates of 3.8%.
Finally, the BEA reported corporate profits decreased 0.4% at a quarterly rate in the second quarter after decreasing 4.1% in the first quarter. Profits of domestic financial corporations decreased 12.1% after decreasing 2.3 percent. Profits of domestic nonfinancial corporations increased 0.9% after decreasing 5.0 percent. Profits from the rest of the world (net)increased 4.4 percent after decreasing 2.0 percent. Corporate profits decreased 6.5 percent in the second quarter from one year ago.
Needless to say, all this is a far cry from the rebound in corporate profits that companies themselves reported in their various GAAP and non-GAAP metrics, which is to be expected in a world where there is now an uncrossable chasm between economic data and its government fabrications.
Then we have M2 Money collapsing, down -3.7% in July. Longest, deepest contraction of money suppy since 1933.
Biden, making Zelenskyy rich again!! The US bought Zelenskyy a new villa! “The document indicates that the villa was purchased by Zelenskyy’s mother-in-law in May 2023. The price of the villa is 150,000,000 Egyptian pounds or approximately $4,850,000.” Thanks Biden!!! America last!
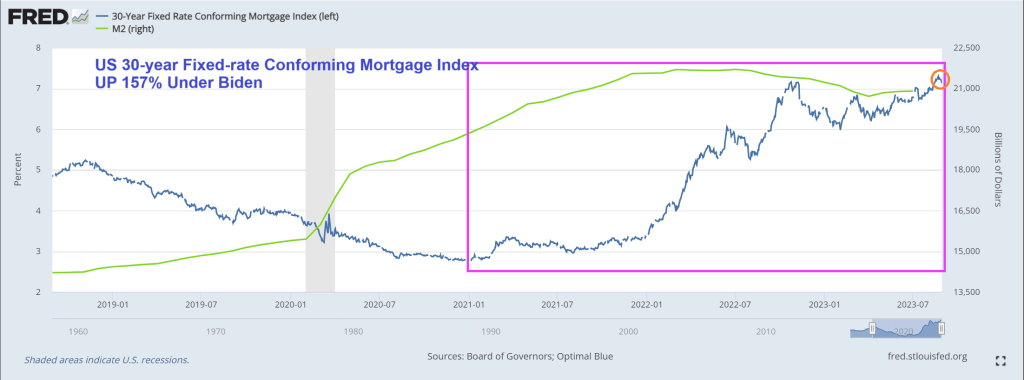
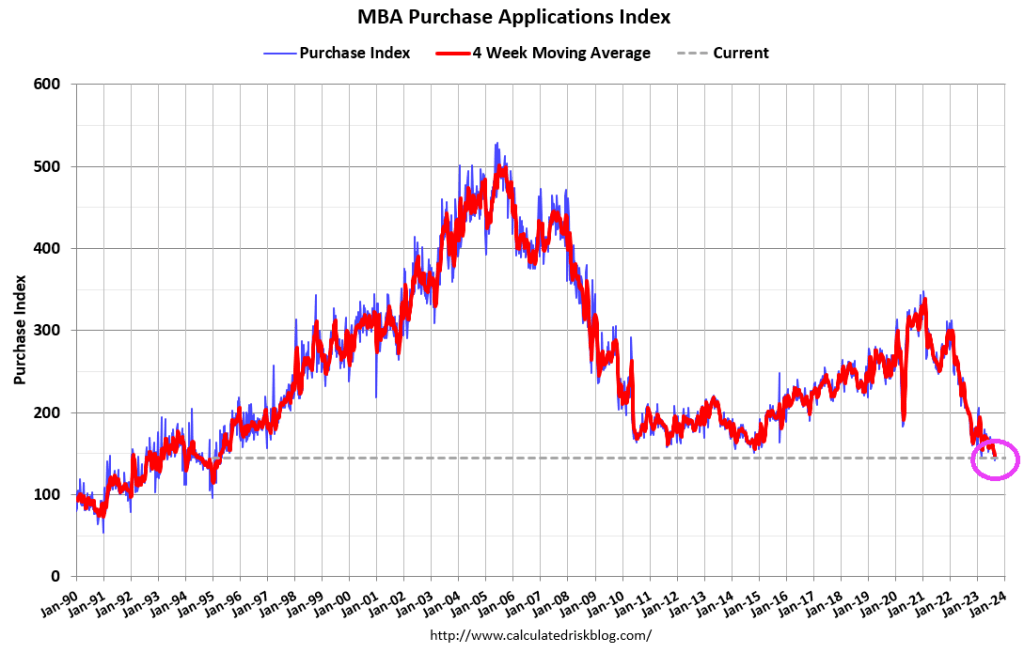
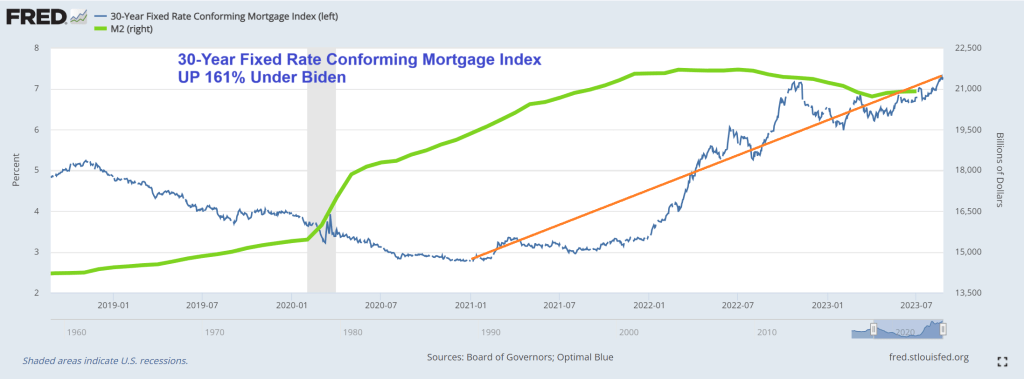
I wonder if Biden will use his writeboard to brag about the 30-year mortgage rate rising 157% under his economic Reign on Error? Aka, Bidenomics.
Mortgage applications increased 2.3 percent from one week earlier, according to data from the Mortgage Bankers Association’s (MBA) Weekly Mortgage Applications Survey for the week ending August 25, 2023.
The Market Composite Index, a measure of mortgage loan application volume, increased 2.3 percent on a seasonally adjusted basis from one week earlier. On an unadjusted basis, the Index increased 1 percent compared with the previous week. The Refinance Index increased 3 percent from the previous week and was 28 percent lower than the same week one year ago. The seasonally adjusted Purchase Index increased 2 percent from one week earlier. The unadjusted Purchase Index decreased 0.3 percent compared with the previous week and was 27 percent lower than the same week one year ago.
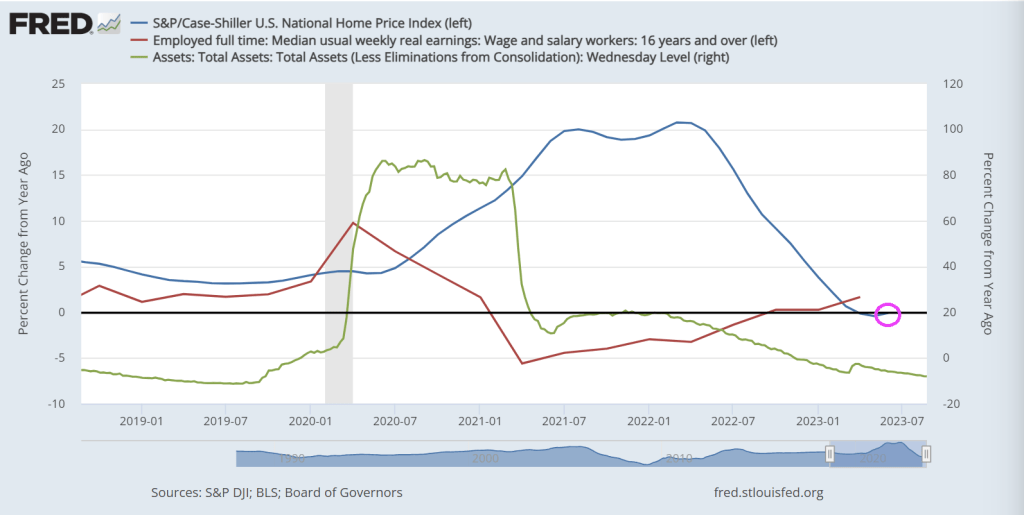
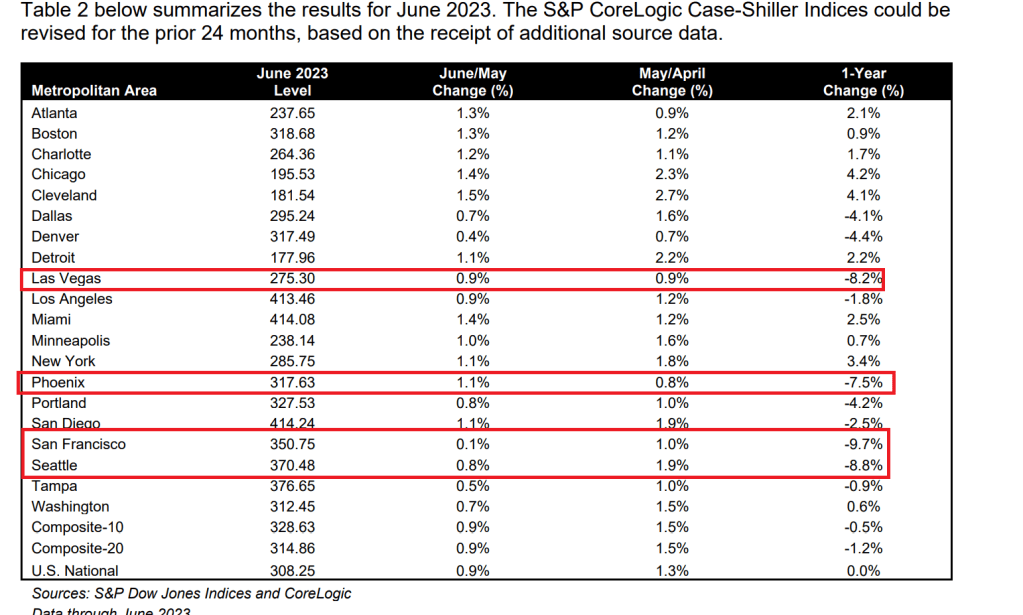
The US housing market is truly bizarro world! San Francisco and Seattle are down near 10% year-over-year (YoY) while Chicago and Cleveland lead in price gains.
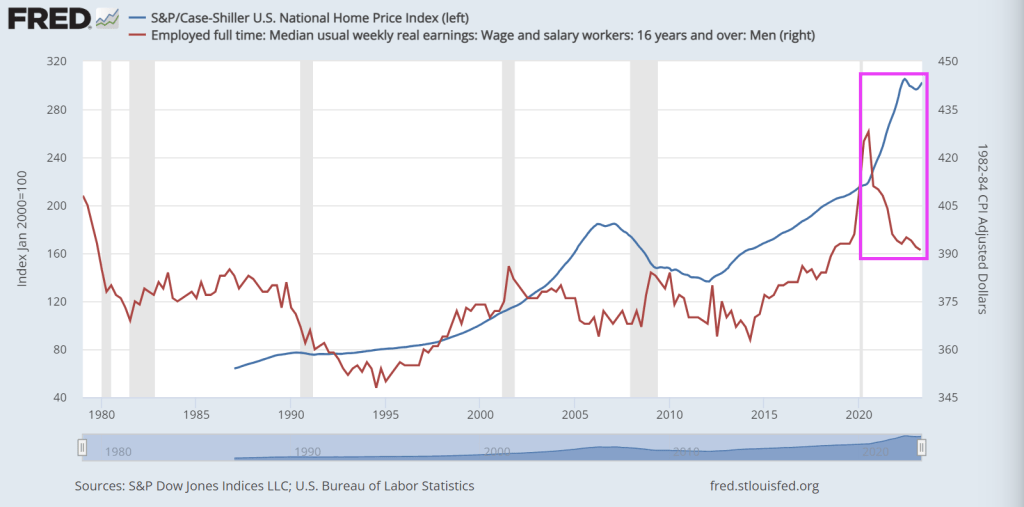
Notice that The Fed’s balance sheet is slowly unwinding (green line) and real weeky “usual” earnings are finally positive after two long years of decline (red line). No growth or loss in home prices at the national level.
How about at the metro level? Chicago, Cleveland, and New York again led the way reporting the highest year-over-year gains among the 20 cities in June. Chicago remained in the top spot with a 4.2% year-over-year price increase, with Cleveland in at number two with a 4.1% increase, and New York held down the third spot with a 3.4% increase. There again was an even split of 10 cities reporting lower prices and those reporting higher prices in the year ending June 2023 versus the year ending May 2023; 13 cities showed price acceleration relative to the previous month.
But The West is where home prices fell and fell hard. The biggest losers were San Francisco (-9.7% YoY) and Seattle (-8.8% YoY). Bubble cities of Phoenix (-7..5% YoY) and Las Vegas (-8.2% YoY) round out the four biggest losers in the nation.
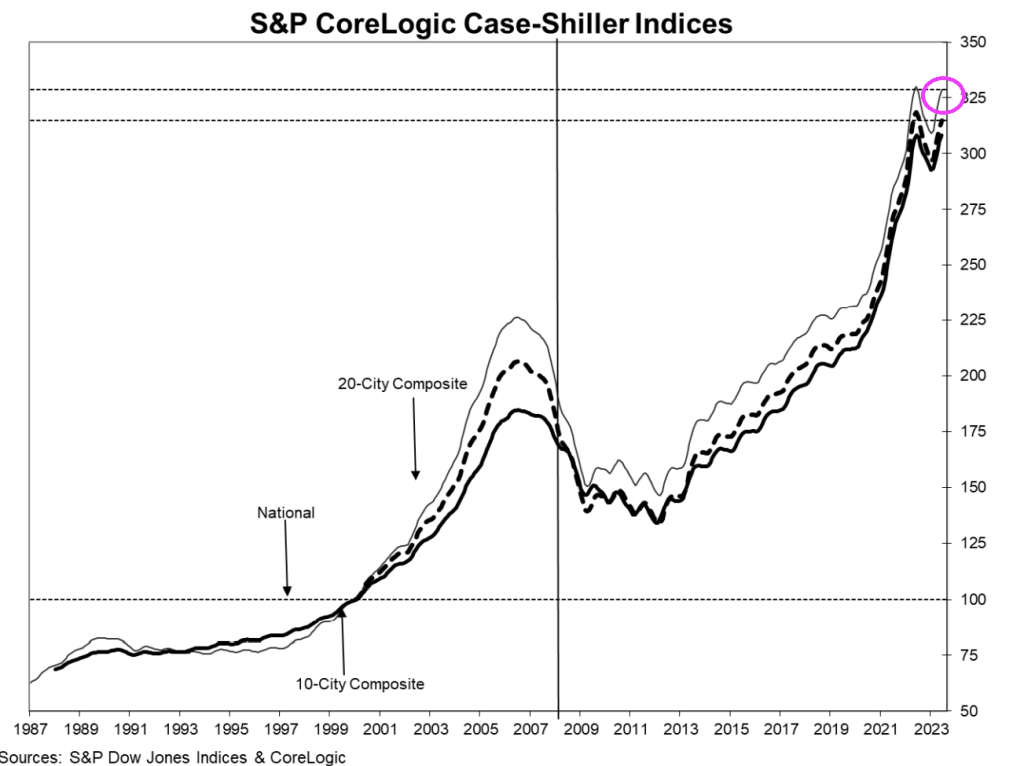
The really interesting chart show the surge in home prices following The Great Recession of 2008 and ensuing financial crisis and post Covid. Of course, the commonality in the surge is the massive expansion of money supply thanks to a hyperactive Federal Reserve.
The puppetmaster of bizarro world? The Federal Reserve!
The 30-year conforming mortgage rate is currently 7.23%, up 161% under Biden and Bidenomics (code for massive Federal spending on green initiatives that go to large Democrat donors and Ukrainian oligarchs). Meanwhile, M2 Money supply is up 9.4% under Biden.
At the same time. home prices are UP 26% under Biden while Real Median Weekly Earnings are DOWN -5%.
On a sad note, it looks like The Federal government is starting to rattle its Covid saber just in time for the 2024 Presidential election. Odds are the US will ramp up online voting, early voting, etc. Think of John Fetterman (aka, Walter White’s twin brother) and the Pennsylvania voting experience.


You must be logged in to post a comment.