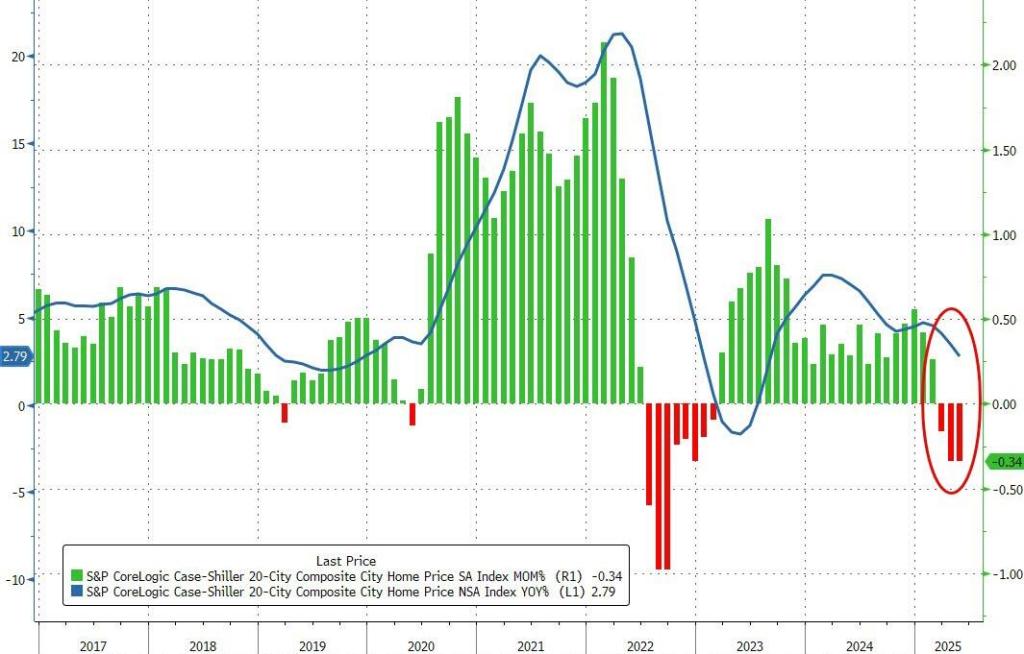
US home prices fell for the 3rd straight month In May. The MoM decrease in the seasonally adjusted (SA) Case-Shiller National Index was at -0.29% (-3.5% annual rate).
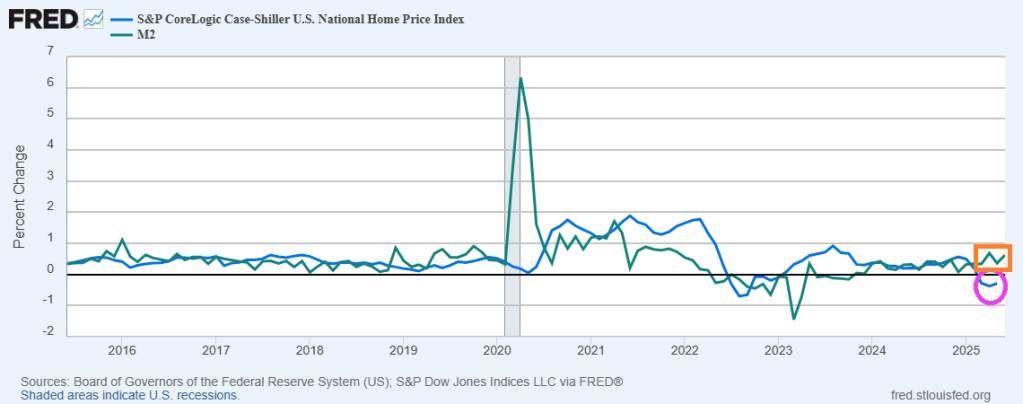
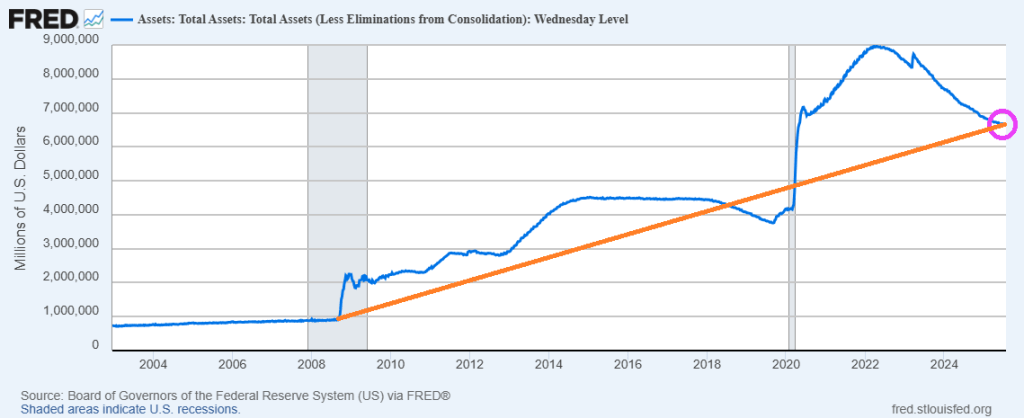
Despite continued money printing by The Fed.
Confounded Interest – Anthony B. Sanders
Financial Markets And Real Estate
US home prices fell for the 3rd straight month In May. The MoM decrease in the seasonally adjusted (SA) Case-Shiller National Index was at -0.29% (-3.5% annual rate).
Despite continued money printing by The Fed.
kkk
Nobody pisses away money like Washington DC.
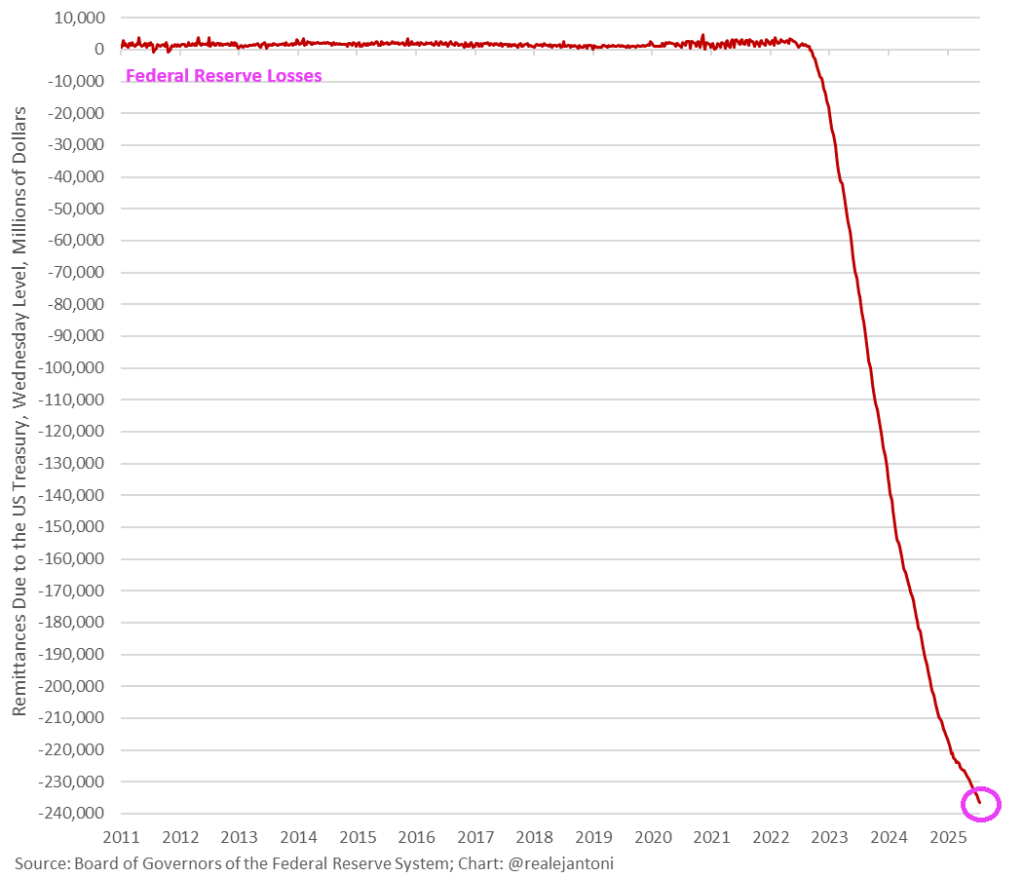
The Fed lost another $653 million last week, bringing total realized losses to more than $236 billion since Sep ’22.
Nothing has been the same since the financial crisis and Bernanke’s overreaction.
California Governor “Greasy Gavin” Newsom wants to be President of the USA. He will fit right in with the other spendthrifts in Washington DC.

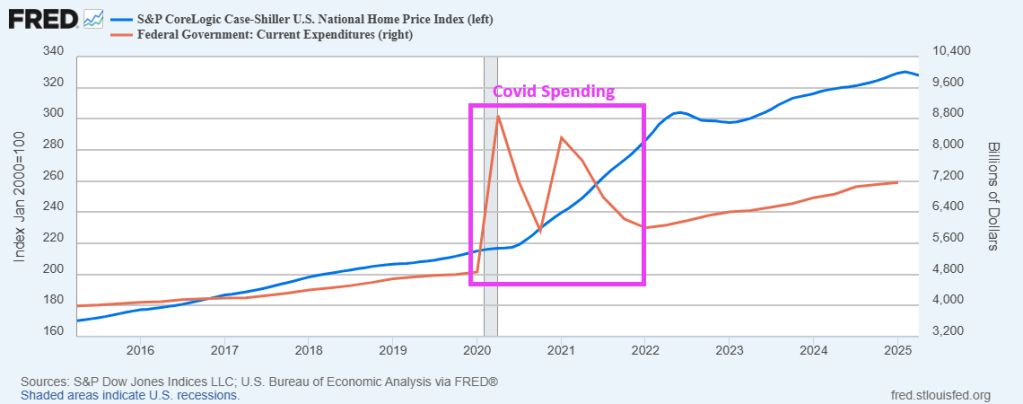
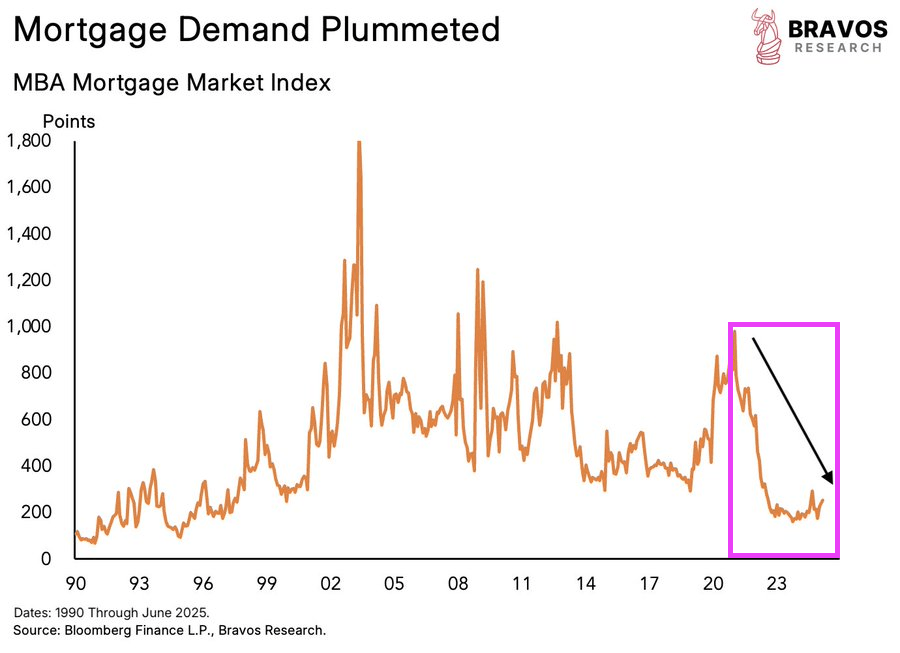
China unleashed the Wuhan virus on the globe, Anthony Fauci convinced Congress to binge spend like drunken sailors on Covid prevention and relief. Homes prices soared, mortgage demand sank and nothing has been the same.
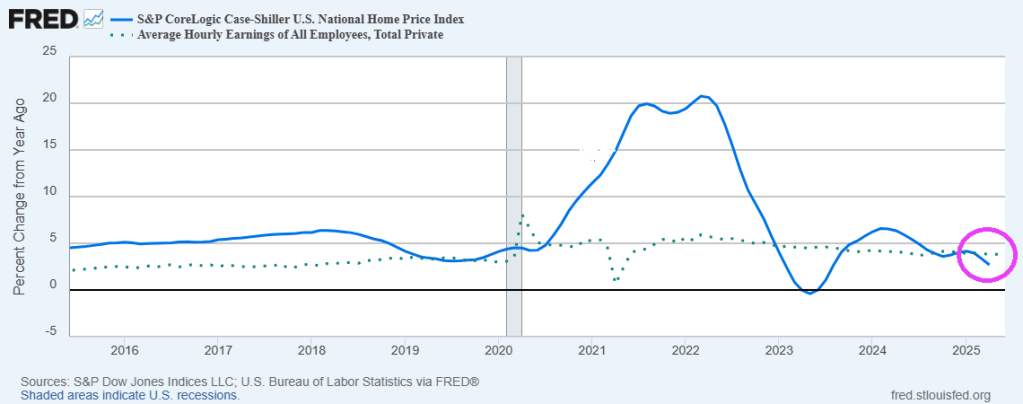
Here is a chart of the Case-Shiller national home price index post Covid outbreak and the hysterical overreaction by Congress and the Administration (including Anthony Fauci).
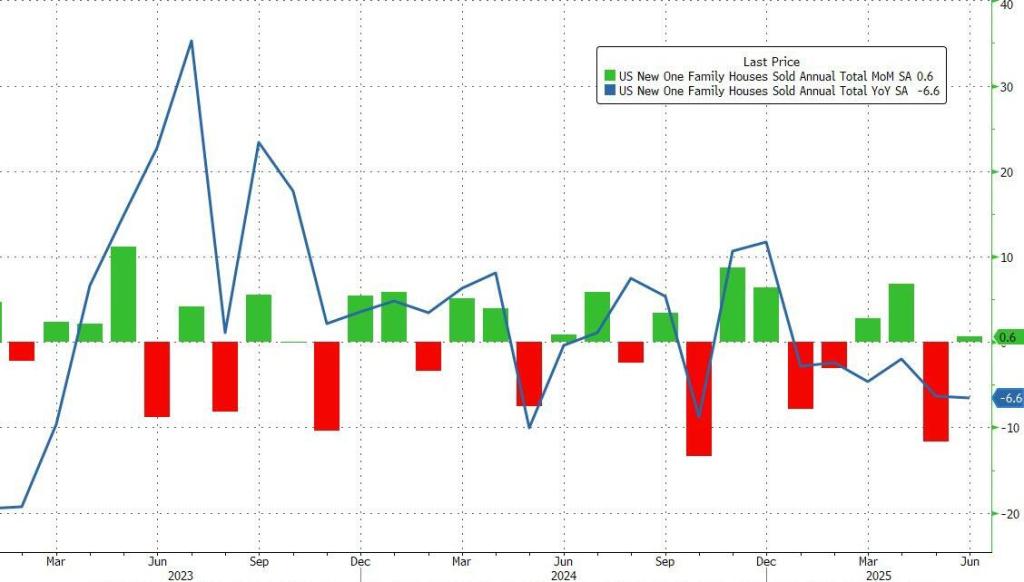
Another example? New home sales are down 6.6% YoY.
Who do we blame? China? Yes. Anthony Fauci? Yes. Congress? Yes.

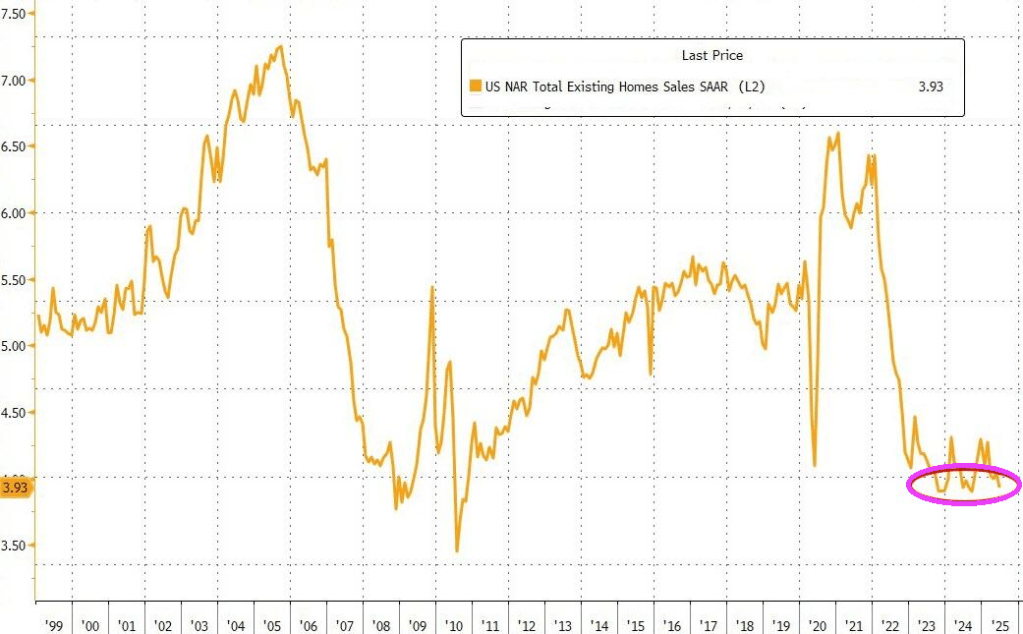
US existing home sales dropped 2.7% MoM (vs -0.7% MoM expected) in June leaving existing home sales unchanged year-over-year.
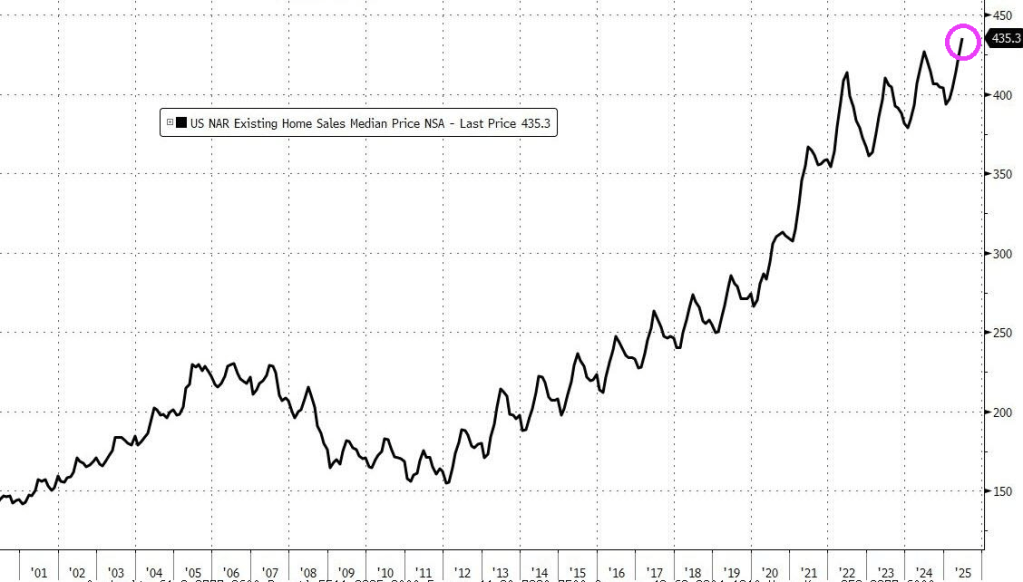
The median sales price increased 2% in June from a year ago to a record high of $435,300.
Meanwhile, The Fed keeps on printing money.

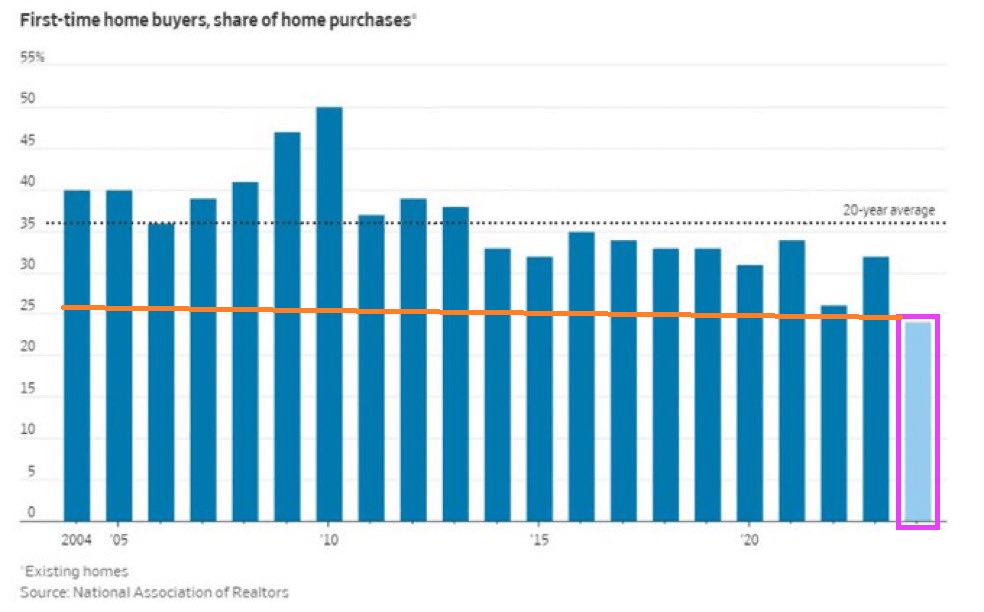
This is a new world for housing and mortgage finance. Outrageous, unafforable housing for millions.
Housing in the USA is simply unaffordable!
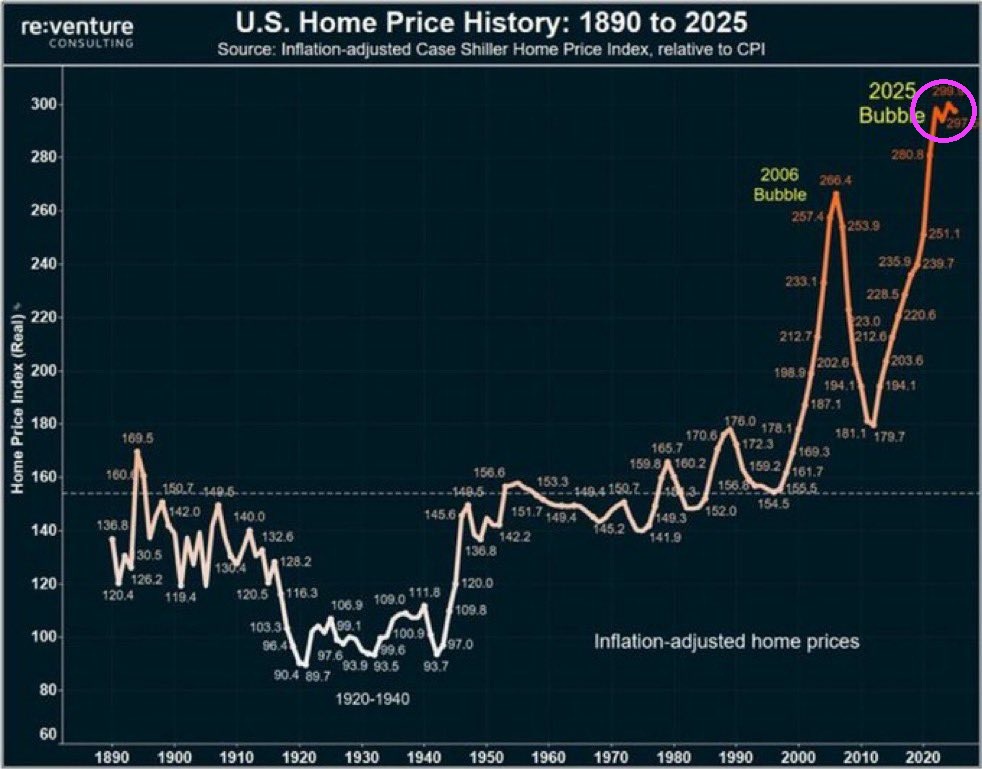
House prices have exploded since Covid, primarily due to massive Federal spending.
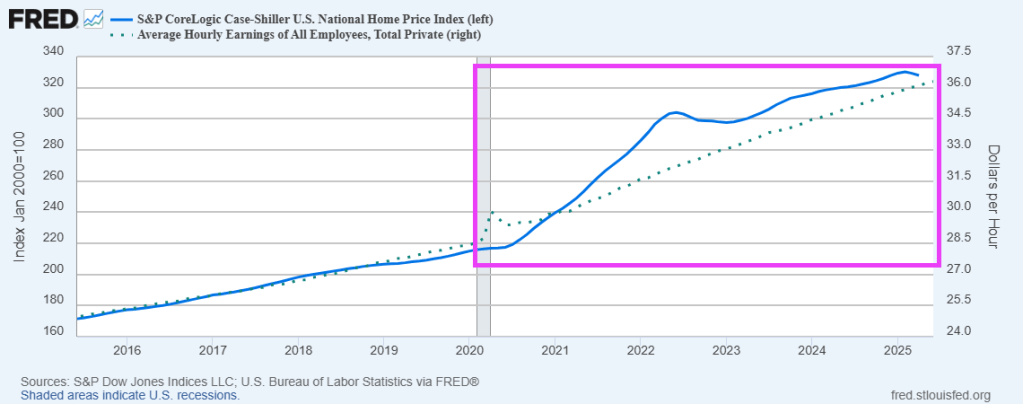
In terms of YoY growth, average hourly earning are exceeding home price growth.
Affordable housing is difficult to achieve at the national level since local politicians control local economies badly. Think LA Mayor Karen Bass who is taking Pacific Palisades which recently burned down and wants to build multifamily housing for low income households. This reminds me of the folly in Long Branch New Jersey where they built low income housing on the beach front. It failed, of course.
Doctor, doctor, we’ve got a bad casing of unaffordable housing.
Here is a picture of US affordable housing policy.

US prices rose 0.3% MoM in June according to the Bureau of Labor Statistic (BLS). And on a YoY basis, inflation rose 2.7% while core inflation rose 2.9%.

Supercore inflation was up 3.017% YoY.

As of May, import prices rose a scant 0.0% MoM and 0.2% YoY.

Shelter rose 3.8% YoY in June while gas utilities rose 14.2%.

And on this news, the yield on 30-year Treasuries rose 5%.

Not a chance that Foul Powell will cut rates now.

Thank goodness “Statist Joe” Biden is gone. Kamala Harris is still lingering around the edges, while the mortgage and housing markets are still suffering from the Biden/Harris regulatory overreach.
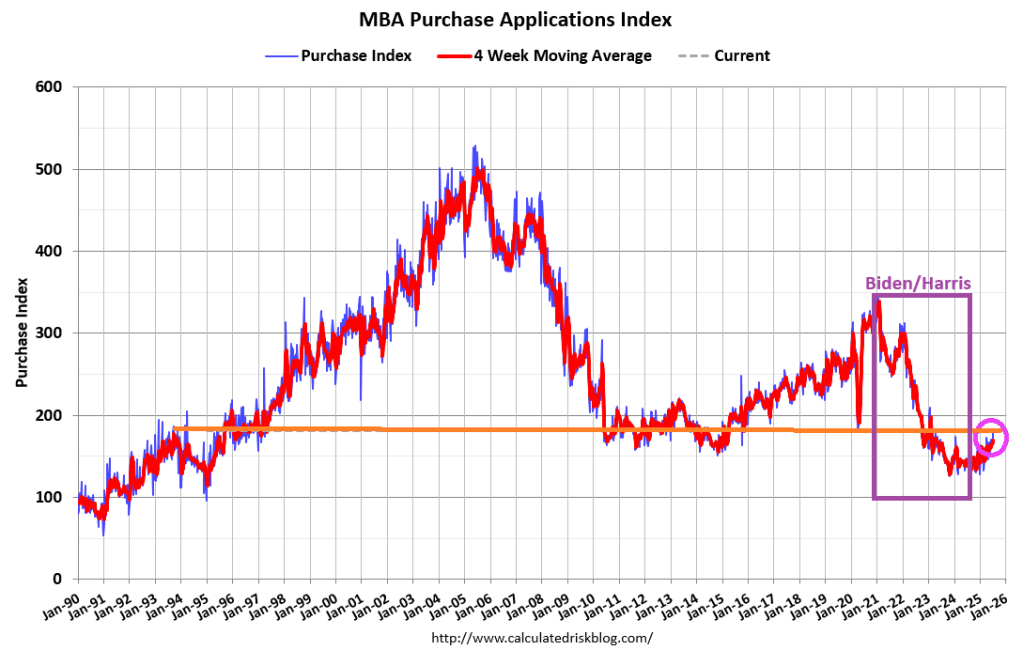
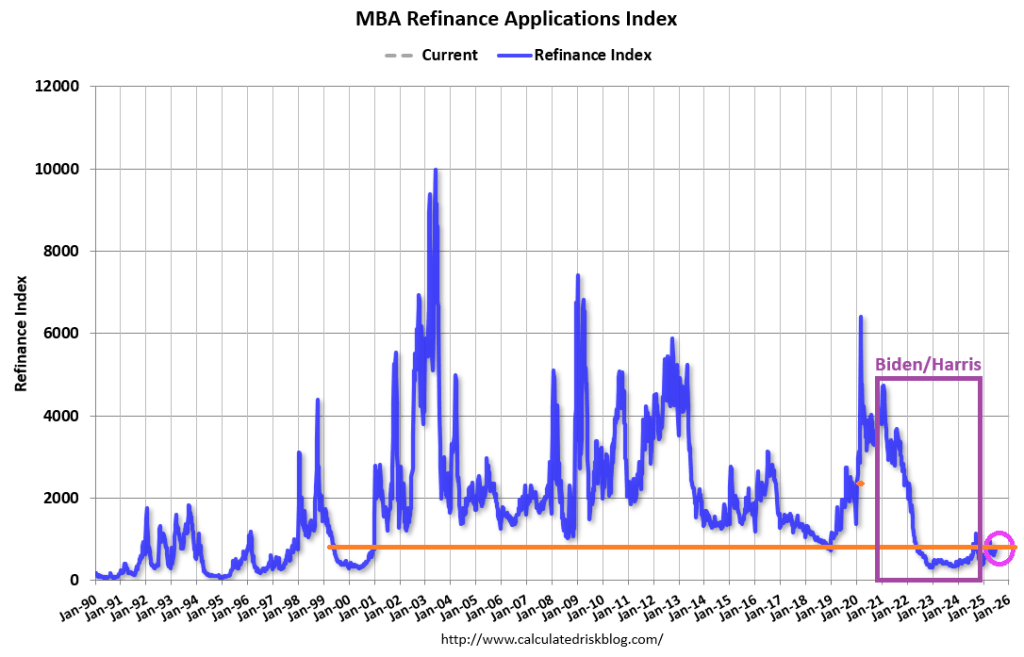
Mortgage applications increased 9.4 percent from one week earlier, according to data from the Mortgage Bankers Association’s (MBA) Weekly Mortgage Applications Survey for the week ending July 4, 2025. Last week’s results included an adjustment for the July 4th holiday.
The Market Composite Index, a measure of mortgage loan application volume, increased 9.4 percent on a seasonally adjusted basis from one week earlier. On an unadjusted basis, the Index decreased 13 percent compared with the previous week. The seasonally adjusted Purchase Index increased 9 percent from one week earlier. The unadjusted Purchase Index decreased 13 percent compared with the previous week and was 25 percent higher than the same week one year ago.
The Refinance Index increased 9 percent from the previous week and was 56 percent higher than the same week one year ago.
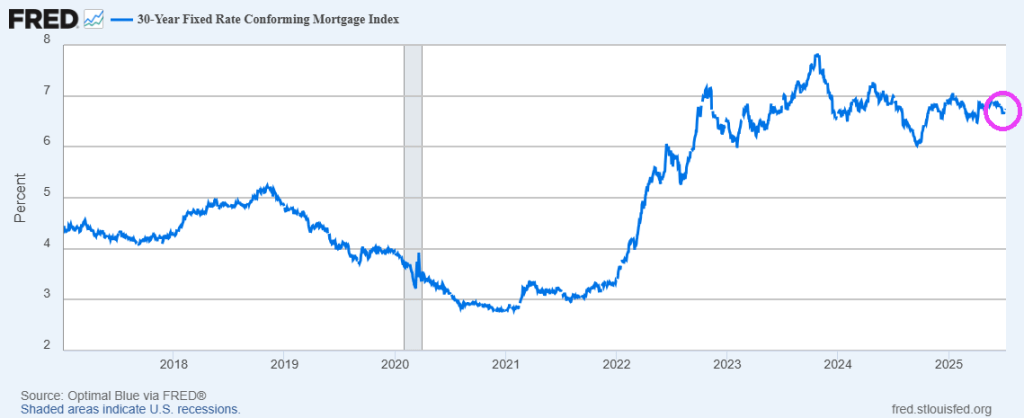
Mortgage rates moved lower last week, with the 30-year fixed rate decreasing to 6.77 percent, its lowest level in three months. After adjusting for the July 4th holiday, purchase applications increased to the highest level of activity since February 2023 and remained above year-ago levels.
Biden claims the foreign leaders have been calling him for advice. Here is one example.

I sure hope this isn’t a repeat of the financial crisis! But new homes for sale have ballooned to financial crisis levels.
Home sales have dropped below year-ago levels, presaging likely declines in mortgage supply and turnover. With completed-home inventories hitting post-global financial crisis (GFC) highs, regional surpluses are emerging as key home-price factors, setting the stage for widening pockets of price weakness in the months ahead.

Contributing to the glut of new homes for sale is the rising prices AND higher mortgage rates.

The US Treasury yield curve is flattening at the short-end (2-3 years) but remains unchanged at the long end (>= 20 years).

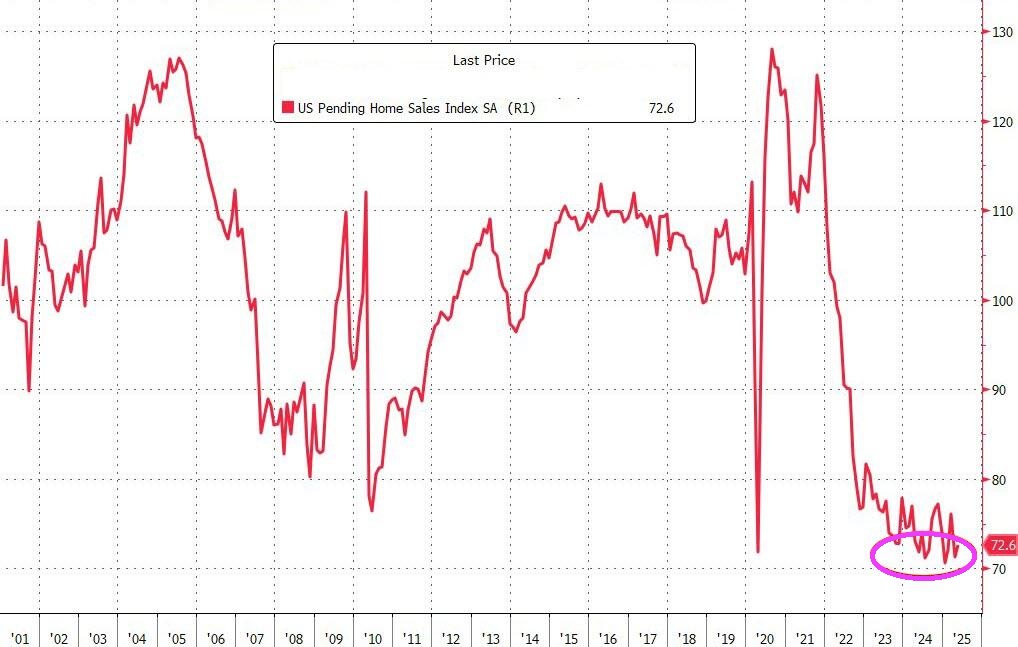
And pending US Home Sales remain low.
It will take a while to recover from Biden’s horrid economic follicies.


You must be logged in to post a comment.