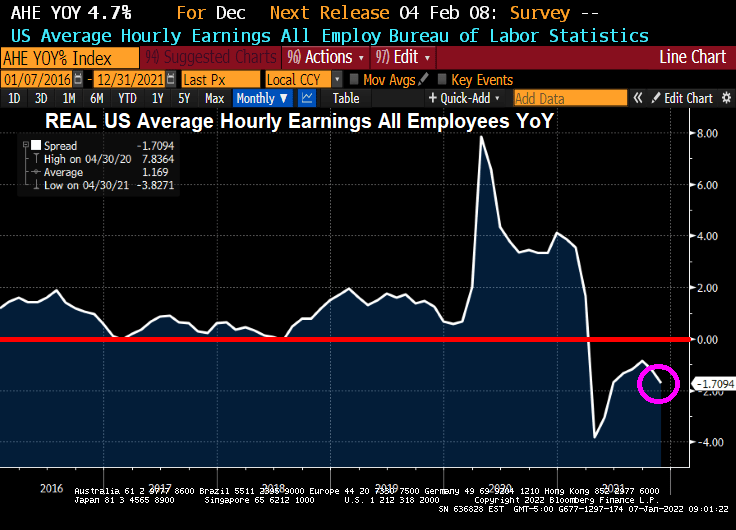
The November jobs report is out and the highlight is that US Average Hourly Earnings GREW at a rate of 4.7% YoY. Unfortunately, inflation is still raging resulting in REAL US Average Hourly Earnings DECLINING at a rate of -1.71% YoY.
REAL US home price growth is slowing and is at 12.856% YoY as REAL average hourly earnings slowed to -1.7094% YoY.
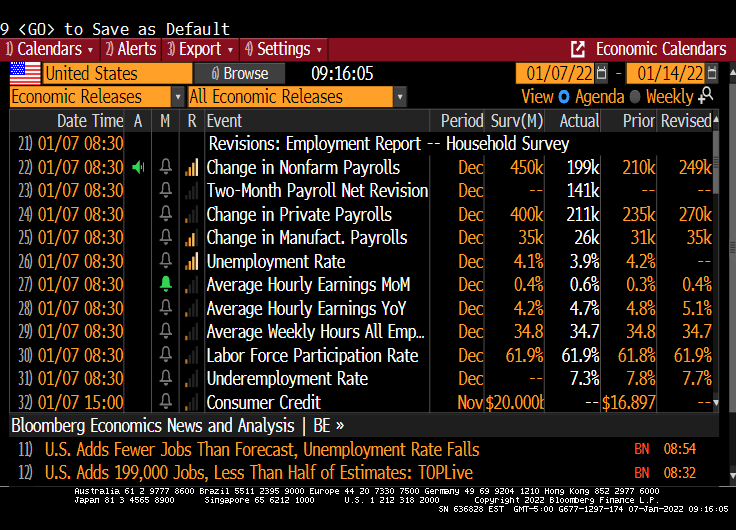
The lowlight of the November jobs report is that only 199K jobs were added versus the 450K jobs expected to be added. At least the unemployment rate fell to 3.9%.
WHERE we the jobs added? Leisure and hospitality led the way! Hey bartender.
Yes, REAL wage growth and REAL home price growth are slowing.
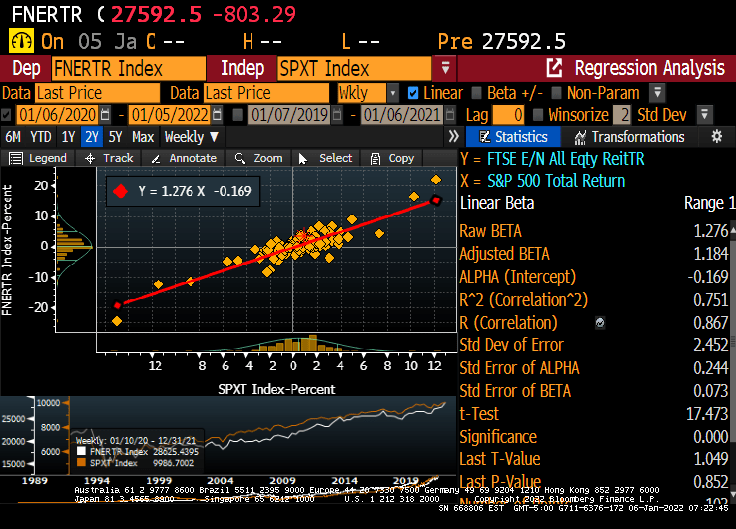
How about real estate investment trusts? The NAREIT all-equity index rose by 35.6% YoY while inflation rose at 6.8%. The S&P 500 index rose 28.9% YoY.
Of course, the NAREIT all-equity index has a beta of 1.276.
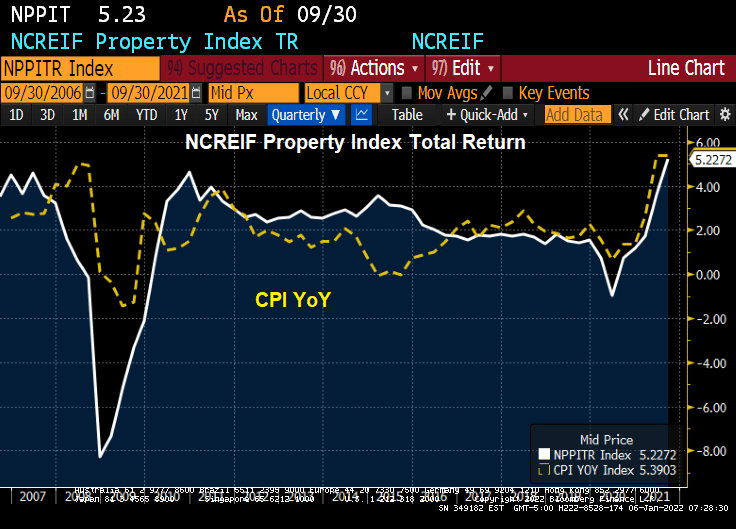
How about the NCREIF All-property commercial real estate index? For Q3, the NCREIF property index rose by 5.22%, less than the most recent inflation reading of 6.8%.
So for the past year, housing has beaten the pants-off inflation, REITs have earned a higher return than inflation, and the NCREIF index seems to be rising slower than inflation (but with its lag problems, I anxiously await the Q4 numbers which should be higher.
When we look at the Buffett Indicator, we can see how The Federal Reserve’s loose monetary policies (or follycies) are driving up stocks to unsustainable levels that may not survive without The Fed’s “Do Ho Big Bubble Policies.”
How about the Shiller CAPE (Cyclically-adjusted Price/Earnings) ratio? While not up to dot.com levels yet, the Shiller CAPE ratio is climbing with the assistance of The Fed and their insane money printing.
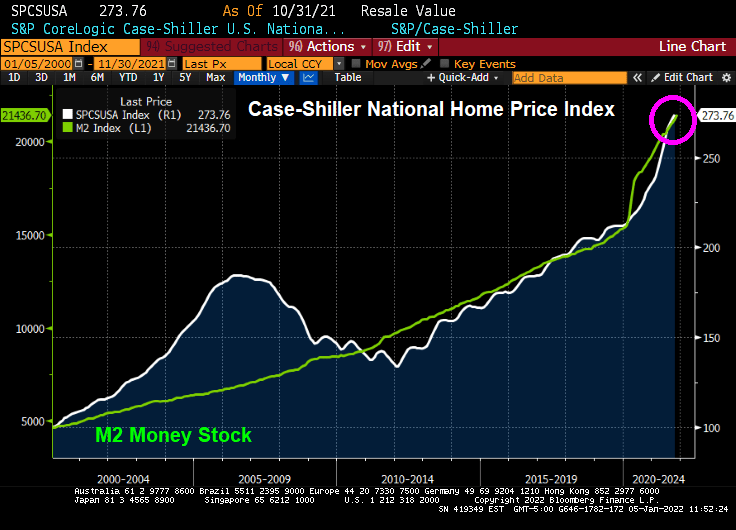
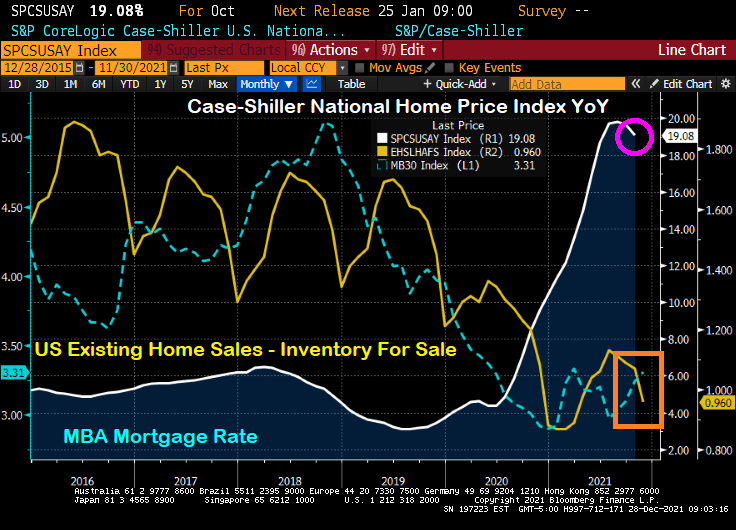
How about house prices? The Case-Shiller National home price index is far above the level last scene during the housing bubble of 2005-2007. Again, with a little help from The Federal Reserve.
I can’t wait to see how the equity market and housing market reacts IF The Fed actually follows through with reducing monetary stimulus. Probably not just adding more stimulus, just reinvesting the Treasury and MBS proceeds (aka, not shrinking the balance sheet).
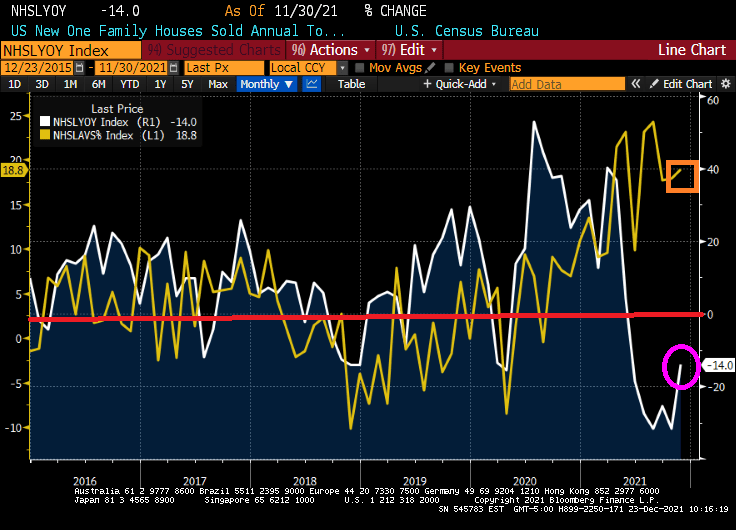
The inventory of existing homes for sale in the US is extremely low. The lack of available inventory to buy is helping drive home prices through the roof.
Available inventory for purchase peaked back in the 2007-2008 period during the dreaded housing bubble in the US. But inventory for sale has declined ever since. Why?
I think it has something to do with the aging of the US population. Look at this chart of Existing Home Sales Inventory against the growth 65+ years old.
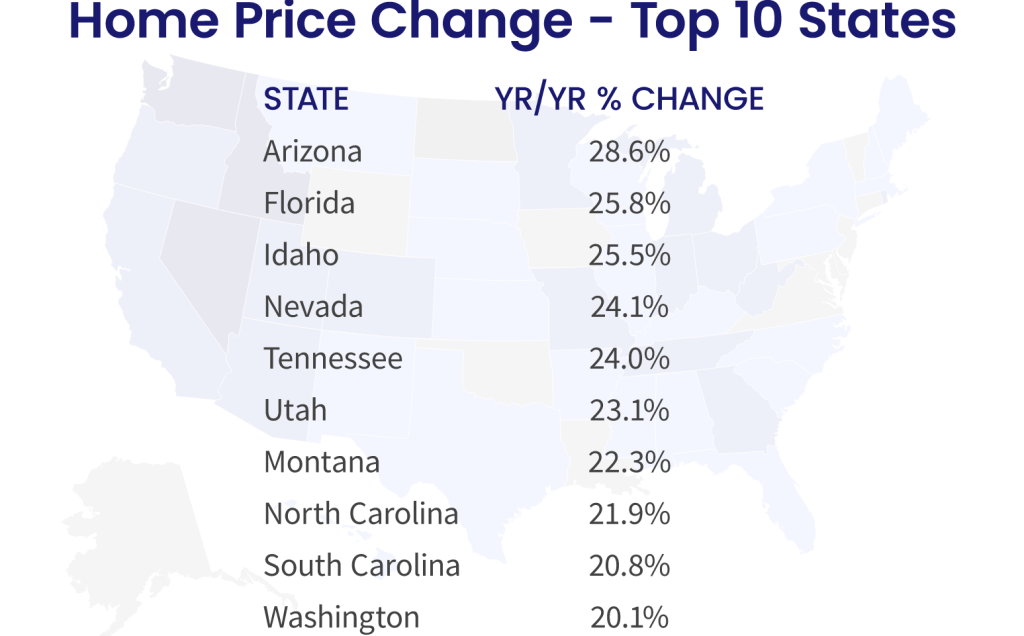
Perhaps households 65+ are resisting moving to states like Florida and Arizona as they had in the past, leaving them stationary in their dwelling.
Another reason for the bewildering lack of inventory is the growth of the HECM (Home Equity Conversion Mortgage) that allows elderly households to drain the equity in their home rather than have to sell to utilize it. But HECMs have not taken-off sufficiently to explain the mystery of the missing inventory.
So we know that housing inventory is very low and we know that the number of Americans 65 and over is increasing. But we do not know the reason for the decline in inventory.
Happy New Year! And Treasuries are off to fast start with investors bailing on Treasuries and buying stocks. AND the expectation that The Fed will raise rates 3 times this year.
The 10-year Treasury Note yield rose above 1.60% this morning.
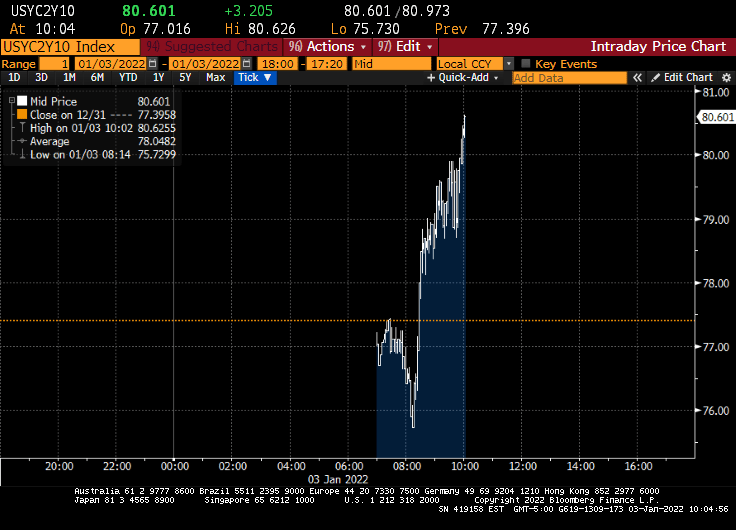
And the US Treasury 10Y-2Y curve rose to 80.601 basis points.
Fed Funds Futures data is showing 3 rates hikes in 2022. May, September and December.
The Fed Dots project is definitely showing an upward trend in the Fed Funds Target rate with FOMC member forecasting the median target rate to be above 2% by 2024.
Of course, Fed reverse repo activity grew to an all-time high (but it is expected to pare-back).
How about mortgage rates? I expect mortgages rates to rise over 2022 as the 10-year Treasury Note rises.
Cautionary note: The Fed is likely to protect economic growth and ignore inflation. So I expect FOMC will continue to reinvest prepayments into Treasury and MBS, pro-rata to the current portfolio.
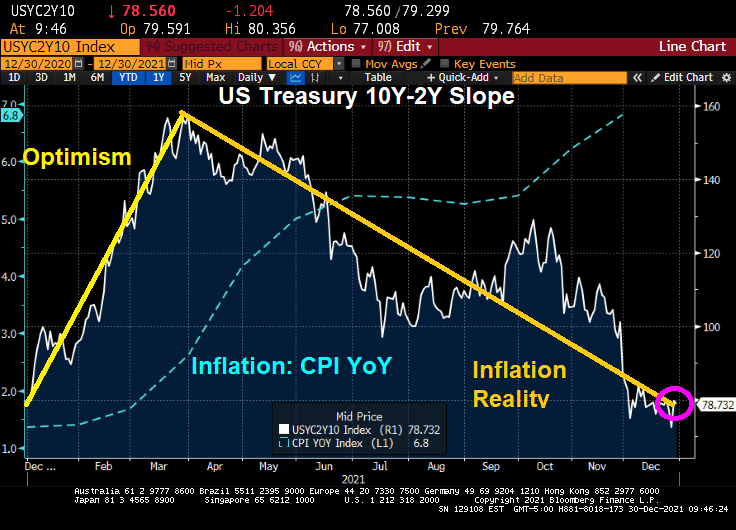
It has been almost a year since Joe Biden has been President of the United States and a Democrat majority took control of The House and Senate. And what has happened to the US Treasury yield curve slope over the past year?
The yield curve is back where it started. There was the “honeymoon effect” where the curve slope rose. After all, Biden was Obama’s Vice President for 8 years and The Democrats has promised so much in the 2020 election. But by early April, the reality of the massive Federal spending (combined with Fed Stimulypto) began showing what was feared: inflation (blue line) started to grow at a rapid rate of speed. With inflation now at 6.8% YoY,
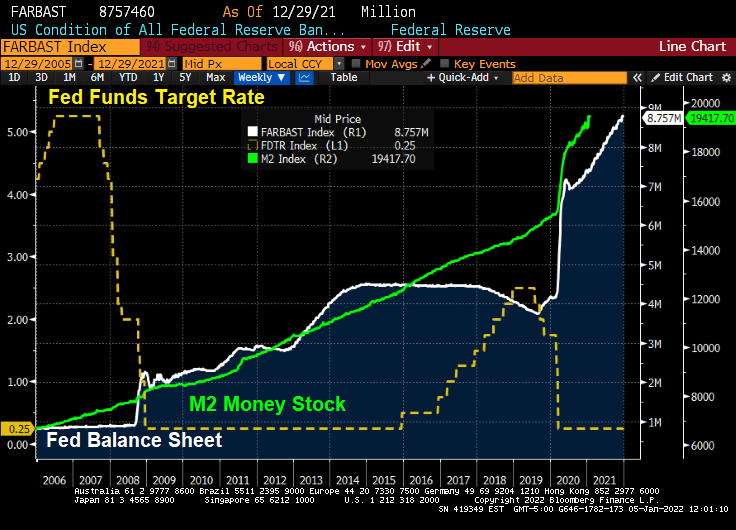
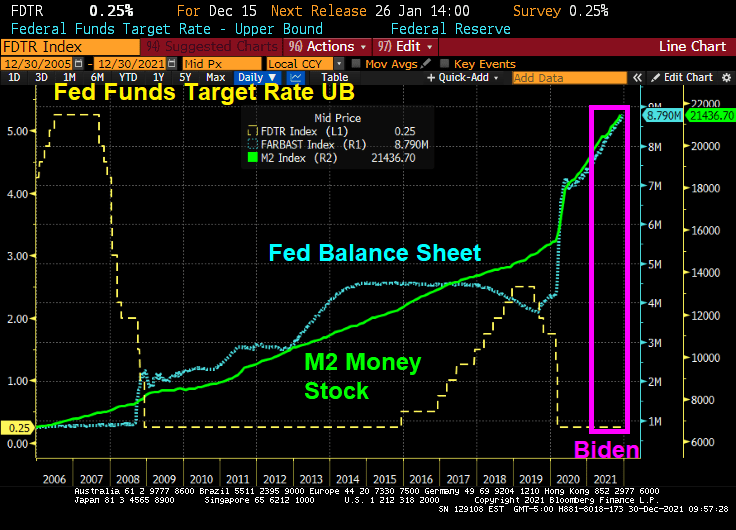
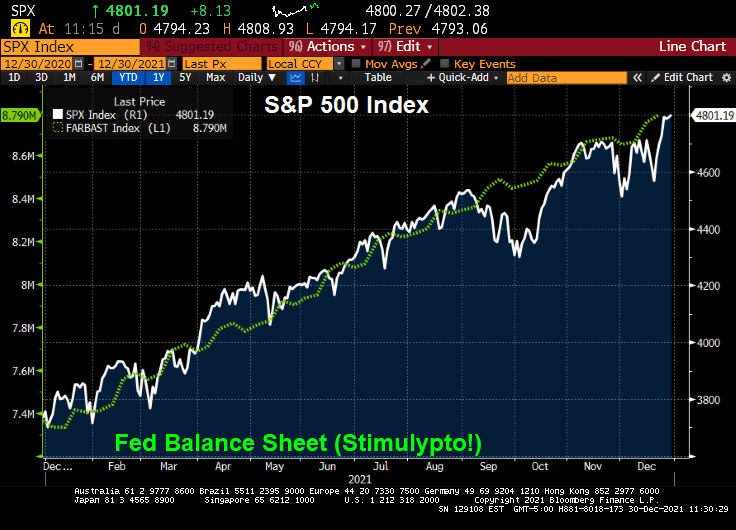
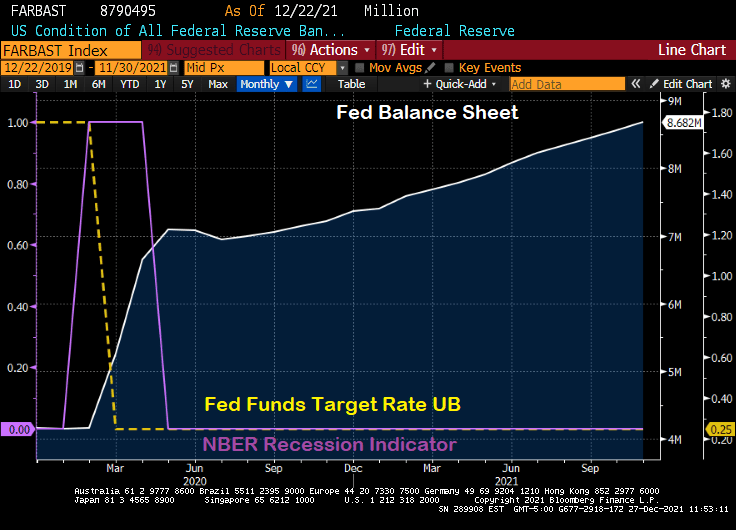
In fairness to Biden, The Federal Reserve has been overstimulating the economy since The Federal Reserve since Ben Bernanke and the Fed Open Market Committee (FOMC) dropped the hammer on The Fed Funds Target Rate once the rate hit 5.25% in September 2007. They kept cutting it reached 25 basis points (or 0.25%) in December 2008. In August 2008, Bernanke and Company began their “Quantitative Easing” or asset purchasing programs. Between The Fed’s Target Rate and QE, The Fed has continued to overstimulate markets ever since. Under Biden, The Fed Funds Target Rate remains at 0.25% and The Fed’s Balance sheet has grown to $8.79 Trillion (bigger than the entire economies of Japan and Germany put together!).
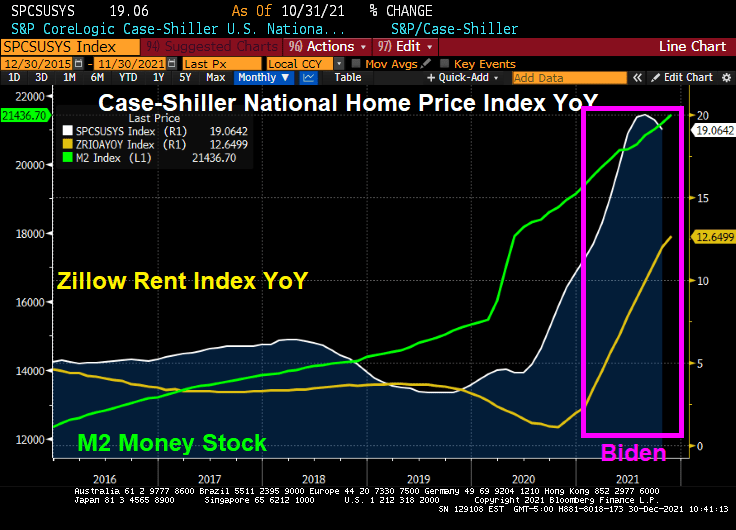
How about housing? Home prices are growing at 19% YoY while rents are growing at 12.65% YoY.
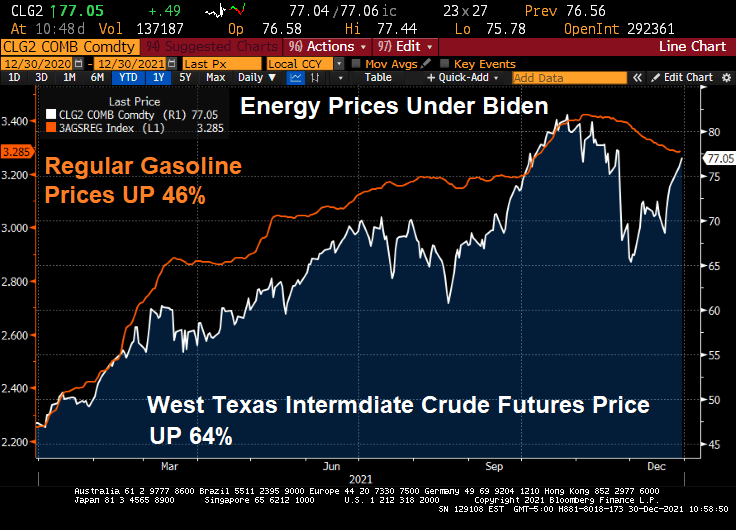
Energy prices have risen dramatically under Biden. Gasoline is up 46% despite a slight reprieve recently. WTI crude prices are up 64%.
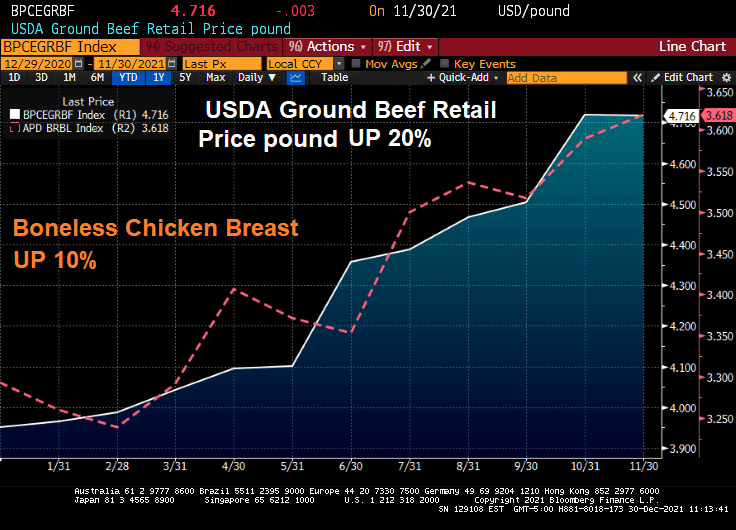
How about food? Beef prices are up 20% and chicken prices are up 10%.
On a positive note, the S&P 500 index has soared … thanks has soared during Biden’s term thanks to Fed stimulus and Federal spending on COVID.
The Build Back Better Act if passed (in its entirety or on a piecemeal basis) will lead to even MORE inflation.
Perhaps Biden’s spokesperson Jen Psaki can recreate the Biden Administration as a lovable, hilarious family like the comic strip Gasoline Alley with old Joe Biden as Skeezix. And insider-trading star, House Speaker Nancy Pelosi as the family matriarch.
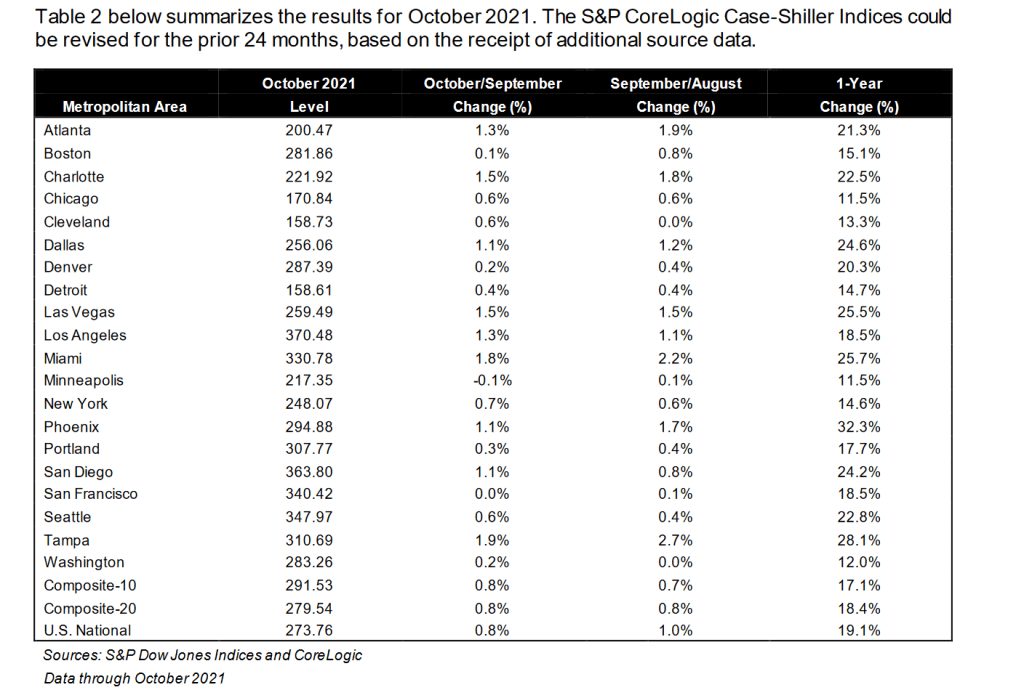
There is a lot going on in the US housing market. Excessive monetary stimulus keeping mortgage rates low, historically low inventory available for sale, and FOMO (fear of missing out … on rapidly rising home prices).
By metro area, Phoenix AZ once again leads with 32.3% YoY. Minneapolis MN is the slowest growing metro area in terms of home prices at 11.5% (tied with Chicago, IL).
The global economy has certainly been turned on its head by the COVID outbreak in early 2020. Not so much by the virus itself, but by Central Bank hysteria in terms of rate lowering and balance sheet expansion. Which The Fed has not yet unwound.
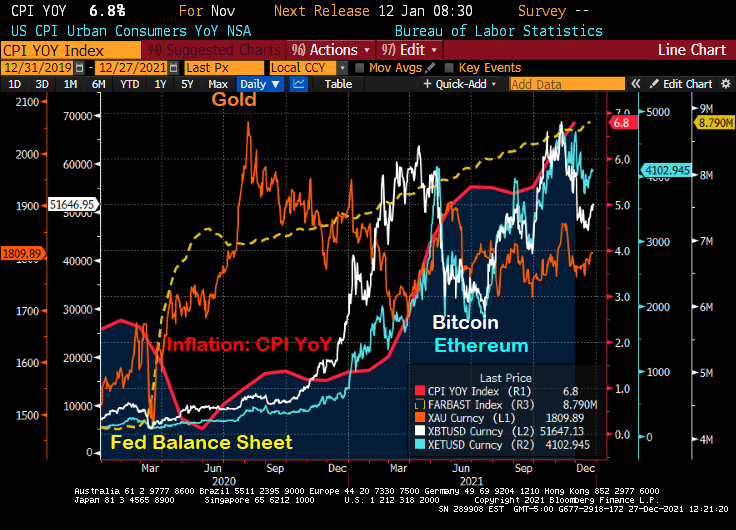
Let’s look at what has happened since the mini-recession caused by COVID in early 2020. The shortest recession in US history, a measly 2 months. The Fed expanded its balance sheet from $4.17 million in February 2020 to $8.79 million today. That is, The Fed over doubled the size of their balance sheet in reaction to the shortest recession in US history. Overreaction much?
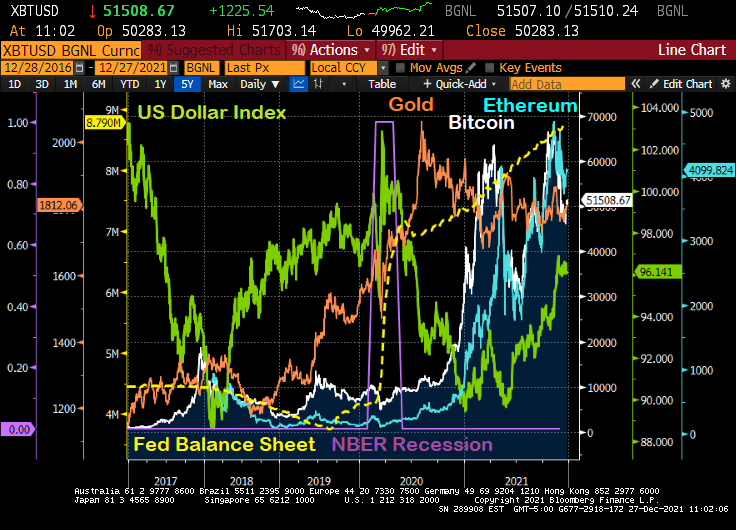
What has happened since the mini-recession and The Fed’s massive overreaction?
First, gold (gold line) surged then calmed down. Then cryptocurrency Bitcoin (while line) surged, then calmed down, then surged again only to calm down again. Then crypto Ethereum surged, calmed, surged, calmed. Meanwhile the US Dollar Index crashed only to start rising again.
The Fed’s overreaction and failure to withdraw excessive stimulus has led to the rise of alternatives to the deflating dollar due to inflation.
When will The Fed ACTUALLY start removing the overreaction stimulus? Let’s get it started.
Perhaps only April Ludgate can kill The Fed’s overreaction stimulus.


You must be logged in to post a comment.