First, banks are stashing cash with the New York Fed on an “overnight basis” although it is looking pretty permanent to me. Repos (or repuchase agreements) soared to $2.55 TRILLION as of 12/30/22.
But this morning we see the US Treasury 10-year plummeting -15 basis points. As I used to tell my University of Chicago, Ohio State and George Mason finance students, any 10 basis point shift (plus or minus) is a big deal. Something is happening.
The 10-year Treasury yield plunging -15 bps is a “good thing” for the mortgage market in that US mortgage rates will likely follow suit and fall.
As we begin 2023 (and I am still bummed-out over Ohio State University losing a nail-bitter to Georgia in the Peach Bowl), we need to look at the condition of one of the most important sectors of the US economy.\, housing.
If we look at the US Housing Leading Growth index (courtesy of RecessionAlert.com) has slumped to its worst reading since the recessions of 1982 and 2008.
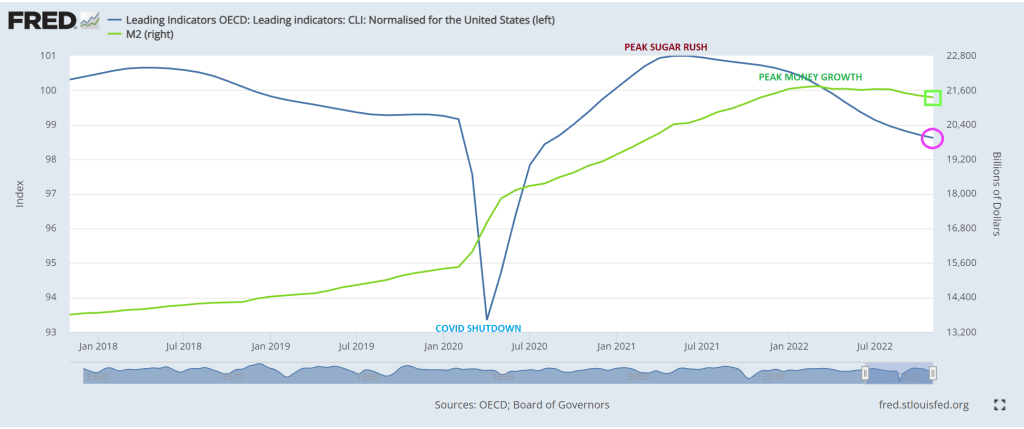
And then we have the OCED leading indicators for the US falling as M2 Money growth slows.
My favorite chart shows US home price growth falling faster than University of Michigan football team’s national championship home hopes.
Will this prompt The Federal Reserve to pivot? Only time will tell.
We all know that US housing weakened in 2022 with inflation and The Fed’s counterattack. But what about equity real estate investment trusts (REITs) and commercial real estate (NCREIF)?
The NAREIT all equity REITs index is down -23.8% since the same date one year ago. Hey, that is better than Cathie Wood’s ARK fund (down -68.4% YoY). Oddly, the NCREIF commerical real estate index was up +9.4% through Q3. Interesting to see the NCREIF index (red line) rising with The Fed Funds Target rate (dashed yellow line).
And US home prices are still growing, but the trend looks like the WWII German battleship Tirpitz sinking.
Trying to survive high inflation is difficult, but surviving The Federal Reserve’s counterattack to inflation is even more difficult.
Two people who constantly appear in the business are ARK’s Cathie Wood and TSLA’s Elon Musk. A third we can add is Sam Bankman-Fried of FTX and Alameda Research infamy.
So which one was the best at surviving inflation and The Fed’s counterattack? Answer? None of them.
Since the same day last year, we have seen M2 Money growth plunge and The Fed Funds Target rate rise rapidly from 25 basis points to 4.50%, a rapid increase. But over the last year, Cathie Wood and ARK fell -68.4%, Elon Musk’s Telsa fell -68.9% and Bitcoin fell -65.1%
So, ARK, Tesla and Bitcoin were demolished in 2022 thanks to inflation and The Fed’s counterattack. But the NASDAQ index was down too, but only -35.2% YoY.
US existing home sales in November collapsed by -38.6% YoY as M2 Money growth runs out of gas.
The above chart is similar to yesterday’s “Ski Slope” chart of US home prices YoY.
Unfortunately, pending home sales YoY are the worst in recorded history.
What will President Biden do about this dire situation? Our “Vacationer in Chief” is off on yet another vacation to St. Croix in the US Virgin Islands, so probably nothing. Now that Biden is sunbathing, what will his Treasury Secretary Janet Yellen do?
The market began downshifting earlier this year as the Federal Reserve started hiking its benchmark interest rate, with the goal of easing high inflation that’s been driven in part by skyrocketing housing costs.
Rates for 30-year, fixed mortgages reached 7.08% in October — and again in November — though they have since retreated, Freddie Mac data show. With borrowing costs roughly double where they were at the start of the year, and inflation leaving less savings to put toward a down payment, homebuyers have pulled back. Sellers are also reluctant to list their properties, yet houses that are on the market are lingering and getting discounted as demand slumps.
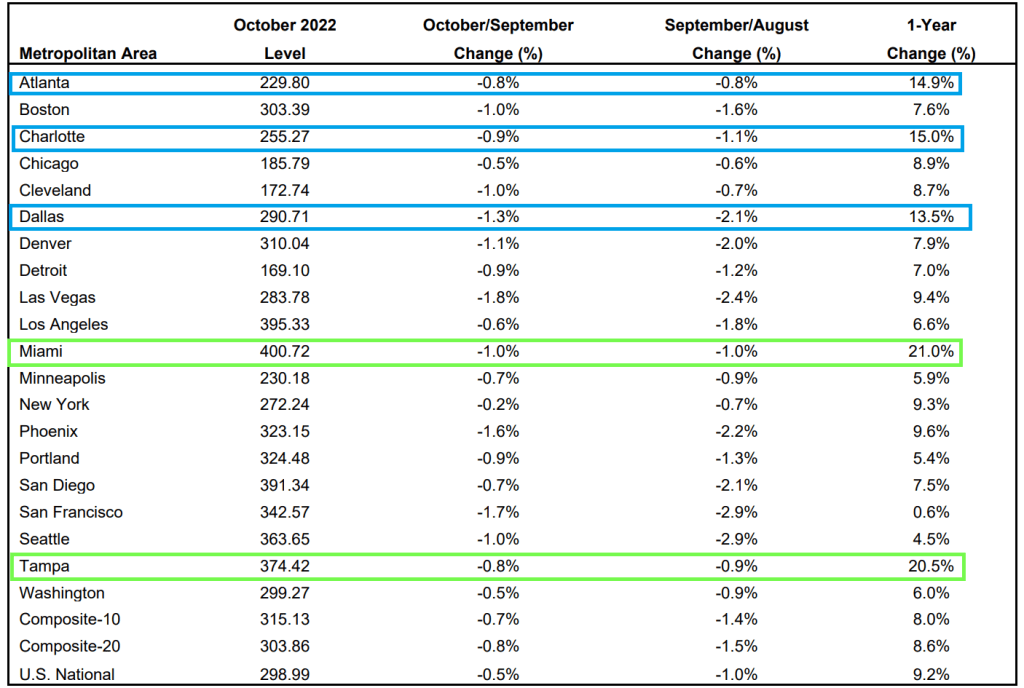
The Case-Shiller National Home Price Index “cooled” to 9.24% YoY growth as The Federal Reserve tightens its monetary noose.
Of the top twenty metro areas, both Miami and Tampa Florida were up over 20% YoY. Hot ‘Lanta, Charlotte and Dallas were over 10% YoY. Mordor on the Potomac was up “only” 6% and all other metro areas were under 10%.
But if we look at October/September changes, all metro areas are down (MoM) with San Francisco the worst.
Finally, The Federal Reserve’s massive balance sheet is still out in force.
Look at this chart of the Case-Shiller National home price index again The Fed’s balance sheet. Uh-oh.
Let’s look at San Francisco (my hometown) since The Federal Reserve began interest rate tightening.
A classic good news, bad news story. The good news? US new home sales rose 5.8% in November, better that the expected -5.1%, The bad news? On a year-over-year basis, US new home sales FELL
Sales of new US homes unexpectedly rose in November, suggesting some stabilization in demand as mortgage rates eased late in the month from their highs.
Purchases of new single-family homes increased 5.8% to an annualized 640,000 pace last month after rising in October, government data showed Friday.
A mid-month retreat in 30-year mortgage rates back below 7% along with an increase in builder incentives may have helped support demand. Still, the sales data are volatile from month to month. With home prices remaining elevated and the Federal Reserve poised to raise interest rates further, headwinds for the housing market will persist into 2023.
The increase in sales last month was concentrated in the West and Midwest.
The report, produced by the Census Bureau and the Department of Housing and Urban Development, showed the median sales price of a new home was up 9.5% from a year earlier to $471,200.
There were 461,000 new homes for sale as of the end of last month, though the grand majority remain under construction or not yet started. The number of homes sold in November and awaiting the start of construction — a measure of backlogs — rose to the highest since the beginning of the year.
But for all the cheerleading, new home sales were DOWN -15.3% on a year-over-year basis. The ninth straight month of negative new home sales growth.
At least the median price of new home sales was down -2.79% from October to November.
On a year-over-year (YoY) basis, US real GDP rose to a measly 1.9%. US core PCE YoY fell slightly to 4.93%. M2 Money growth is at 2.6% YoY.
The Misery Index (U-3 inflation rate + inflation) remains elevated and above 10% (it currently clocks-in at 12%), far above the pre-Covid reading of around 5%.
Here is the rest of the story. On a quarter-over-quarter basis, real GDP rose to 3.2% QoQ. Personal consumption rose 2.3% QoQ. Core PCE (Personal Consumption Expenditures) rose to 4.7% QoQ. If we use core PCE as a measure of inflation, inflation is rising.
Here is a video of Fed Chair Jerome Powell (doubling as President Joe Biden) saying creating inflation and then raising interest rates to fight it “It’s for the best.”
One of the big problems with Federal goverment and Federal Reserve monetary stimulus is … it wears out. Just look at M2 Money growth.
US existing homes sales fell -7.70% in November to 4.09 million units SAAR. And since the same month last year, existing home sales are down -35.4% YoY.
Existing home sales were the lowest in November since 2010.
The good news? The median price of existing homes fell to 3.21% YoY. The bad news? The ark is really bad pointing to a bad December. Inventory for sale (orange line) remains below pre-Covid shutdown levels.


You must be logged in to post a comment.