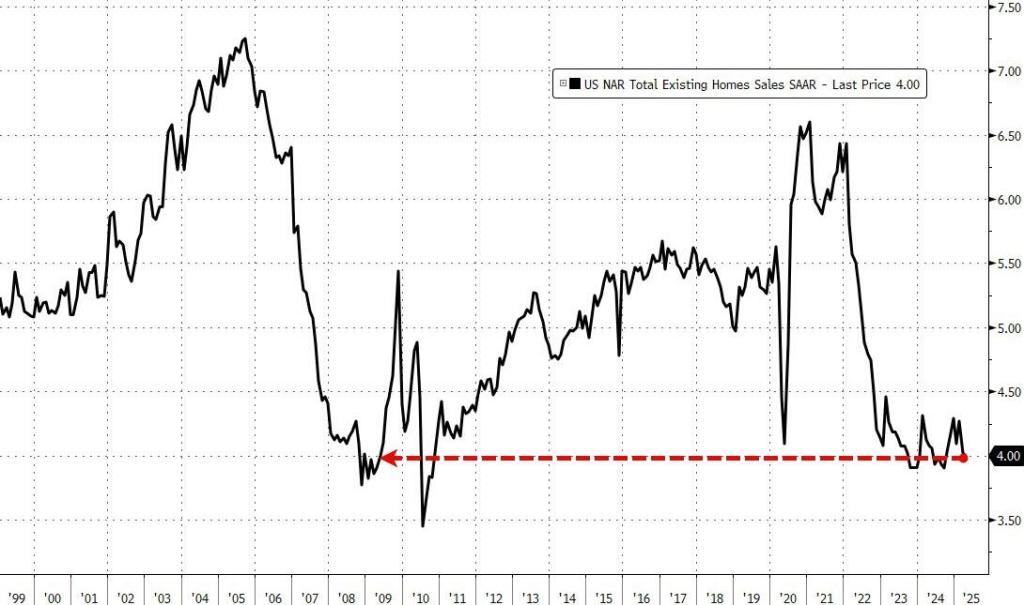
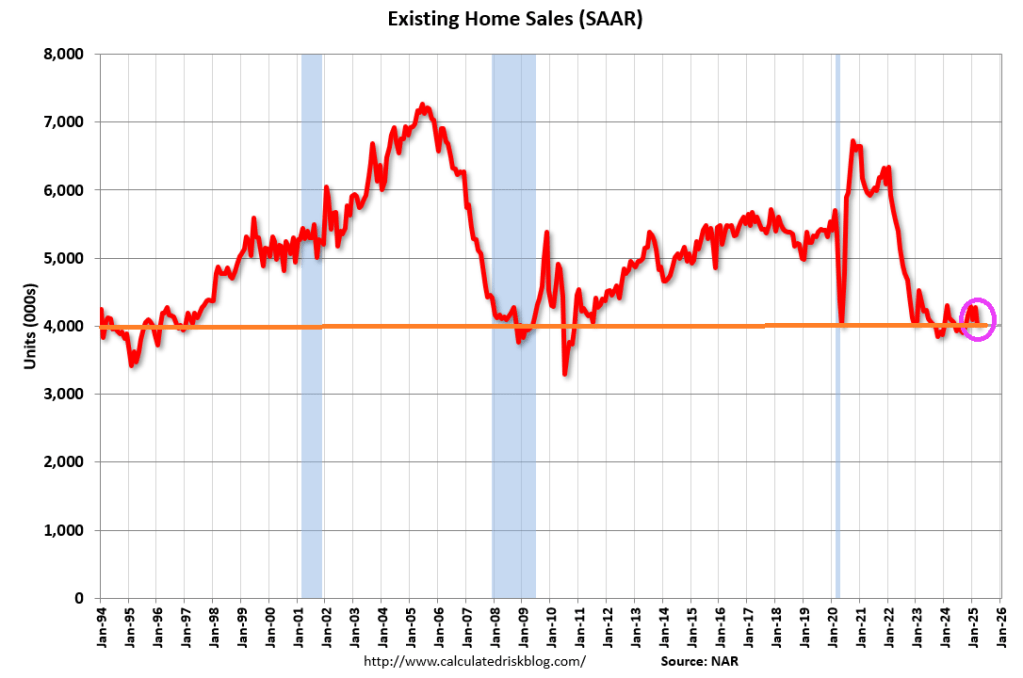
US existing home sales dropped 0.5% MoM in April (considerably worse than the +2.0% MoM rise expected), dropping to just 4.00MM sales SAAR, with sales down 3.1% from a year earlier on an unadjusted basis.
This is the weakest April sales pace since April 2009.
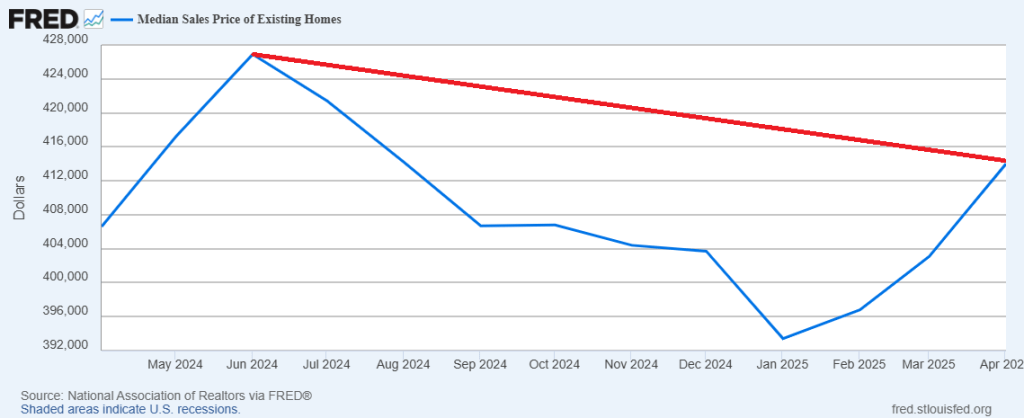
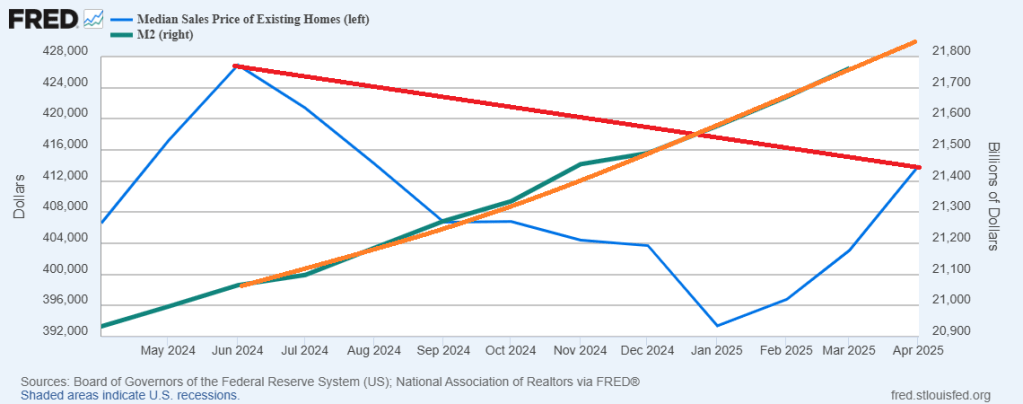
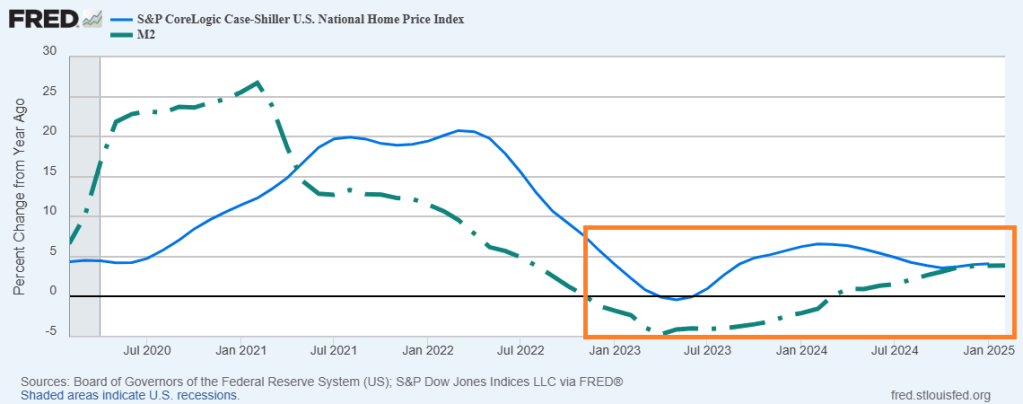
And median price of EHS is rising and is on pace to top 2024’s high.
And with M2 Money printing like a bat out of hell.
The Fed can help, but won’t. We are still struggling to recover from Biden’s cockeyed management of the economy,
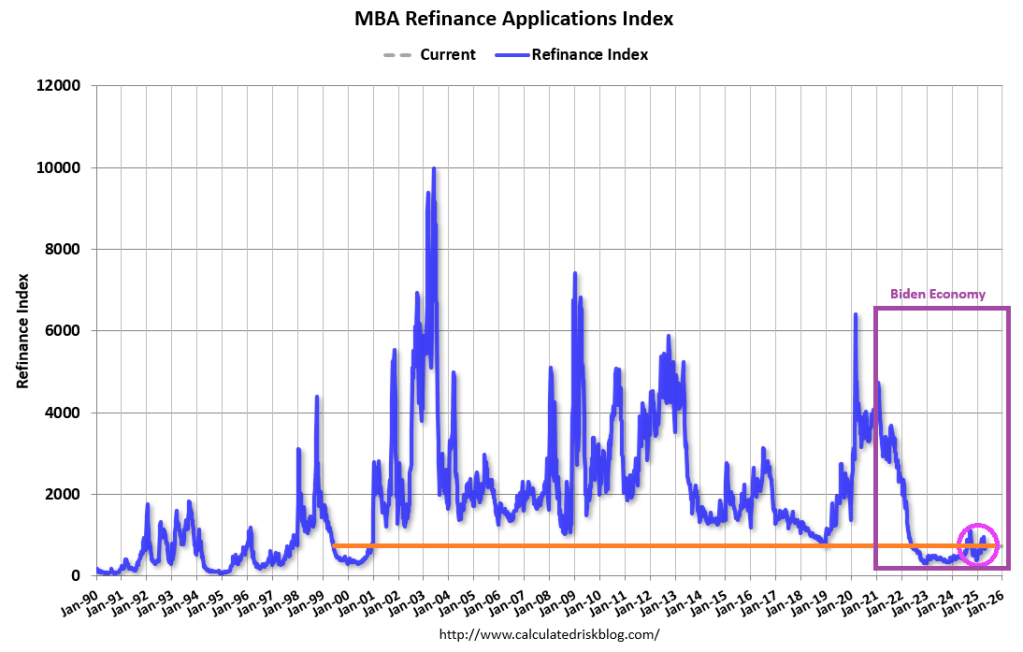
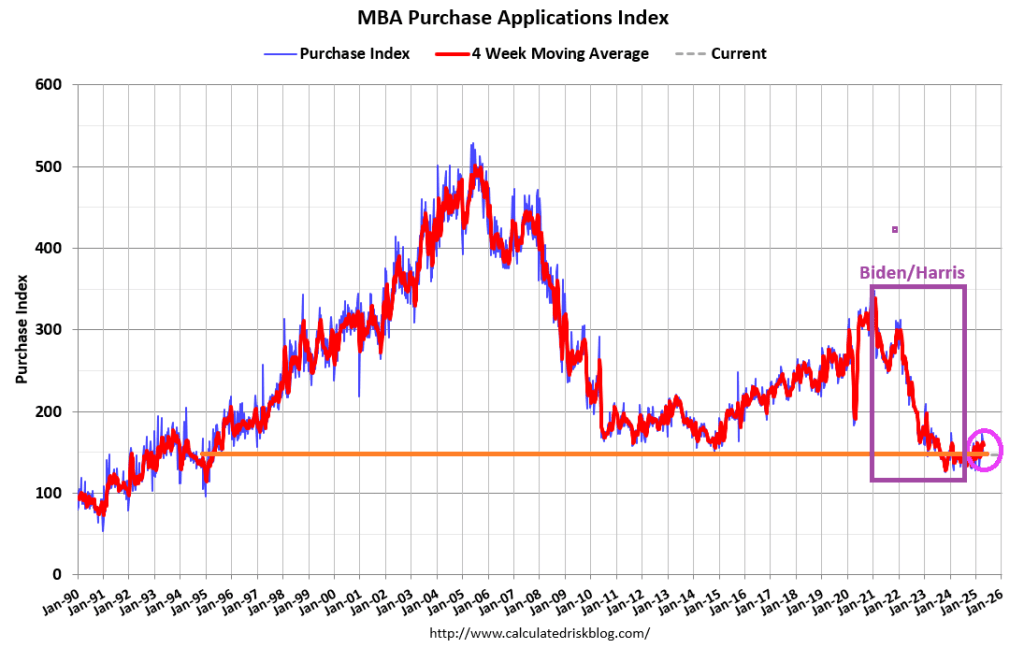
Mortgage applications increased 11.0 percent from one week earlier, according to data from the Mortgage Bankers Association’s (MBA) Weekly Mortgage Applications Survey for the week ending May 2, 2025.
The Market Composite Index, a measure of mortgage loan application volume, increased 11.0 percent on a seasonally adjusted basis from one week earlier. On an unadjusted basis, the Index increased 12 percent compared with the previous week. The seasonally adjusted Purchase Index increased 11 percent from one week earlier. The unadjusted Purchase Index increased 12 percent compared with the previous week and was 13 percent higher than the same week one year ago.
The Refinance Index increased 11 percent from the previous week and was 51 percent higher than the same week one year ago.
The economic news last week included a negative reading for first-quarter GDP growth and further signs of contraction in the manufacturing sector, mixed with a solid employment report for April. The net impact on mortgage rates was mostly downward but just back to levels from early April. The 30-year fixed rate declined to 6.84 percent.
But there will be no rate cuts today from The Fed.
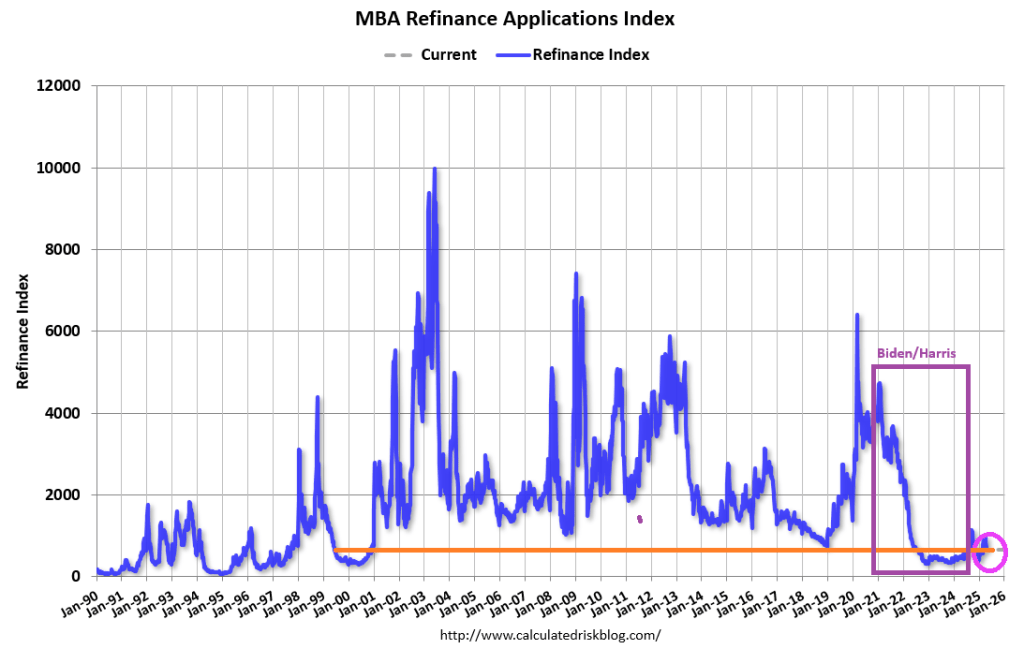
Mortgage applications decreased 4.2 percent from one week earlier, according to data from the Mortgage Bankers Association’s (MBA) Weekly Mortgage Applications Survey for the week ending April 25, 2025.
The Market Composite Index, a measure of mortgage loan application volume, decreased 4.2 percent on a seasonally adjusted basis from one week earlier. On an unadjusted basis, the Index decreased 4 percent compared with the previous week. The seasonally adjusted Purchase Index decreased 4 percent from one week earlier. The unadjusted Purchase Index decreased 3 percent compared with the previous week and was 3 percent higher than the same week one year ago.
The Refinance Index decreased 4 percent from the previous week and was 42 percent higher than the same week one year ago.
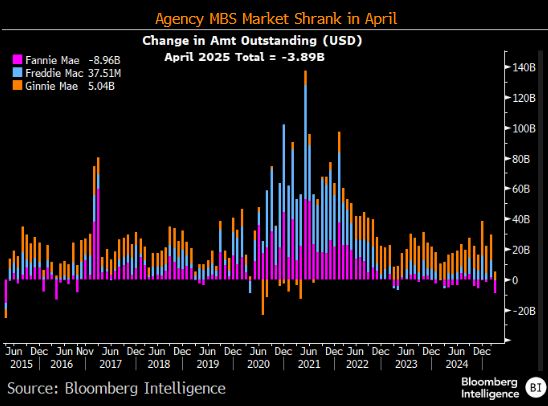
The Agency MBS market shrank in April.
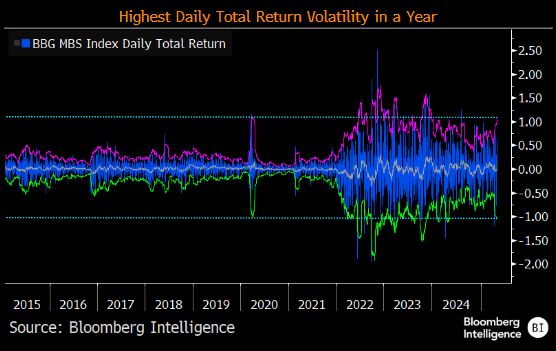
And MBS daily returns have the highest return volatility.
Republicans are trying to lock in Trump’s tax cuts and Democrats are resisting. We now know that DOGE is trying to end the wasteful spending in DC. But I would really like to see tax rates on the middle class fall.
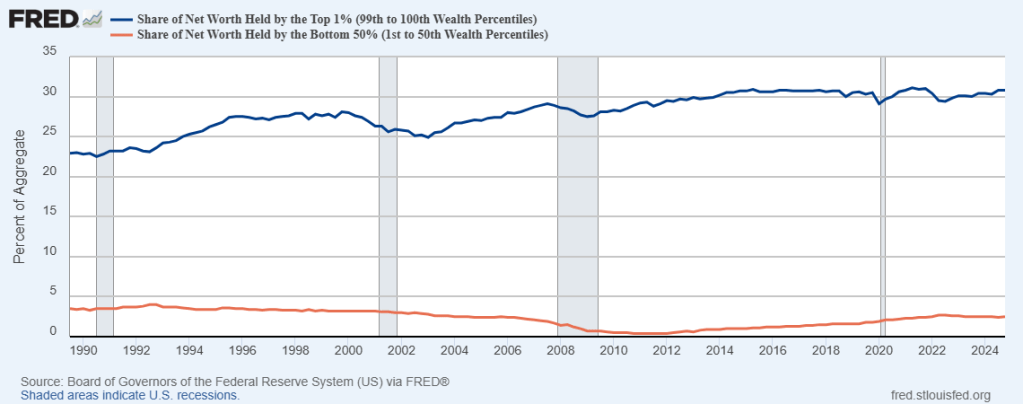
The wealth gap between the top 1% of taxpayers and the bottom 50% of taxpayers is enormous. And has gotten worse since 1990.
Meanwhile. to fight off the temporary effects of the tariff war, Trump is urging Fed Chair Powell to cut rates.
Powell will likely NOT cut rates. But what does “Lunatic Liz” Warren say about rate cuts??
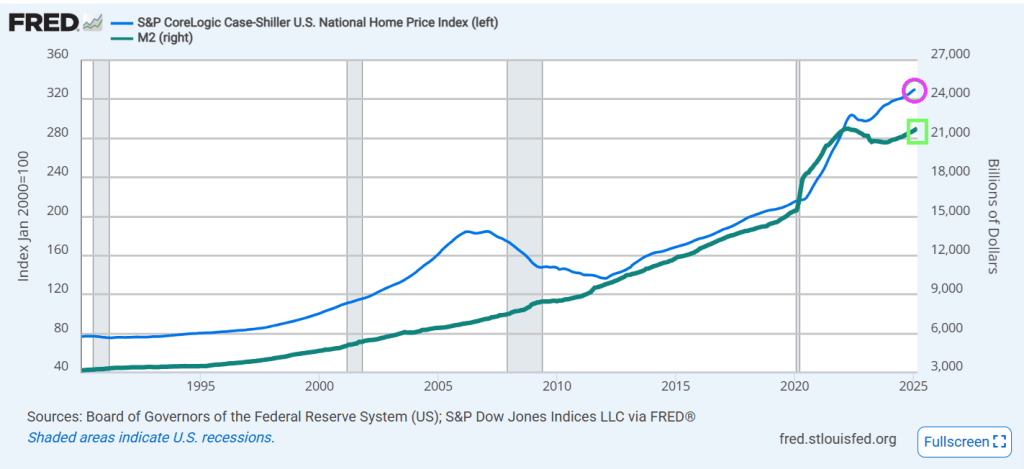
US home prices hit a new record high in February, according to the latest data from S&P CoreLogic Case-Shiller, rising 0.4% MoM (as expected). However, the pace of price rises did slow modestly (after accelerating for the past three months) to +4.50% YoY. And home prices track Fed money printing.
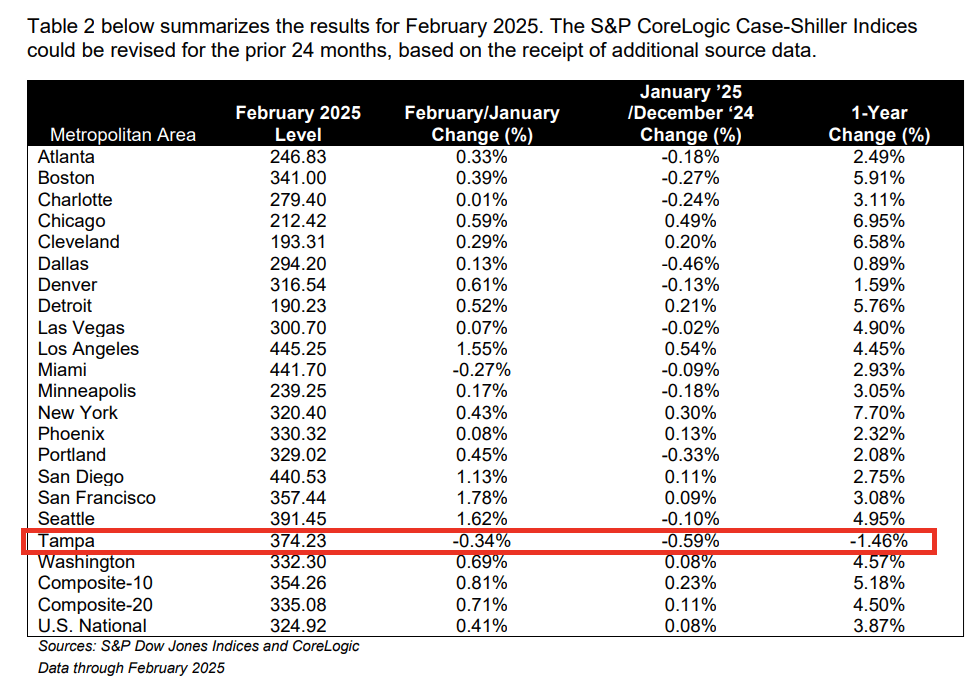
The S&P CoreLogic Case-Shiller U.S. National Home Price NSA Index, covering all nine U.S. census divisions, reported a 3.9% annual return for February, down from a 4.1% annual gain in the previous month. The 10-City Composite saw an annual increase of 5.2%, down from a 5.4% annual increase in the previous month. The 20-City Composite posted a year-over-year increase of 4.5%, down from a 4.7% increase in the previous month. New York again reported the highest annual gain among the 20 cities with a 7.7% increase in February, followed by Chicago and Cleveland with annual increases of 7.0% and 6.6%, respectively. Tampa posted the lowest return, falling 1.5%.
The pre-seasonally adjusted U.S. National, 10-City Composite, and 20-City Composite Indices presented slight upward trends in February, posting 0.4%, 0.8%, and 0.7% respectively.
After seasonal adjustment, the 10-City and 20-City Composite Indices posted month-over-month increases of 0.5% and 0.4%. The U.S. National Composite Index posted a month-over-month increase of 0.3%.
“Even with mortgage rates remaining in the mid-6% range and affordability challenges lingering, home prices have shown notable resilience,” said Nicholas Godec, CFA, CAIA, CIPM, Head of Fixed Income Tradables & Commodities at S&P Dow Jones Indices. “Buyer demand has certainly cooled compared to the frenzied pace of prior years, but limited housing supply continues to underpin prices in most markets. Rather than broad declines, we are seeing a slower, more sustainable pace of price growth.”
We are still suffering from Biden’s horrible economic policies. 10% Joe had a heart of fool’s gold.
Existing-home sales descended in March, according to the National Association of REALTORS®. Sales slid in all four major U.S. regions. Year-over-year, sales dropped in the Midwest and South, increased in the West and were unchanged in the Northeast.
Total existing-home sales – completed transactions that include single-family homes, townhomes, condominiums and co-ops – fell 5.9% from February to a seasonally adjusted annual rate of 4.02 million in March. Year-over-year, sales drew back 2.4% (down from 4.12 million in March 2024).
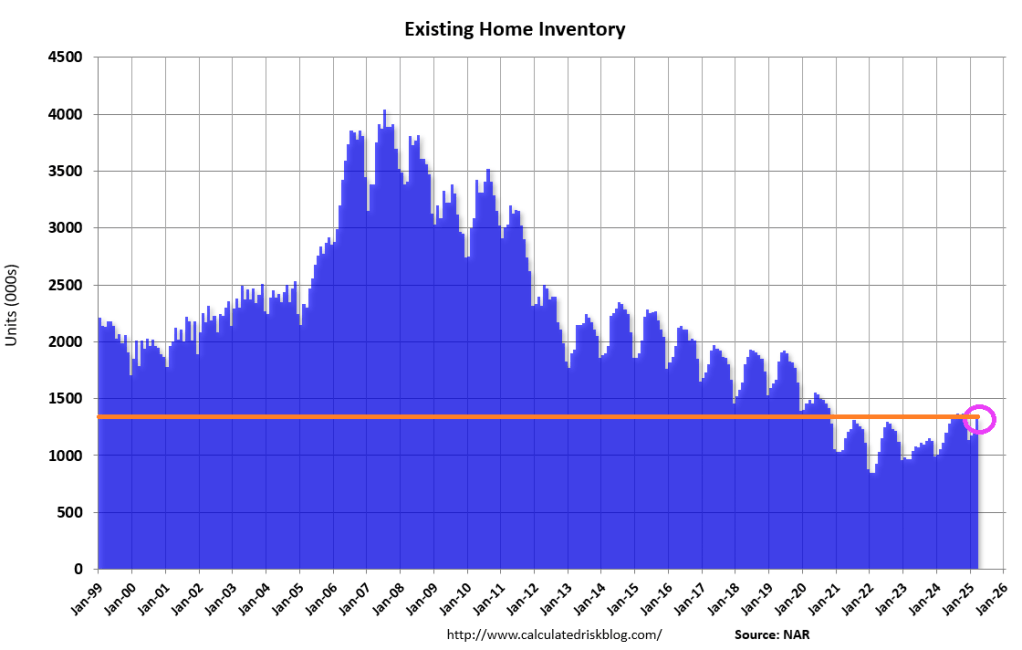
Total housing inventory registered at the end of March was 1.33 million units, up 8.1% from February and 19.8% from one year ago (1.11 million). Unsold inventory sits at a 4.0-month supply at the current sales pace, up from 3.5 months in February and 3.2 months in March 2024.
Fed Chair Jerome Powell is apparently waiting for the tariff “war” to settle down before he pushes for interest rate cuts. Meanwhile, rising mortgage rates are hurting consumers and the mortgage industry.
Mortgage applications decreased 12.7 percent from one week earlier, according to data from the Mortgage Bankers Association’s (MBA) Weekly Mortgage Applications Survey for the week ending April 18, 2025.
The Market Composite Index, a measure of mortgage loan application volume, decreased 12.7 percent on a seasonally adjusted basis from one week earlier. On an unadjusted basis, the Index decreased 11 percent compared with the previous week. The seasonally adjusted Purchase Index decreased 7 percent from one week earlier. The unadjusted Purchase Index decreased 6 percent compared with the previous week and was 6 percent higher than the same week one year ago.
The Refinance Index decreased 20 percent from the previous week and was 43 percent higher than the same week one year ago.
Overall mortgage application activity declined last week, as rates increased to their highest level in two months. The 30-year fixed rate rose for the second straight week to 6.9 percent, an almost 30-basis-point increase over two weeks.


You must be logged in to post a comment.