BIG Bubbles! National House Price Index Up 6.3% Year-over-Year in April Despite Mortgage Rates Up 147% Under Biden (San Diego Fast Growing At 10.3% YoY, Portlandia Slowest Growing)

This isn’t a tiny bubble!

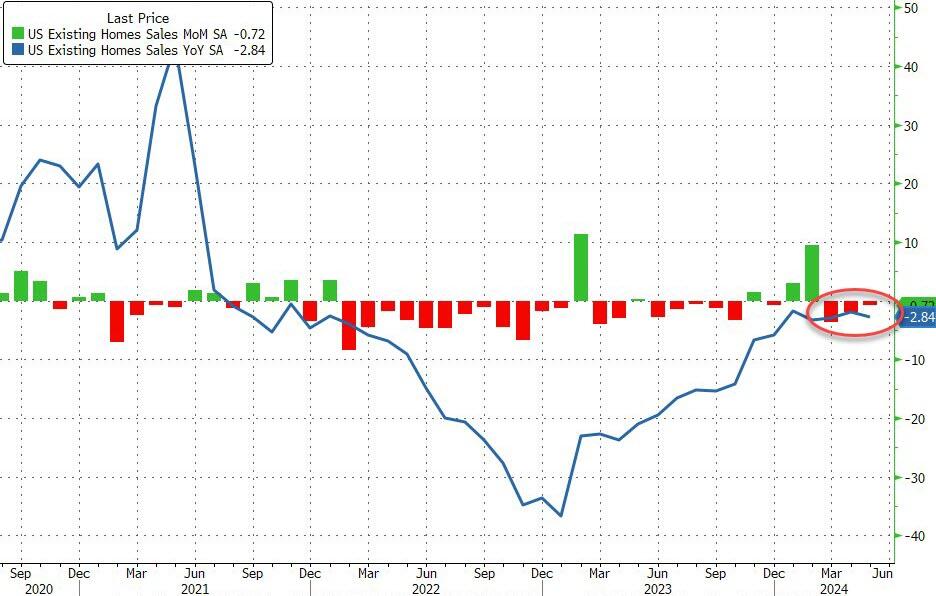
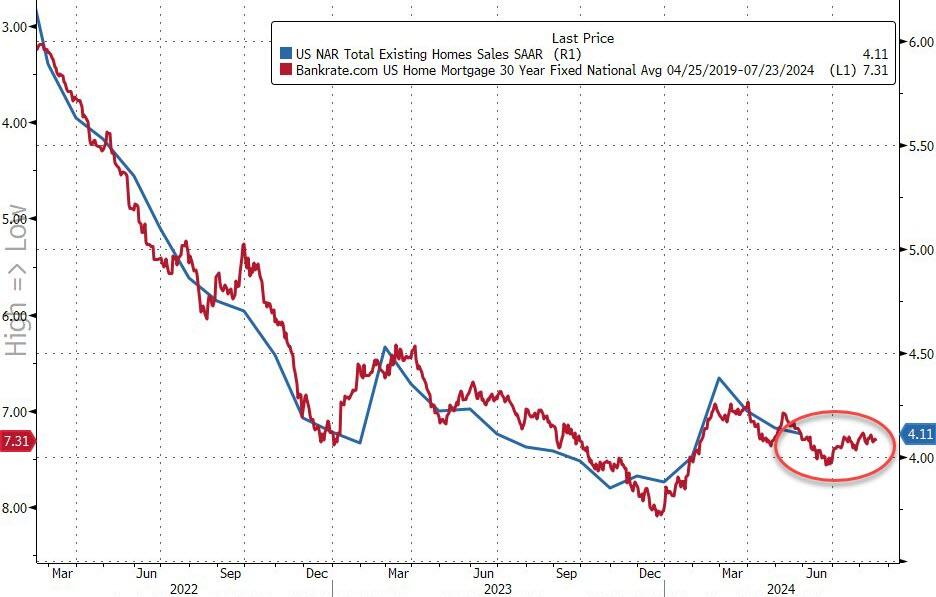
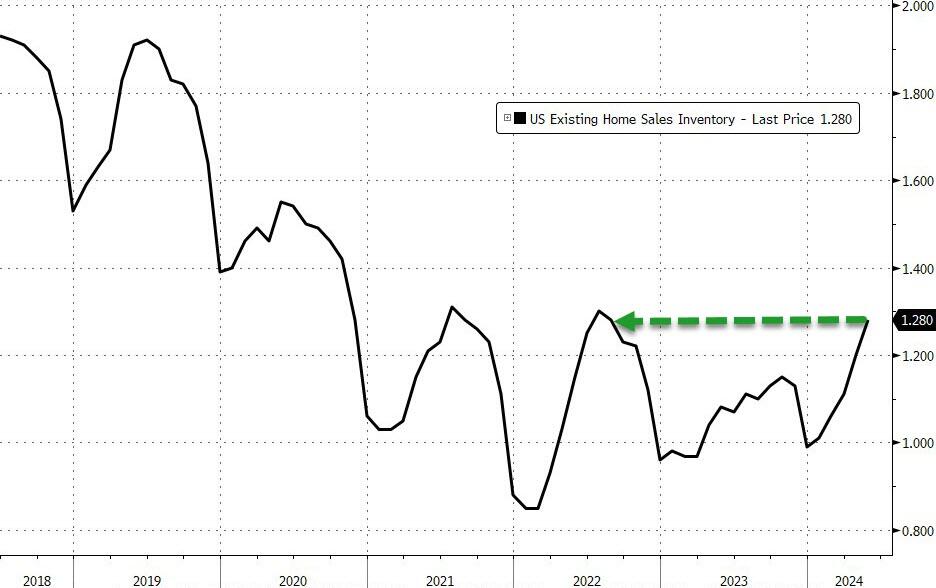
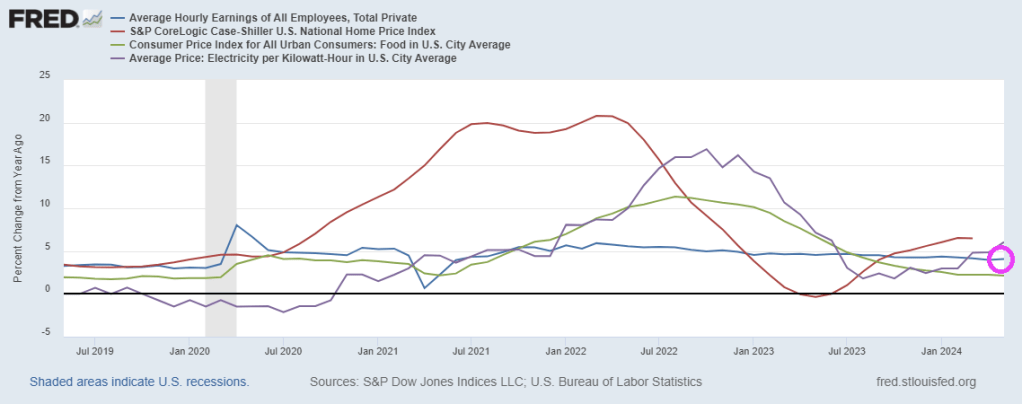
S&P/Case-Shiller released the monthly Home Price Indices for April (“April” is a 3-month average of February, March and April closing prices). The pace of appreciation has slowed from the previous month, reflecting the toll of 7% mortgage rates and low inventory.

This release includes prices for 20 individual cities, two composite indices (for 10 cities and 20 cities) and the monthly National index.

From S&P S&P CoreLogic Case-Shiller Index Break Previous Month’s All-Time High in April 2024

The S&P CoreLogic Case-Shiller U.S. National Home Price NSA Index, covering all nine U.S. census divisions, reported a 6.3% annual gain for April, down from a 6.5% annual gain in the previous month. The 10-City Composite saw an annual increase of 8.0%, down from an 8.3% annual increase in the previous month. The 20-City Composite posted a year-over-year increase of 7.2%, dropping from a 7.5% increase in the previous month. San Diego continued to report the highest annual gain among the 20 cities in April with a 10.3% increase this month, followed by New York and Chicago, with increases of 9.4% and 8.7%, respectively. Portland once again held the lowest rank this month for the smallest year-over-year growth, with a 1.7% annual increase in April.

The U.S. National Index, the 20-City Composite, and the 10-City Composite upward trends decelerated from last month, with pre-seasonality adjustment increases of 1.2%, 1.36% and 1.38%, respectively.

After seasonal adjustment, the U.S. National Index and 10-City Composite posted the same month-over-month increase of 0.3% and 0.5% respectively as last month, while the 20-City reported a monthly increase of 0.4%.

“For the second consecutive month, we’ve seen our National Index jump at least 1% over its previous all-time high,” says Brian D. Luke, Head of Commodities, Real & Digital Assets at S&P Dow Jones Indices. “2024 is closely tracking the strong start observed last year, where March and April posted the largest rise seen prior to a slowdown in the summer and fall. Heading into summer, the market is at an all-time high, once again testing its resilience against the historically more active time of the year.

“Thirteen markets are currently at all-time highs and San Diego reigns supreme once again, topping annual returns for the last six months. The Northeast is the best performing market for the previous nine months, with New York rising 9.4% annually. Sustained outperformance of the Northeast market was last observed in 2011. For the decade that followed, the West and the South held the top posts for performance. It’s now been over a year since we’ve seen the top region come from the South or the West.

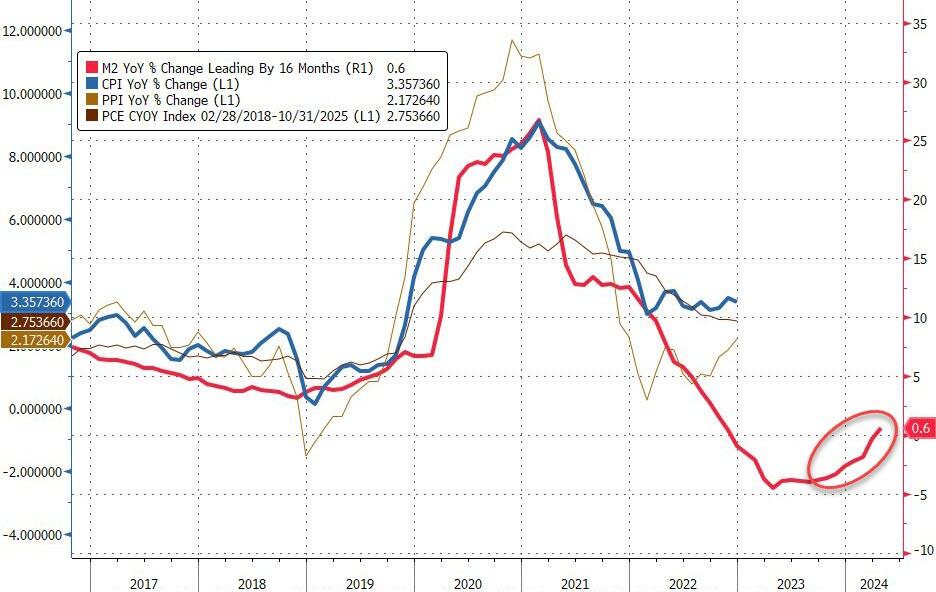
Of course, Fed Money Printing is helping drive home price growth. Perhaps too much!

Here is Jerome Powell, Chairman of The Fed Bubble Blowing Machine!!

Surprise! US Economic Surprise Index Slumps To -28.10 (Lowest Since 2022)

Well, perhaps bot a genuine surprise. We are aware that the US economy has been slowing as the massive fiscal and monetary stimulus from Covid is wearing out.

The economics surprise index slumped to -28.10, the lowest since 2022.

I feel like the US economy is experiening a Ragnarok change. With the giants (World Economic Forum/UN. etc) winning.

US Existing Home Sales Declined -2.8% YoY In May As Leading Economic Index Falls -2.0% Over Past 6 Months

I am no forune teller, but this doesn’t look to good for old Joe (Biden).

Existing home sales fell -2.8% YoY in May.

US existing home sales fell for the third straight month in May (-0.7% MoM vs -1.0% exp). This left home sales down 2.8% YoY (YoY sales have not increased since July 2021)…

Source: Bloomberg

The total home sales SAAR is push back towards COVID lockdown lows once again at 4.1mm, but prices accelerated to a new record high…

Source: Bloomberg

“Home prices reaching new highs are creating a wider divide between those owning properties and those who wish to be first-time buyers,” NAR Chief Economist Lawrence Yun said in a statement.

“Eventually, more inventory will help boost home sales and tame home price gains in the upcoming months.”

And given that mortgage rates remain stubbornly above 7%, existing home sales show no signs of improving anytime soon…

Source: Bloomberg

The supply of homes on the market increased 18.5% from the same month last year to 1.28 million, but it’s still well below the level seen before the pandemic when mortgage rates were much lower.

Source: Bloomberg

About 67% of the homes sold were on the market for less than a month in May, roughly flat from the prior month, while 30% sold above the list price. Properties remained on the market for 24 days on average in May, compared with 26 days in April, NAR’s report said.

The Conference Board Leading Economic Index® (LEI) for the U.S. decreased by 0.5 percent in May 2024 to 101.2 (2016=100), following a 0.6 percent decline in April. Over the six-month period between November 2023 and May 2024, the LEI fell by 2.0 percent—a smaller decrease than its 3.4 percent contraction over the previous six months.

Biden Shrugged: US Housing Starts Fall To COVID Lockdown Lows (Multifamily Starts Down -51.7% YoY In May)

It begs the question: where are the 10+ million illegal immigrants living who have poured over the border under Binden/Mayorkas? Especially when 5+ units housing starts dropped -51.7% since last year (YoY) in May. And the trend under Biden looks terrible!

Despite ugly consumer confidence and soaring mortgage rates, analysts expected a small rebound in housing starts and building permits in May (after April’s disappointing misses). They were wrong… again… as both Starts and Permits plunged MoM (-5.5% MoM and -3.8% MoM respectively)…

Source: Bloomberg

That was the third monthly drop in permits (more forward looking) in a row. Worse still, April Housing Starts were revised lower (from +5.7% to +4.1%), making this miss even worse.

This dragged the SAARs for starts and permits to their lowest since the trough of COVID…

Source: Bloomberg

With Multifamily starts falling back near COVID lockdown lows…

  • Single-Family 982K SAAR, down 4.8% from 1,031K and the first sub-million print since October 2023
  • Multi-Family 278K, down 13.7% from 322K and the lowest since March’s 245K (which was the lowest print since covid crash)

Source: Bloomberg

And multi-family permits cratering to their lowest since Oct 2018…

  • Single-Family permits 949K SAAR, down 2.9% from 977K
  • Multi-Family permits 382K SAAR, down 6.1% from 407K

And with rate-cut expectations holding near their lows, there is no sign of recovery in home-building yet…

Source: Bloomberg

It seems reality is starting to set in for homebuilders…

Source: Bloomberg

As housing starts plummet, jobs seem to keep growing to record highs…

Source: Bloomberg

Will any rate-cut actually move the dial here?

Is TreasSec Yellen A Genius? Or Slap Shot’s Gilmore Tuttle? Housing Growing At 6.5% While Avg Hourly Earnings Growing At Only 4.1% (Electricity Prices Growing At 6.1%)

US Treasury Secretary (and former Fed Chair) Janet Yellen says the US economy is in excellent shape. Is she a genius and sees something that rest of us don’t? Or is she a partisan thug like Shap Shot’s Gilmore Tuttle?

Yellen brags about rising wages and declining inflation. Well, average hourly earnings YoY are now 4.1%. However, home prices are growing at 6.5% year-over-year (YoY) and electricity prices are up 6.1% YoY. Food CPI grew at 2.1% in May. Yellen ignores the string of 10%+ increases in 2022-2023 making eating unaffoprdable for millions.

I doubt if Yellen could run a lemonade stand in my neighborhood. But like Gilmore Tuttle, maybe she could run a donut shop!

The Streets Of San Francisco! Office Availability Rates Soar In Large US Metro Areas (San Francisco Leads Nation In Office Availability)

I can’t wait to get back where we started from. In terms of the economy.

And the CRE office market is showing disaster. San Francisco office market availability rates have soared in Q1 2024 to over 35%, up from less than 10% in Q1 2019.

Welcome to The Streets of San Franciso!

Biden Shrugged! US Economy Actually Lost -408k Jobs In May (Initial Claims Surge To 10-Month Highs As California Joblessness Soars)

Joe Biden is a dishonest politician, so it is no wonder that he ignores actual data. Like claiming that crime is down under his leadership, when it is actually large cities like New York and Los Angeles not reporting their crime data to the FBI.

Take the May jobs numbers. The BLS reports that 272k jobs were added. However, the more accurate Household Survery reported a loss of -408k jobs in May.

While the Establishment Survey did indeed report that 272K “jobs” were added, this number also included multiple job holders; stripping those out, we get that the actual number of “employed” workers plunged by -408K.

On the jobless claims side, the number of Americans applying for jobless benefits for the first time surged last week to 242k (up from 229k and well above the 225k exp). That is the highest since August 2023…

Source: Bloomberg

On an NSA basis, claims exploded higher.

The last three weeks have seen the largest surge in claims since January…

Source: Bloomberg

Notably this surge is very VERY similar to what we saw last year (but not the prior few years, so not a ‘seasonal’ pattern per se)…

Source: Bloomberg

The surge in NSA claims was driven by California…

California leads the nation in initial jobless claims, thanks to Newsom’s $20 per hour minimum wage law for fast food restaurants. This one’s gonna hurt Californians for a long, long time.

Biden and Newsom WISH they were Atlas.

Mortgage Applications Rise 15.6% From Previous Week, But Purchase Applications Down -12% Over Past Year

Well, it was the first week of June. Mortgage applications usually peak in May, so we are on the historic “dark side of the moon” for mortgage demand.

Mortgage applications increased 15.6 percent from one week earlier, according to data from the Mortgage Bankers Association’s (MBA) Weekly Applications Survey for the week ending June 7, 2024.

The Market Composite Index, a measure of mortgage loan application volume, increased 15.6 percent on a seasonally adjusted basis from one week earlier. On an unadjusted basis, the Index increased 26 percent compared with the previous week. The seasonally adjusted Purchase Index increased 9 percent from one week earlier. The unadjusted Purchase Index increased 19 percent compared with the previous week and was 12 percent lower than the same week one year ago.

Beware of getting too excited about the19% WoW increase. It is 19% off an extremely low number.

The Refinance Index increased 28 percent from the previous week and was 28 percent higher than the same week one year ago. 

This charts sums up the seasonal component to prepays.

Consumer Prices Hold At Record Highs – Up 20% Since Biden Elected (Shelter Index Rose 5.4% Over Past Year)

The middle class and low wager workers are made for kicking. And that’s with Bidenomics did.

The headline consumer price index was unchanged MoM in May – the smallest change since July 2022 – just less than the +0.1% MoM expected. On a YoY basis, headline CPI rose 3.3% (less than the 3.4% exp) – but very much stuck in a range well above the 2% target for over year now…

Source: Bloomberg

Energy was the biggest drag on the headline CPI MoM…(Gasoline prices tumbled 3.6% in May from April, one key reason why the headline CPI was flat on the month. )

Source: Bloomberg

Core CPI rose 0.2% MoM (below the 0.3% exp) pulling the YoY change down to 3.4% (from 3.6% and below the 3.5% exp). That is the lowest Core CPI YoY since April 2021…

Source: Bloomberg

Core CPI has not had a down-month since President Biden was elected.

Core Services inflation slowed notably MoM…

Source: Bloomberg

The shelter index increased 0.4 percent in May and was the largest factor in the monthly increase in the index for all items less food and energy.

  • May Shelter inflation 5.41% YoY, down from 5.55% in April and lowest since April 2022
  • May Rent inflation 5.30% YoY, down from 5.44% and lowest since May 2022

For context on how important housing costs are to US inflation data, the shelter index rose 5.4% over the last year, making up over two thirds of the total 12-month increase in the all items less food and energy index.

Source: Bloomberg

It does make one wonder were exactly the BLS is getting their BS OER data from…

The full breakdown…

Services INflation remains awkwardly stuck above 5% while Goods DEflation is at its weakest since January 2004…

Source: Bloomberg

SuperCore CPI fell 0.05% MoM – its first drop since Sept 2021, but that left the YoY level still above 5.0%…

Source: Bloomberg

Transportation Services costs tumbled MoM to drag SuperCore lower MoM…

Source: Bloomberg

We note that consumer prices have not fallen in a single month since President Biden’s term began (July 2022 and May 2024 was the closest with ‘unchanged’), which leaves overall prices up over 19.5% since Bidenomics was unleashed (compares with +8% during Trump’s term).

And prices have never been more expensive…

That is an average of 5.4% per annum (almost triple the 1.9% average per annum rise in price during President Trump’s term).

Source: Bloomberg

Since President Biden was elected, food prices at home are up around 21% and food prices away from home are up almost 23%…

And while the Biden administration will continue to gaslight voters with comments like “inflation is tumbling”… every man, woman, and child who actually buys food knows prices have NEVER been higher…

Finally, while the ‘flations’ have broadly tracked M2 lower, we note that M2 YoY is now starting to turn back higher once again…

Source: Bloomberg

Will the next President and Fed head face a 70s redux?

Source: Bloomberg

And is this guaranteed if Powell decides “insurance” cuts are required (for Biden?)

Too Much Debt! US Government And Consumers Are Debt Crazed (US Debt Hits $34.8 TRILLION, Consumer Debt Hits $17.69 TRILLION, Unfunded Liabilities Hits $216 TRILLION)

Too much debt should be the theme song for the US! Both for consumers and the Feral government (not a typo!)

Consumer credit increased by +$6.403 billion in April, much softer than consensus estimate of +$10 billion … more notable, however, was March data, given initial read of +$6.274 billion was revised down to -$1.099 billion.

Not to mention $13 trillion in mortgage debt (1-4 unit housing), but at least that is backed by property. Unlike The Feral government who borrows/prints with only a promise.

Consumer Debt Hits $17.69 TRILLION.

US national debt stands at $34.8+ trillion.

And growing awfully fast. Note that since the “pandamic”, debt as % of GDP has exceeded 100% and is projected to hit 166% by 2054. But look at the UNFUNDED LIABILITIES the need to be paid ($216+ TRILLION ($641.5k per citizen!). Pretty soon, we (the 99%) will be back on the chain gang paying for endless wars and government corruption. I wish Biden, Schumer, McConnell and other swamp creatures would consider all the spending the government is on the hook for rather than focus on spending that will help them get elected perpetually. There is no middle of the road anymore. The US is broke and has too much debt.

Of course, President Biden wants endless spending on wars (Ukraine, Israel, etc) and now wants an unlimited check to pay for the next pandemics. The Pretenders’ song “My City Was Gone” seems to be appropriate for the US as “My County Is Gone.”

Of course, some “economists” claim that the US can borrow/print unlimited amounts of money … until they can’t.