Krugman’s Kerplunk! War On Inflation Over, But Average American Is $7,400 Poorer Under Bidenomics (Real Wages Decline Again And Rent Inflation Over 7%)

Paul Krugman, Nobel Laureate in economics and media celebrity, made a terrible claim yesterday when he pronounced that “The war on inflation is over. We won, at very little cost.” Krugman’s proclamation was trumpeted by The View’s Joy Behar Joy who claimed that everything is going great in the country! The economy is “booming” and people are having an “easier time” putting bread on the table. Huh? Easier than a month ago maybe, but not easier since 2021 under Bidenomics.

Hmm. Suppose that during World War II the Germans had stopped after they invaded and captured Paris on June 14, 1940. The war could have been over, but France was lost to Germany amidst thousands of dead and loss of property. That is not a victory, but a crushing defeat.

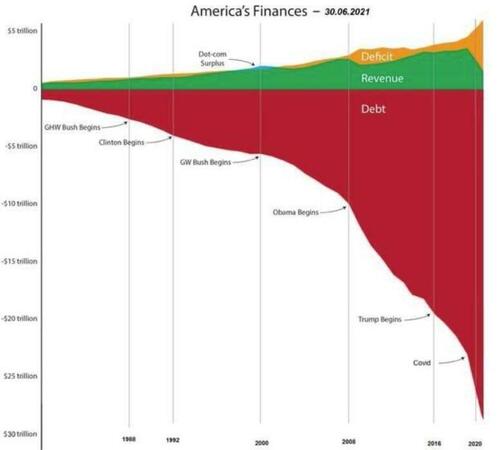
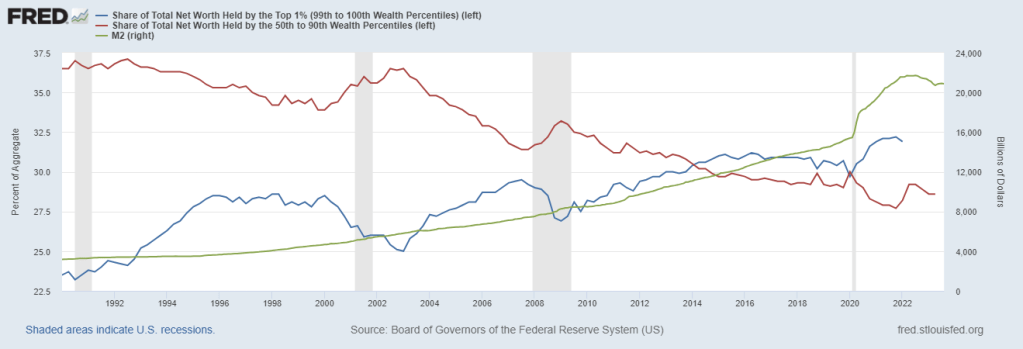
Just like my Paris example, Krugman’s claim the war on inflation is over and we won AT VERY LITTLE COST was grossly misleading and a big kerplunk (thud). Why? For one, the average American family is $7,400 POOR than in January 2021 when Biden became President. So, it looks like we know the cost of inflation and it was steep, not “very little cost.” Well, very little cost to elitist millionaires like Krugman.

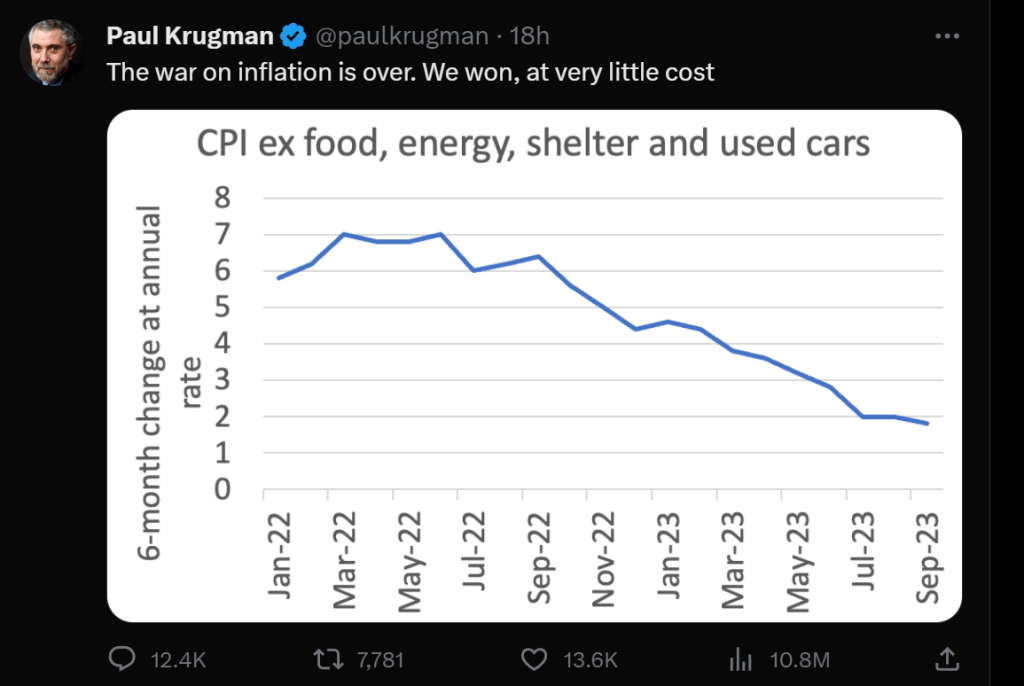
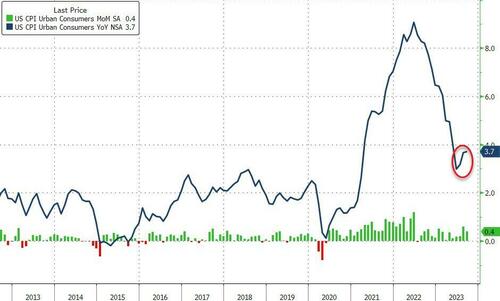
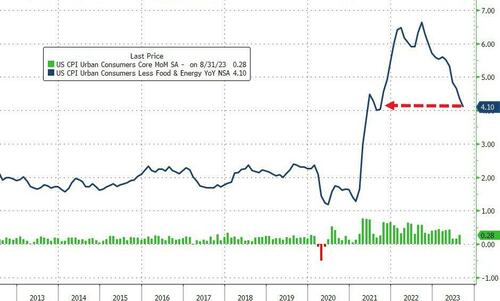
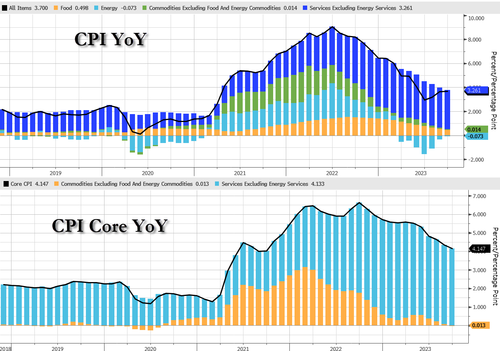
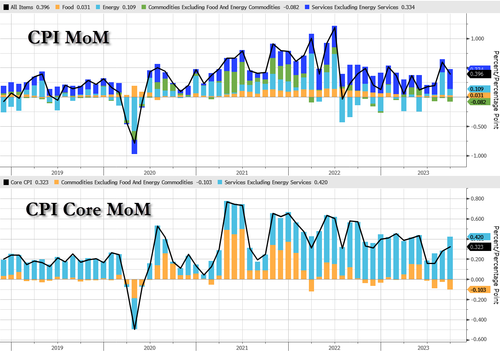
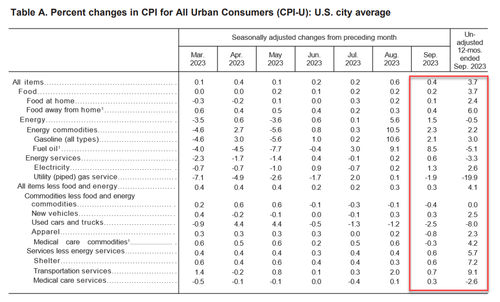
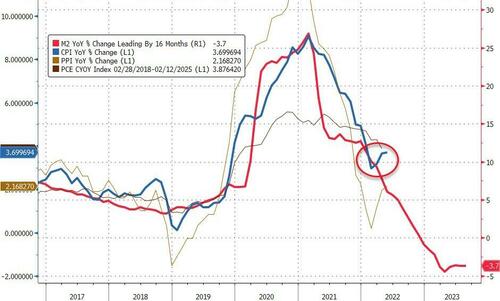
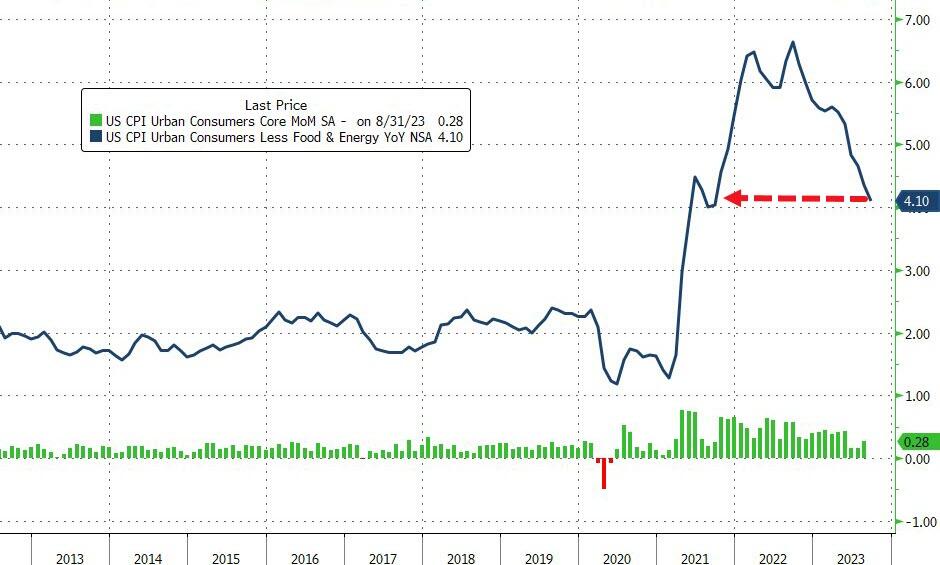
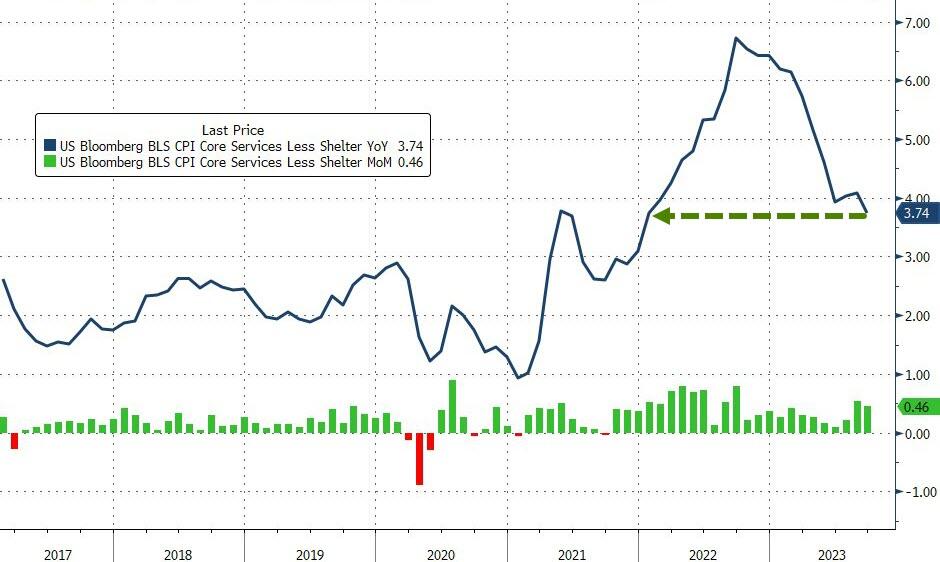
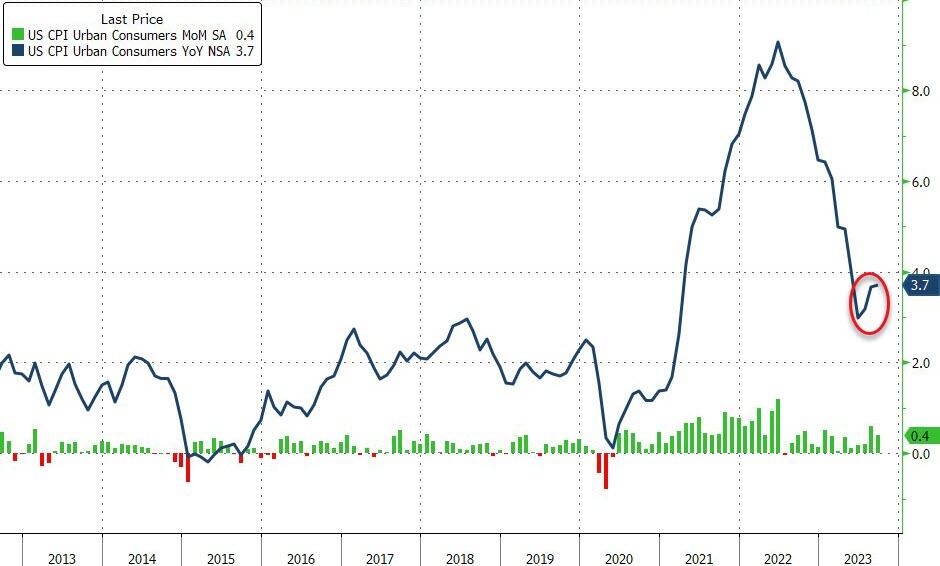
Krugman loves the recent inflation report from the BLS. Specifically, the 12-month change in the Consumer Price Index Less Food And Energy for September was 4.1%. Krugman focuses on the recent 6-month change being less than 2%. In Krugman’s mind, this is victory … core inflation has been tamed and inflation is at The Fed’s target rate of 2%.

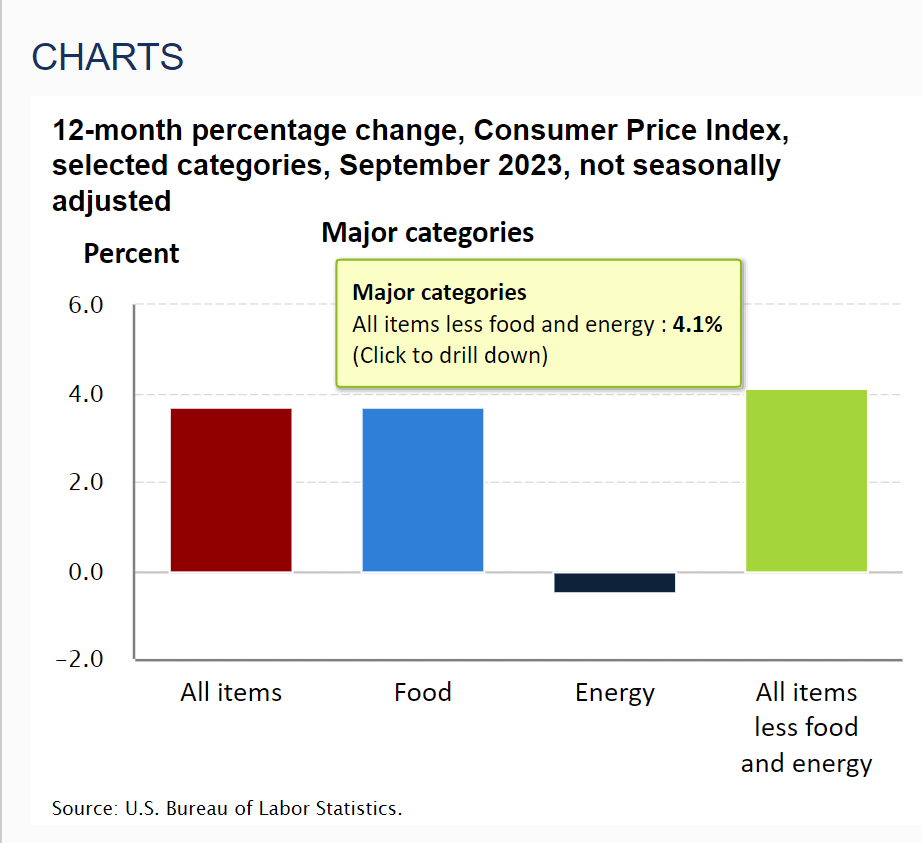
But before Krugman pops the champagne cap on the 1959 Dom Perignon for $42,350 (while the rest of us are drinking E&J Gallo’s Thunderbird), bear in mind that he is referring to the RATE OF GROWTH in prices, not the highly elevated levels of prices. Victory against inflation would be if prices returned to December 2020 levels.

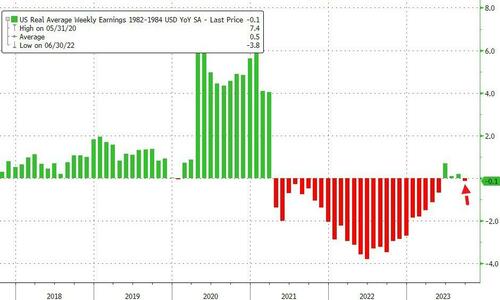
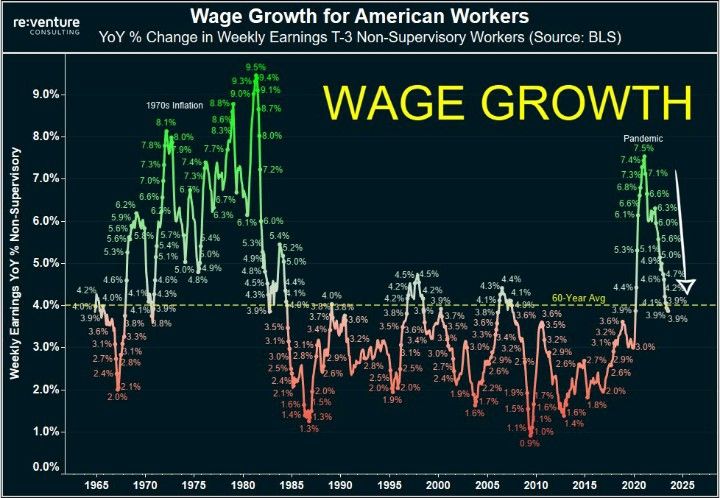
I pointed out yesterday that “real” wages contracted 0.1% YoY (after 3 months positive) in September. It is important to note that real wage growth was negative from 2021 until 3 months ago, but has gone negative yet again. Victory??

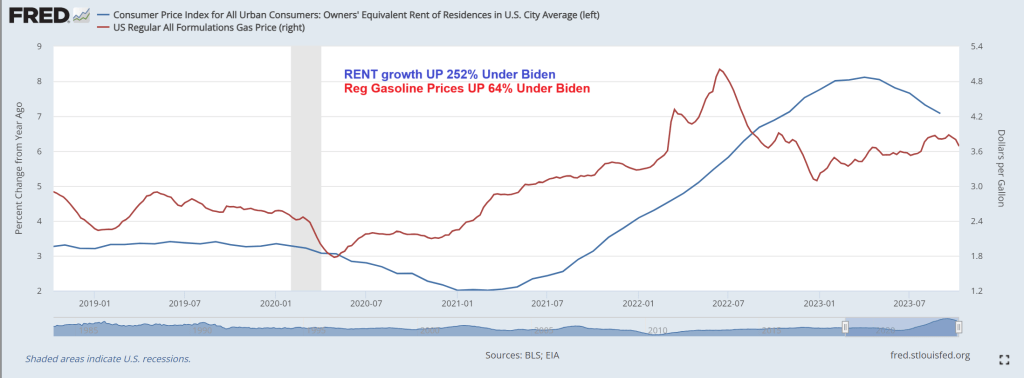
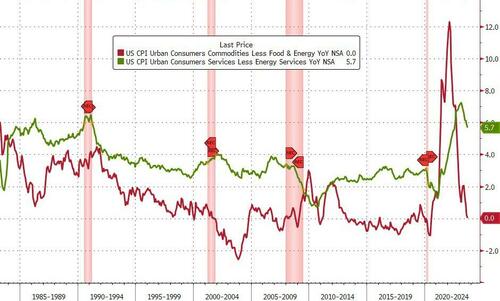
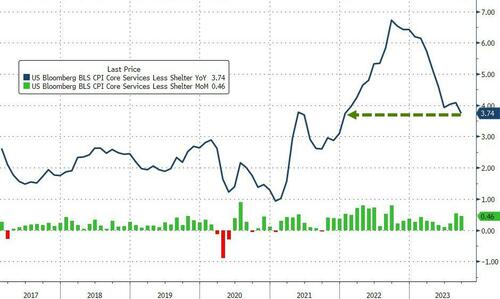
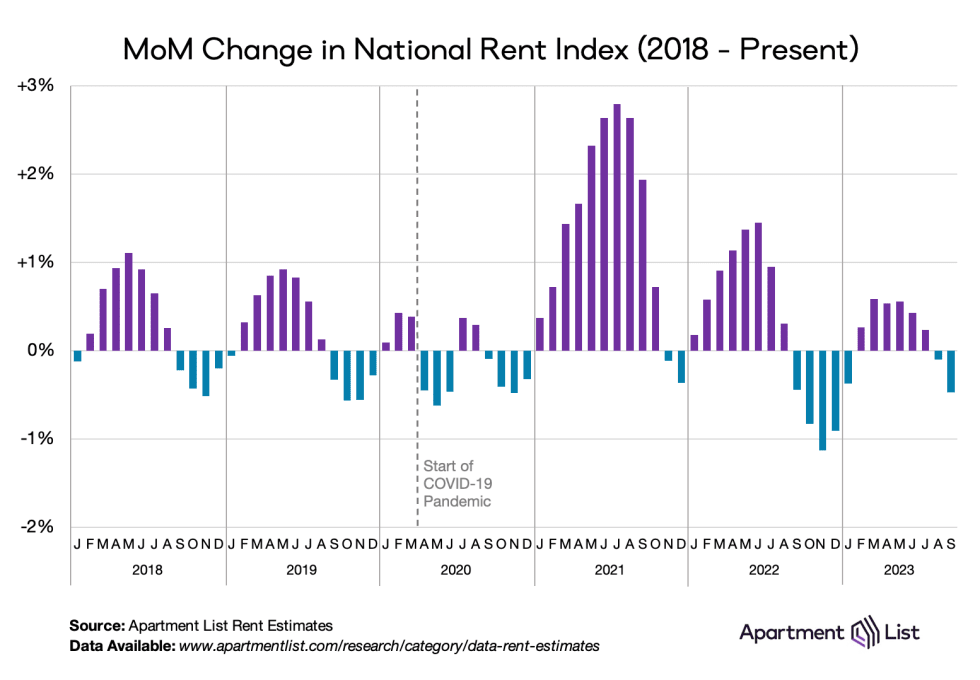
Krugman prefers core inflation, removing food, housing and energy. You know, the three things most Americans actually care about. Take shelter (or rent of residence) where rent is growing at a sizzling 7.1% YoY.

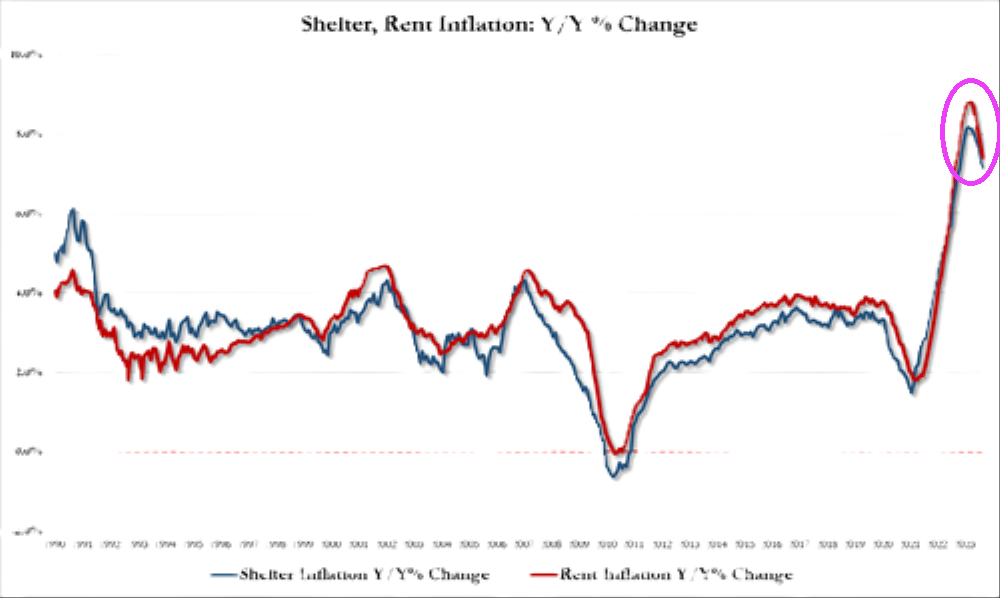
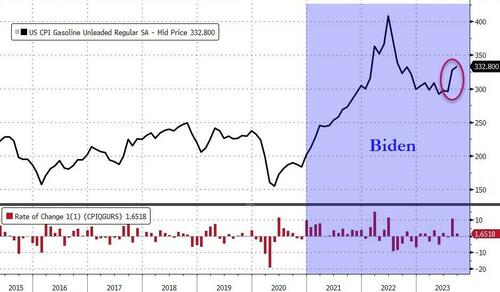
Under Biden and Congress’ reckless spending splurges (and inane Federal energy policies), regular gasoline prices are up 64%. Growth in rent of residence has grown 252%! So, Professor Krugman, Americans are far worse off than before Biden was President.

If prices return to December 2020 (or pre-Covid levels), I will declare a victory. But for right now, symbollically, the German army is occupying France and Paris with horrible suffering for the French people. In other words, Americans are still far worse off under Biden even though inflation is finally slowing.ew

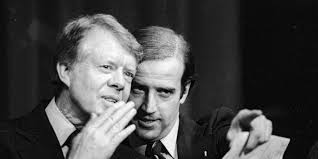
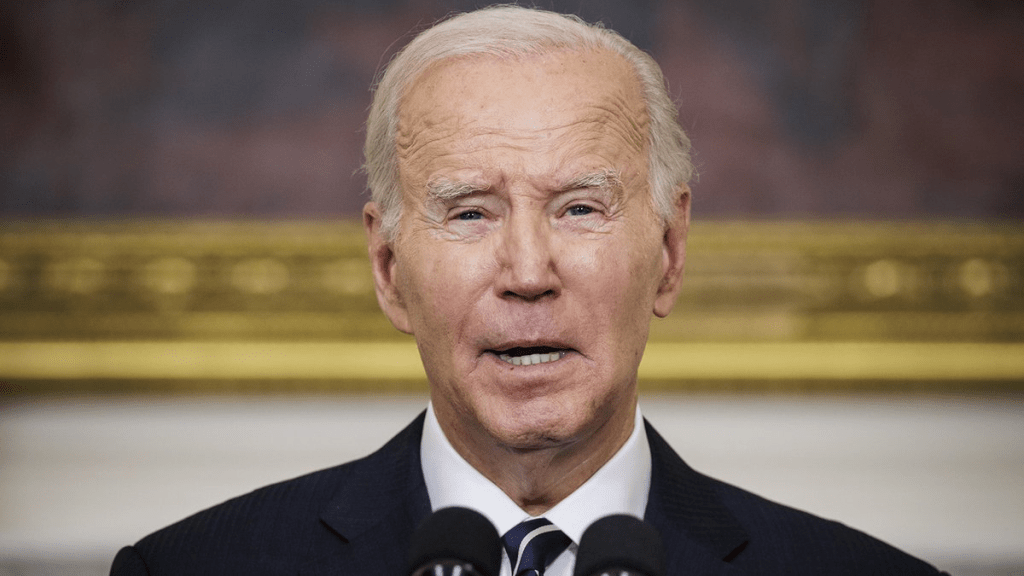
Speaking of France and World War II, maybe we should consider Joe Biden as today’s Pierre Laval, leader of Vichy France since Biden seems more concerned with pleasing Klaus Schwab and The World Economic Forum than America’s middle class and low wage worker (like Laval was concerned with that German leader Adolf Hitler thought).

Biden’s Incredible Shrinking Economy! Bank Credit Growth Negative For 10th Straight Week As Interest Rate On Short-term Loans Almost 10%!! (Ouch!)

Bidenomics is failing catestropically. Example? As interest rates rise to fight Biden’s Federal spending splurges, bank credit growth slowed to -0.41% YoY for the 10th straight week of negative credit growth.

While interest paid on short-term loans almost 10%!!

“Jimmy, watch me tank the economy even worse than you did!”

Gimme (Expensive) Shelter! Headline CPI Hotter Than Expected, Core Remains Above 4.00% (Rent inflation 7.41%!)

Gimme (expensive) shelter!

Following August’s bigger than expected jump  (driven by surging energy prices and healthcare methodology changes)., September’s CPI was expected to slow (+0.3% MoM) with the YoY pace inching back lower (from 3.7% to 3.6%) after rebounding for two straight months.

However, headline CPI came in modestly hot at +0.4%, with YoY at 3.7% – that is the 3rd monthly rebound in a row.

Source: Bloomberg

Core CPI rose 0.3% MoM, with YoY sliding to +4.1% YoY (as expected)… it still hasnt been below 4.00% since May 2021….

Source: Bloomberg

Food and Commodities contribution to YoY CPI slowed while Services increased…

Goods inflation dipped back to unchanged YoY and Services CPI slowed to +5.7%…

Services stands out on A MoM basis…

Under the hood, gasoline continues to rise and used car prices drop…

Rent of primary residence and owner’s equivalent rent YoY both exceeeded 7%. Fixing a car/truck rose 10.2% (will people start to notice that repairing EVs is outrageously expensive?).

The index for all items less food and energy rose 0.3 percent in September, as it did in August.

  • The shelter index was the largest factor in the monthly increase in the index for all items less food and energy.
  • The shelter index increased 0.6 percent in September, after rising 0.3 percent the previous month. The index for rent rose 0.5 percent in September, and the index for owners’ equivalent rent increased 0.6 percent over the month.
  • The lodging away from home index increased 3.7 percent in September, ending a string of 3 consecutive monthly decreases.
  • Among the other indexes that rose in September was the index for motor vehicle insurance, which increased 1.3 percent after rising 2.4 percent the preceding month.
  • The indexes for recreation, personal care, new vehicles, and household furnishings and operations also increased in September.
  • The medical care index rose 0.2 percent in September, as it did in August.
  • The index for hospital services increased 1.5 percent over the month, and the index for physicians’ services was unchanged.
  • The prescription drugs index fell 0.7 percent in September.
  • The index for used cars and trucks fell 2.5 percent in September, after decreasing 1.2 percent in August.
  • The apparel index declined 0.8 percent over the month, and the communication index was unchanged.

The index for all items less food and energy rose 4.1 percent over the past 12 months.

  • The shelter index increased 7.2 percent over the last year, accounting for over 70% of the total increase in all items less food and energy.
  • Other indexes with notable increases over the last year include motor vehicle insurance (+18.9 percent), recreation (+3.9 percent), personal care (+6.1 percent), and new vehicles (+2.5 percent).

Gasoline prices continue to rise…

Shelter costs are slowing, but accounted for the largest part of core CPI…

  • Rent inflation 7.41%, down from 7.76% in August and the lowest since Sept 2022
  • Shelter inflation 7.15%, down from 7.27% in August and the lowest since Nov 2022

Bear in mind that while CPI very stale data is rising over 7%,  real-time rent indicators are in freefall. Apt List’s Sept rent drop was the biggest on record…

And perhaps most importantly, one silver lining is that The Fed’s new favorite inflation signal – Core Services CPI Ex-Shelter YoY slowed to +3.74% (despite jumping 0.46% MoM). That is the lowest YoY since Dec 2021…

Is this third straight monthly increase in CPI YoY an inflection point? Or is M2 still leading the trend?

Turning from the cost of things to the ability to pay, “real” wages contracted 0.1% YoY (after 3 months positive)…

This is not the soft-landing cruise lower in inflation that the market (and The Fed) was hoping for…

Damn It, Janet! Treasury Secretary Janet Yellen Suggests Much Lower For Much Longer (Make Rates Great Again or MRGA?)

Damn it, Janet! (Yellen)

Former Fed Chair Janet Yellen, notorious for leaving rates too low for too long (TLTL) and then suddely raising them after Donald Trump was elected President, wants rates lower again for much longer. Make rates great again (MRGA?).

On October 5, 2023, Treasury Secretary Janet Yellen made a very telling statement about the future course of interest rates.

YELLEN SAYS DEBT SERVICE COSTS WILL BE 1% OF GDP FOR THE NEXT DECADE. – Reuters

Her statement implies that the economy will be strong and the government will run budget surpluses, or interest rates will be near zero for the next ten years.

Instead of guessing what she is pondering, we do some math and arrive at the only possible answer.  

The Government Can’t Afford Today’s Interest Rates

Before walking through various scenarios to figure out what Yellen may be implying, it’s helpful to provide background on what drives her mindset. In our article The Government Can’t Afford Higher For Longer, Much Longer, we shared the following graph and commentary:

Total federal interest expenses should rise by approximately $226 billion over the next twelve months to over $1.15 trillion. For context, from the second quarter of 2010 to the end of 2021, when interest rates were near zero, the interest expense rose by $240 billion in aggregate. More stunningly, the interest expense has increased more in the last three years than in the fifty years prior.

The graph above is just the tip of the fiscal iceberg. Every month, lower-interest-rate debt matures and will be replaced with higher-cost debt.

Higher interest rates are an additional funding burden for the federal government. Janet Yellen surely understands the damaging situation and grasps that higher interest rates are not feasible given current debt levels.

Low-Interest Rates Make Debt Manageable

The government’s debt-to-GDP ratio has climbed three-fold since 1966. Yet, until very recently, the ratio of the federal interest expense to GDP was at its lowest level since 1966.

While the amount of debt rose sharply, its cost was offset by rapidly falling interest rates. As a result, higher debt levels were very manageable.

If $1 trillion of debt with a 4% coupon matures, and the Treasury replaces it with $2 trillion at a 2% coupon, the interest expense doesn’t change despite doubling the debt. While a simplified example, that is essentially what has occurred for the last 30 years.

The following graph compares the 5-year U.S. Treasury note and the implied cost of funding the government’s debt.

In time, as lower interest rate debt is replaced with higher interest rate debt, the benefits of lower rates work in reverse. 

“Debt Service Costs At 1%” – Is It Possible?

We return to Janet Yellen’s message and discuss why she is likely correct.

Balanced Budgets and Unicorns

In the five years leading up to the pandemic, nominal GDP grew at 5.03% annually. Let’s optimistically assume growth continues at 5% consistently for the next ten years. Now, let’s tack on an even bolder presumption: the government balances its budget every year for the next ten years. Thus, the amount of outstanding debt will remain constant. For context, in the last 57 years, there has only been one year in which the amount of debt has not increased.

In such a far-fetched scenario, the debt-to-GDP ratio would drop considerably to 70%. However, interest costs would equal 2% of GDP. Such is much better than the current 3.36% but double Janet Yellen’s 1% objective.

Budget surpluses for the next ten years would lower interest expenses even more and possibly get the interest expense to GDP ratio to 1%. However, the odds of a unicorn spraying rainbows across the sky and the government running a surplus are the same: zero percent.

Consequently, we exclude surpluses as a viable way to reduce the interest expense to a more manageable level.

Budget Deficits And The Magic Of Low-Interest Rates

Balanced budgets or surpluses are unrealistic, given the political and fiscal trends. Further, the economy relies heavily on government spending. While fiscal prudence would be good in the long run, the short-run effect would be a recession.

Instead of using pipe dreams as scenarios, let’s get realistic. The more likely, albeit still optimistic, scenario involves the debt and GDP growing at the same rate. Let’s also assume interest rates remain at current levels. In this exercise, we assume an average borrowing cost of 4.75%, which is a little below the current weighted average funding cost for the government. Under this “realistic” picture, interest expense would climb to 5.6% of GDP.

The only logical variable in the equation that can make Janet Yellen correct is the future interest rate.

To arrive at Yellen’s 1% figure, assuming debt grows at the rate of GDP, interest rates must be much lower.

In time, a weighted average interest rate of 0.85% would put the nation’s interest expense at 1% of GDP.

When Janet Yellen tells us the debt cost to GDP ratio will be 1% over the next ten years, she is really saying interest rates will be below 1% for the next ten years.

Therefore, Janet Yellen must believe that the recent spike in inflation and yields is an anomaly. If the pre-pandemic economic and interest rate trends resume, she will be correct.

Summary

Part of Janet Yellen’s job is to exude confidence to its investors. In this case, it means telling the public that the current jump in interest expenses will not last. While she would probably prefer to be straightforward and say interest rates will be much lower, she must also be sympathetic to the Fed’s job of getting inflation down. Therefore, to walk the party line, she must speak in code, so to speak.

Whether you agree with Yellen’s projection or not, the following CBO graph projecting interest costs as a percentage of tax revenues, courtesy of Bianco Research, highlights that the government has no choice but lower for longer interest rates. The current level of interest rates will bankrupt the nation.

This makes sense. Two global elitists who look down with disdain and want to reprogram MAGA voters. Can we reprogram the MRGA types into letting rates float to market.

US Mortgage Purchase Demand (Applications) Down -19% Since Last Year (Mortgage Rates UP 165% Under Biden)

Now you know why the Mortgage Bankers Association, Home Builders and Realtors send a letter to Fed Chair Powell asking for rate hikes to cease. Mortgage rates are UP 165% under Biden.

But on to the demand side of mortgage finance.

Mortgage applications increased 0.6 percent from one week earlier, according to data from the Mortgage Bankers Association’s (MBA) Weekly Mortgage Applications Survey for the week ending October 6, 2023.

The Market Composite Index, a measure of mortgage loan application volume, increased 0.6 percent on a seasonally adjusted basis from one week earlier. On an unadjusted basis, the Index increased 1 percent compared with the previous week. The Refinance Index increased 0.3 percent from the previous week and was 9 percent lower than the same week one year ago. The seasonally adjusted Purchase Index increased 1 percent from one week earlier. The unadjusted Purchase Index increased 1 percent compared with the previous week and was 19 percent lower than the same week one year ago.

Bidenomics! National Debt Increases By Another Half-Trillion In Just 20 Days (To Infinity … And Beyond!) Don’t Forget About The $194+ TRILLION In Unfunded Liabilities That Politicians Promised The Non 1%!

Joe Biden is the Buzz Lightyear of the economy … and not in a good way. Under Biden and the Congressional spending sprees, the US debt is going to infinity … and beyond!

Twenty days.

That’s how long it took the Biden administration to add another half-trillion dollars to the national debt.

Bidenomics certainly requires a lot of borrowing and spending.

On September 15, the debt quietly blew passed $33 trillion. On October 5, it pushed above $33.5 trillion.

Don’t forget about the $194+ TRILLION in unfunded liabilities that politicians promised the non 1%.

By the way, it only took Biden and his willing accomplices in Congress three months to drive the national debt from $32 trillion to $33 trillion.

As of October 5, the debt stood at $33,513,382,512,663.51.

This is an unimaginable amount of money.

To put things into some perspective, the total output of the US economy as measured by GDP was only $25.46 trillion. That means the US economy would have to grow by 33.5% to cover the national debt.

At $33 trillion, the US national debt is more than the total economies of China, Japan, Germany, and the UK combined.

Looking at it another way, as of Oct. 10, every US citizen would have to write a $99,839 check in order to pay off the debt, and every American taxpayer is on the hook for $258,257.

Part of the reason the debt has increased so fast since June is because the Treasury is still rebuilding cash reserves that were depleted during the debt ceiling fight. But the fact remains – the federal government spends too much money.

It’s hard to overstate just how bad the US government’s fiscal situation has become. We have a trifecta of surging debt, massive deficits, and declining federal revenue. The chart below provides a visual perspective – and it doesn’t even account for the last few years.

This relentless increase in debt is happening when the economy is supposedly strong. Typically, a strong economy generates more tax revenue, and deficits shrink. But this isn’t really a strong economy. It is a house of cards built on debt. Fiscal stimulus is helping to prop it up.

That means there is no end in sight to this upward-spiraling national debt.

The biggest issue is the federal government spending addiction. In August alone, the Biden administration spent over $527 billion.

And of course, the federal government is always looking for new reasons to spend money. With war raging in the Middle East, there is already a proposal to send aid to Israel and possibly add more aid to Ukraine to that deal.

As Peter Schiff said in a recent podcast, the US can’t afford peace, much less war.

In fact, the US can’t even afford the interest on the debt.

Uncle Sam’s interest expense is already rising at an astronomical rate, and it’s set to explode.

The federal government has paid well over half a trillion dollars ($630 billion) on interest payments alone in fiscal 2023, with one month left to go. Interest on the debt paid in July exceeded the amount spent on national defense that month. Uncle Sam is well on the way to spending more on interest payments than any line item other than Social Security and Medicare.

The average interest rate on the debt is now at the highest level since 2011, coming in at 2.92% as of the end of August. But that’s still relatively low, and the debt is more than double what it was back in the good ol’ days of 2011.

Meanwhile, the average interest rate is poised to climb rapidly. A lot of the debt currently on the books was financed at very low rates before the Federal Reserve started its hiking cycle. Every month, some of that super-low-yielding paper matures and has to be replaced by bonds yielding much higher rates. That means interest payments will quickly climb much higher unless rates fall.

To give you an idea of where we’re heading, T-bills currently yield about 5.5%, the two-year yield is over 5% and the 10-year currently yields around 4.7%.

This has driven interest payments as a percentage of total tax receipts to over 35%. In other words, the government is already paying more than a third of the taxes it collects on interest expense.

If interest rates remain elevated, or continue rising, interest expenses could climb rapidly into the top three federal expenses. (You can read a more in-depth analysis of the national debt HERE.)

People tend to yawn at the ever-increasing national debt, but it is a ticking time bomb. Who knows how much time is left, but the timer is ticking relentlessly toward zero.

To infiniity and beyond … with Billions Biden! Biden’s 2024 Presidential election campaign photo.

Fear The Talking Fed! 10Y Treasury Yield Subsides As Fed Presidents Speak While Hamas Terrorizes Israel (Fed Halting Rate Increases OR Flight To Safety?)

Like President Biden enjoying a barbeque at The White House with a live band (probably NOT Justin Moore singing “Small Town USA”) while Hamas declared war on Israel and Americans are being held hostage with the promise of public executions of hostages livestreamed. Nothing that “Empathy Joe” does ever surprises me anymore, but I am surprise that various Federal Reserve Presidents will speak today while Hamas terrorizes Israeli and US citizens.

It could be that investors think that Talking Heads at The Fed will claim that Fed rate increases are over. Then again, the Iran/Hamas terror campaign against Israel is spookking markets, driving up oil and gold prices and driving up “flight to safety” in US Treasuries.

President Biden called on Americans in Israel to book a commercial flight home, even though Israel has cancelled all flights. Does Old Joe even read the news??

Fear The Talking Fed!

Two-Job Joe! How Bidenomics Is Causing Hardship For The Non-Elites (Top 1% Keep Gaining In Percentage Of Net Worth While Bottom 50% Keeps Declining)

“Two-job Joe” should be Biden’s new nickname for his economy wrecking ball known as Bidenomics.

The economic disaster known as Bidenomics (code for wealth transfers to the donor class) can be seen in the following chart. Non-elite households are struggling to cope with higher gasoline, food and house prices (rent) under Bidenomics.

As a result, the number of people holding 2 FULL-TIME JOBS hit an all-time high of 447,000 people. Biden spokesperson Karine Jean Pierre is likely to say “See? Bidenomics is working! Not every person is holding 2 full-time jobs to afford that Ford all-electric Lightning F-150 pickup truck!”

At the same time, wage growth YoY is crashing from Covid stimulus highs to pre-Covid levels.

And as The Fed prints more dinero (green line), the 1% (blue line) hoard a larger percentge of net worth while the bottom 50% (red line) keeps declining.

And then we have the REAL 10Y Treasury yield hitting 2.4%. This one’s gonna to hurt you for a long, long time.

It is getting harder and harder for non-elites to buy that Ford F1-150 all-electric Lightning Platinum for $94,000 plus tax. And you still have to pay $500 for the Ford Mobile Power Cord. OMG! For $94k, they couldn’t throw in the power cord?????

Does F stand for Failed? The honorary vehicle for Bidenomics!!

Bidenomics At Work! Mortgage Rates Hit Almost 8% (Highest Since July 2000 Under Bill Clinton), Deficits This High Usually Occur During Recessions And HIGH Unemployment

Joe Biden, who has always been a compulsive liar but at least sounded cognicent, is now babbling and whispering that Bidenomics works. But for who?

Clearly not for first time homebuyers or people looking to move. Bankrate’s 30-year mortgage rate is up to almost 8%, the highest since July 2000 and Willy Slick Clinton. That is a 176% increase in mortgage rates under the most inept “Economic Sheriff” in history.

Deficits? Deficits (which Biden makes outlandish claims) are usually only this big at times of HIGH unemployment and recessions. So, are the staggering deficits under Biden a precursor to a hard landing (recession)? Don’t listen to what Biden or KJP say!!!

Biden’s outlandish claims that he single handedly reduced the deficit by the most in history is, well, typical Biden bloviating. Actually, tax receipts soared after Covid lockdowns ended. Period. Now that stimulus is wearing out, deficits are climbing again.

The REAL Hateful Eight!

Bidenomics Is Working? Economic Outlook Index Plunges To Record Low In IBD/TIPP Poll (Net Savings As % Of Gross National Income Negative For 2nd Straight Quarter)

As Biden sleeps through the Hamas invasion of Israel, that is nothing new. Biden is sleeping through a disastrous downturn in the economy and pretending that Bidenomics is working. It isn’t Joe!

The IBD/TIPP U.S. Economic Optimism Index sank to a 12-year low in October as confidence in the near-term economic outlook crashed to the lowest level in the poll’s history. The survey casts doubt on the Federal Reserve’s justification for turning more hawkish last month: robust consumer spending.

The overall IBD/TIPP U.S. Economic Optimism Index dived 6.9 points to 36.3, the lowest since August 2011. Readings below the neutral 50 level reflect pessimism. The 6-month economic outlook index cratered 9.6 points to 28.7, a record low since the IBD/TIPP Poll began in early 2001.

That means the outlook suddenly appears worse than it was at the depths of the dot-com crash, the great financial crisis and the coronavirus pandemic.

And on the personal savings front, net savings as a percentage of gross national income was negative for the second straight quarter.

Sleepy Joe, wake up! The US economy is slowing down REALLY fast!