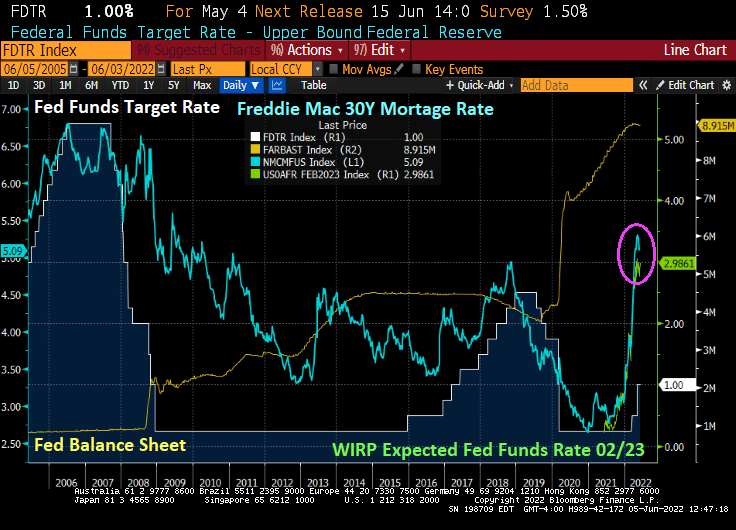
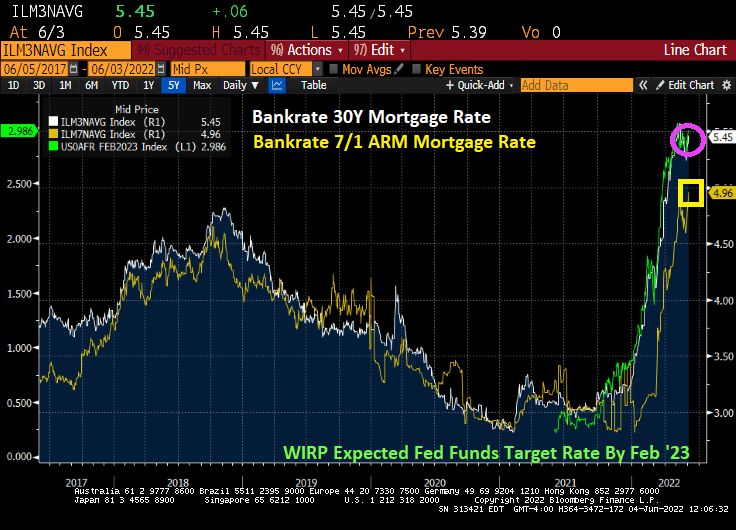
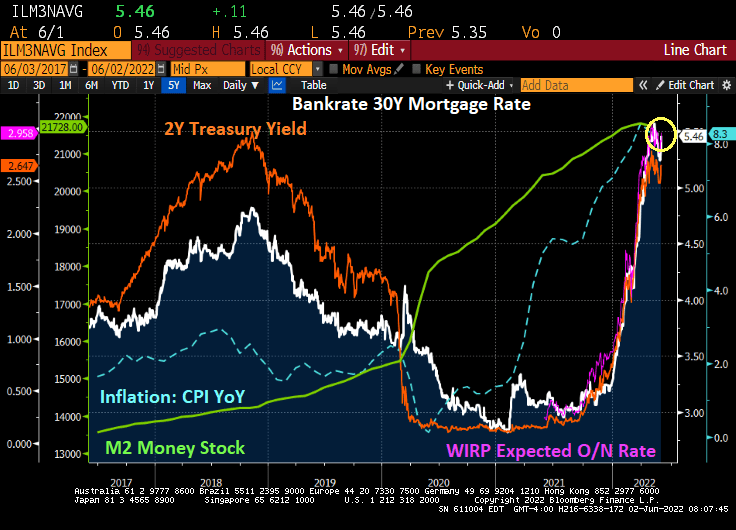
Meaning that The Fed has kept monetary stimulus in play for too long since late 2008 helping to lower mortgage rates from over 6% in November 2008 to 2.98% in November 2021. Then came “The Missouri Boat Ride” as The Fed signaled monetary tightening, leading to mortgage rates skyrocketing to their highest level since 2010.
The result of rising home prices AND mortgage rates? Housing acquisition prices (home prices * 30 year mortgage rates) have skyrocketed.
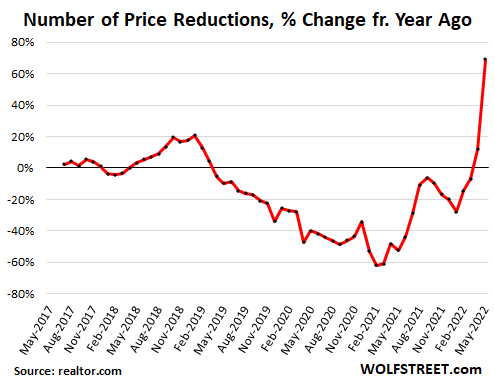
Between rising home prices and rising mortgage rates, we see that number of prices reductions increasing at nearly 70% YoY (chart courtesy of WolfStreet.com).
Of course, Congress and the media will never ask Janet Yellen (former Fed Chair [2013-2018] and current Treasury Secretary) WHY she kept massive monetary stimulus around for so long. Or why current Fed chair Powell did the same with Covid-related monetary stimulus.
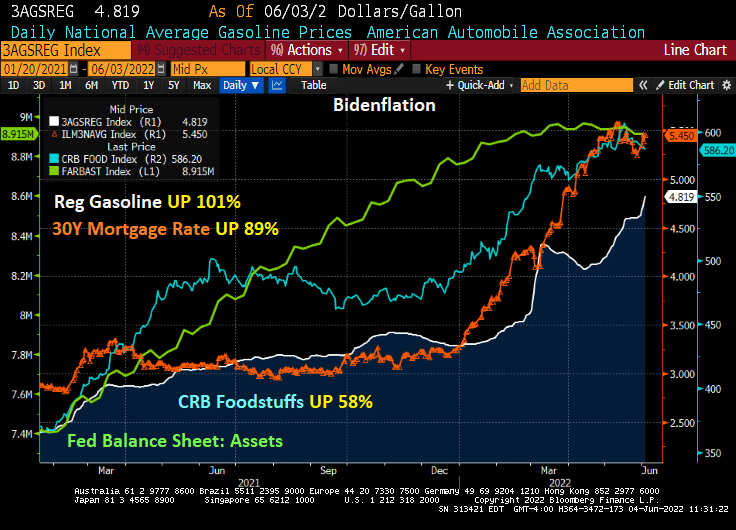
This is not the legacy that will endear President Biden to voters. Regular gasoline prices have risen 101% under Biden.
But it not just gasoline and diesel that are soaring (while the rest of us are sore!), CRB Foodstuffs are up 58% under Biden while the 30-year mortgage rate is up 89% under Biden.
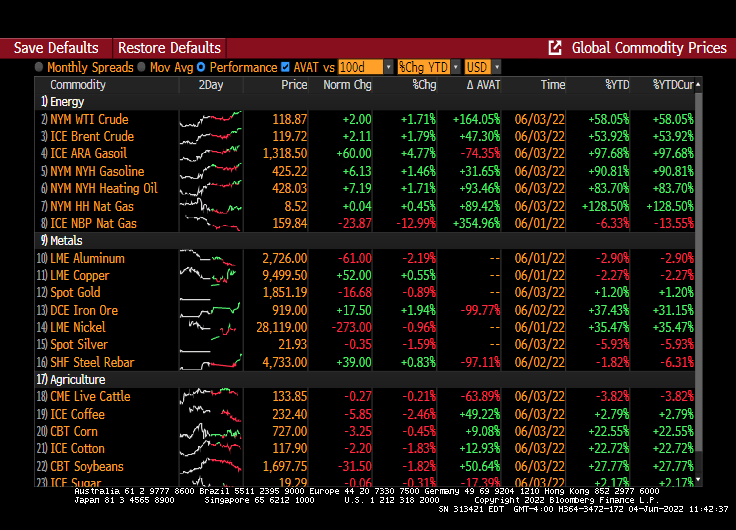
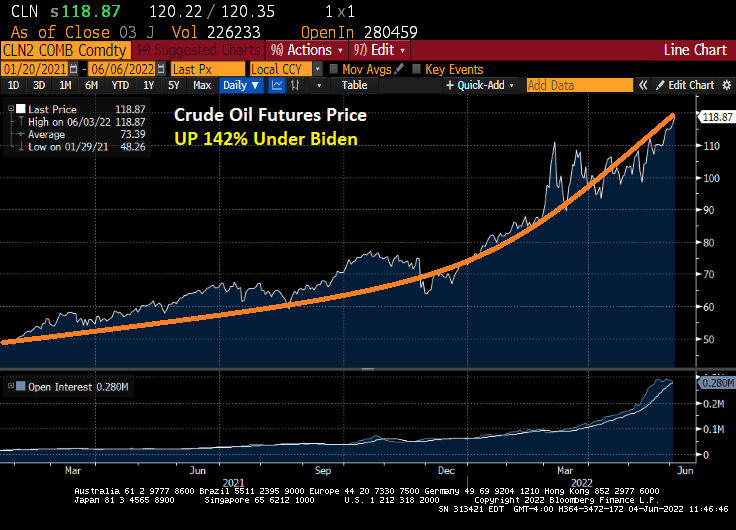
And this morning, WTI crude futures are up +1.71%.
And up 142% under Biden.
Prices are sizzling and clobbering the American middle class and low wage workers. But former Federal Reserve Chair and current US Treasury Secretary Janet Yellen never saw it coming.
Biden’s just killing us. And Powell is making up for Yellen’s keeping monetary stimulus too high for too long. Price? Mortgage rates are soaring.
Instead of President Ronald Reagan saying ““Mr. Gorbachev, tear down this wall” we need someone to tell President Biden and Federal Reserve Jerome Powell to “Stop driving up prices and making housing unaffordable.” Unfortunately, The Fed thinks that raising interest rates will temper price increases — it won’t. But it could tamper home price growth.
So what we are left with is soaring home prices AND soaring mortgage rates, leaving this scary chart. The housing cost index has risen 114.5% under Biden.
Its only going to get worse from here.
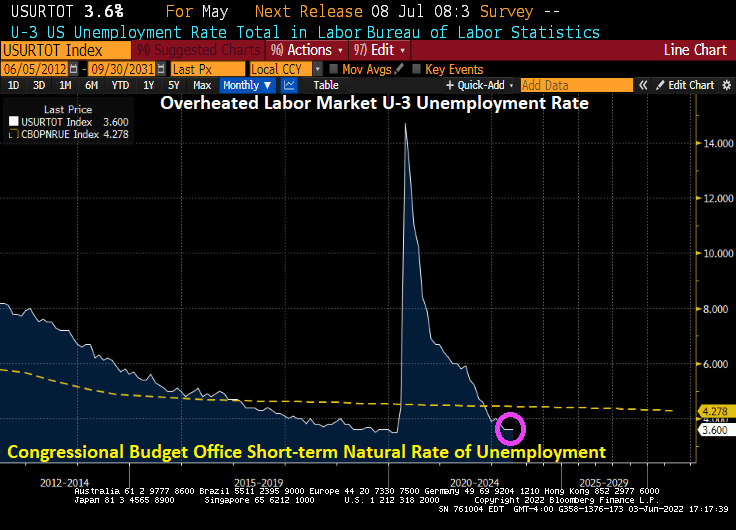
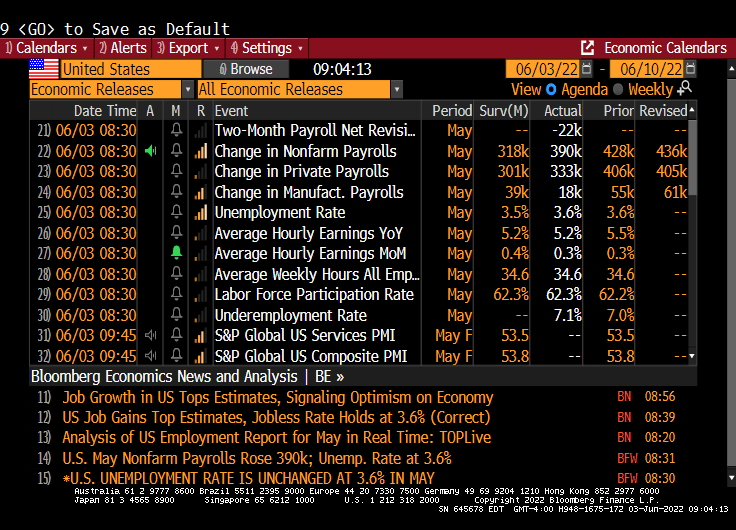
Today’s jobs report for May showed that the U-3 unemployment rate remained the same as April, 3.60%. However, that is lower than the NATURAL rate of unemployment of 4.445% indicating that the labor market is overheated. Historically, The Fed has tightened monetary policy by raising rates when this has happened. So, look for The Fed to keep raising rates.
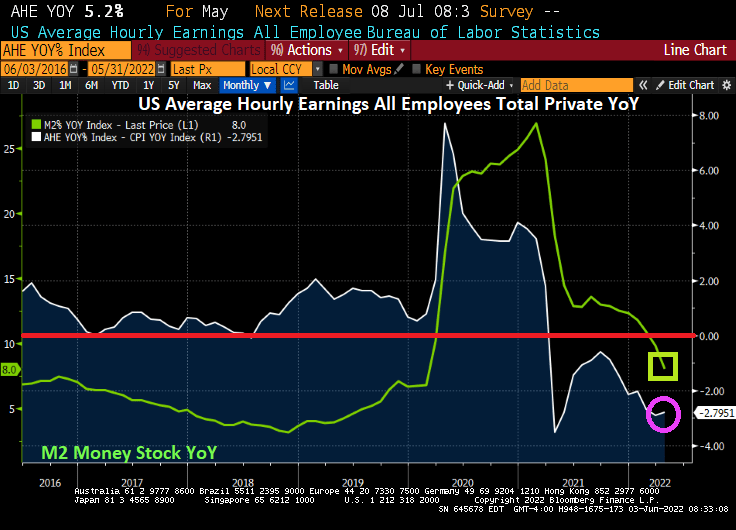
As I have mentioned before, REAL hourly wage growth is negative since March 2021, just after Biden signed his executive orders canceling drilling on Federal lands and cancelling the Keystone Pipeline. Later, he canceled off-shore drilling permits and Alaska drilling. Now we have REAL average hourly wages declining at -2.8% YoY as The Fed has been reducing M2 Money supply YoY.
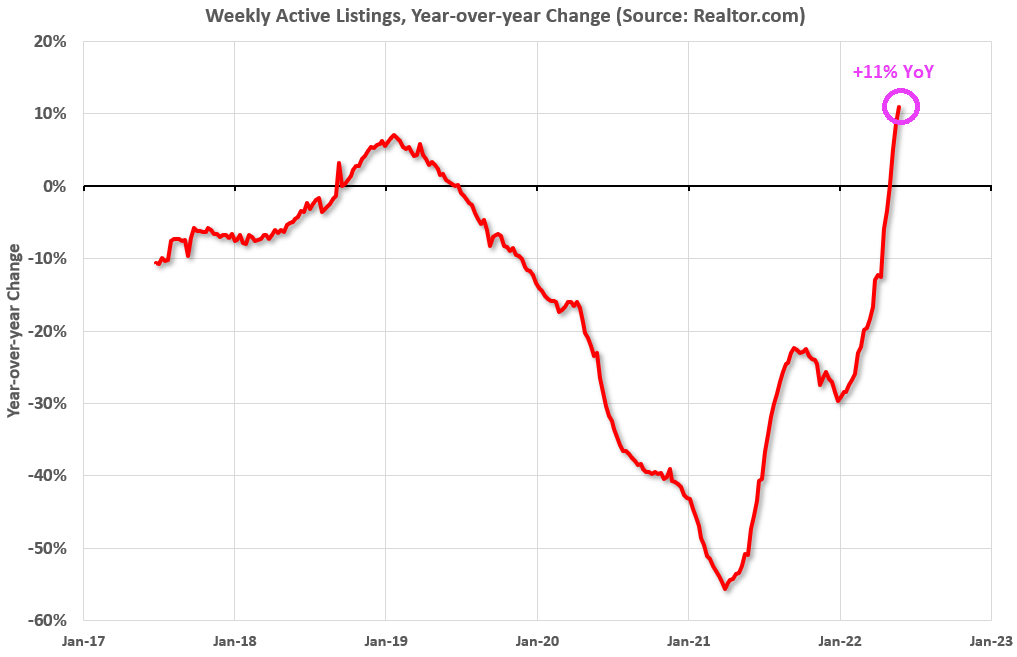
Listings of homes is up 11% YoY, the highest in several years.
Let’s see how the housing market does with soaring mortgage rates.
But let’s start with US average hourly earnings growth less inflation (aka, REAL hourly earnings). It printed at -2.8% YoY, meaning that inflation is causing REAL hourly earnings to fall.
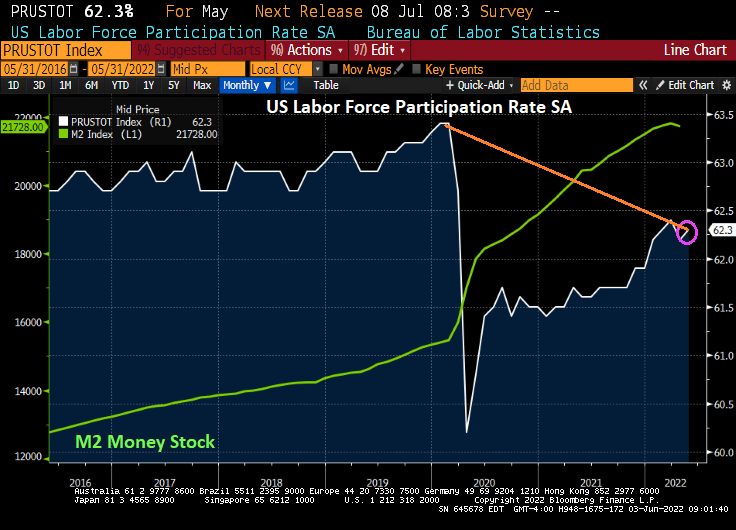
Labor force participation rose to 62.3%, but remains below pre-Covid levels.
The unemployment rate remains the same at 3.6%, but the underemployment rate rose to 7.1%.
Jobs added?
Employment in leisure and hospitality increased by 84,000 in May, as job growth continued in food services and drinking places (+46,000) and accommodation (+21,000). Employment in leisure and hospitality is down by 1.3 million, or 7.9 percent, compared with February 2020.
Employment in professional and business services rose by 75,000 in May. Within the industry, job gains occurred in accounting and bookkeeping services (+16,000), computer systems design and related services (+13,000), and scientific research and development services (+6,000). Employment in professional and business services is 821,000 higher than in February 2020.
In May, transportation and warehousing added 47,000 jobs. Employment rose in warehousing and storage (+18,000), truck transportation (+13,000), and air transportation (+6,000). Employment in transportation and warehousing is 709,000 above its February 2020 level.
Employment in construction increased by 36,000 in May, following no change in April. In May, job gains occurred in specialty trade contractors (+17,000) and heavy and civil engineering construction (+11,000). Construction employment is 40,000 higher than in February 2020.
In May, employment increased by 36,000 in state government education and by 33,000 in private education. Employment changed little in local government education (+14,000). Compared with February 2020, employment in state government education is up by 27,000, while employment in private education has essentially recovered. Employment in local government education is down by 308,000, or 3.8 percent, compared with February 2020.
Employment in health care rose by 28,000 in May, including a gain in hospitals (+16,000). Employment in health care overall is 223,000, or 1.3 percent, lower than in February 2020.
Manufacturing employment continued to trend up in May (+18,000). Job gains occurred in fabricated metal products (+7,000), wood products (+4,000), and electronic instruments (+3,000). Employment in manufacturing overall is slightly below (-17,000 or -0.1 percent) its February 2020 level.
Wholesale trade added 14,000 jobs in May, including gains in durable goods (+10,000) and electronic markets and agents and brokers (+6,000). Employment in wholesale trade is down by 41,000, or 0.7 percent, compared with February 2020.
Mining employment increased by 6,000 in May and is 80,000 higher than a recent low in February 2021.
Employment in retail trade declined by 61,000 in May but is 159,000 above its February 2020 level. Over the month, job losses occurred in general merchandise stores (-33,000), clothing and clothing accessories stores (-9,000), food and beverage stores (-8,000), building material and garden supply stores (-7,000), and health and personal care stores (-5,000).
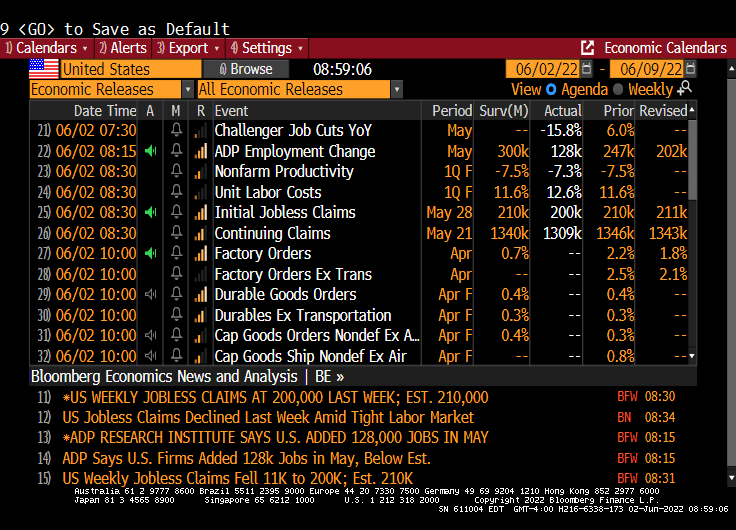
First, ADP US jobs added flopped (only 128.2k jobs added, the lowest reading under Biden and the massive Federal Reserve stimulus). Much lower than the expected 300k. Second, nonfarrm labor productivity fell in Q1 -7.3%. Third, unit labor costs soared to +12.6%.
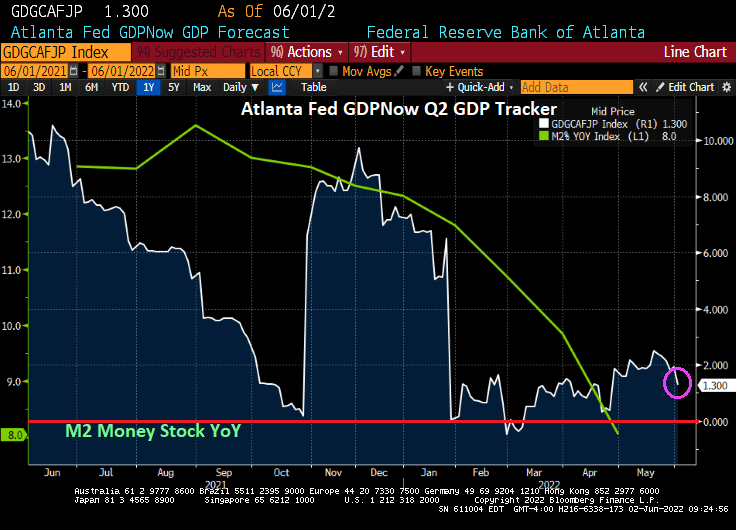
M2 Money stock YoY is falling, but remains at 8% YoY.
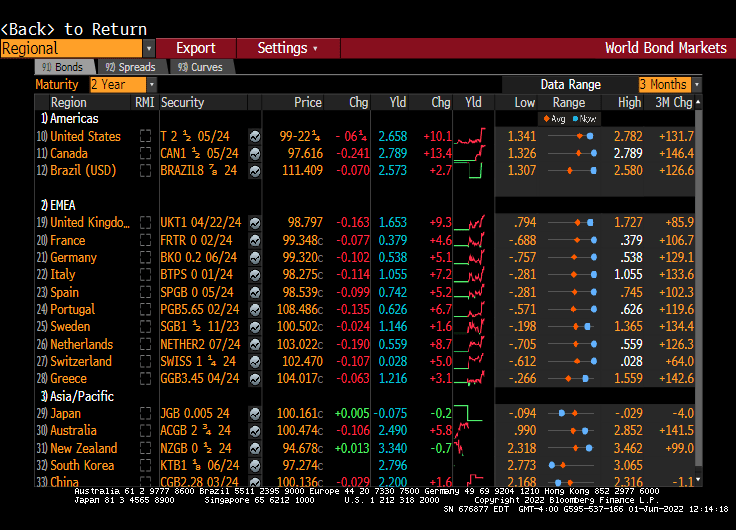
Here is the summary table for today.
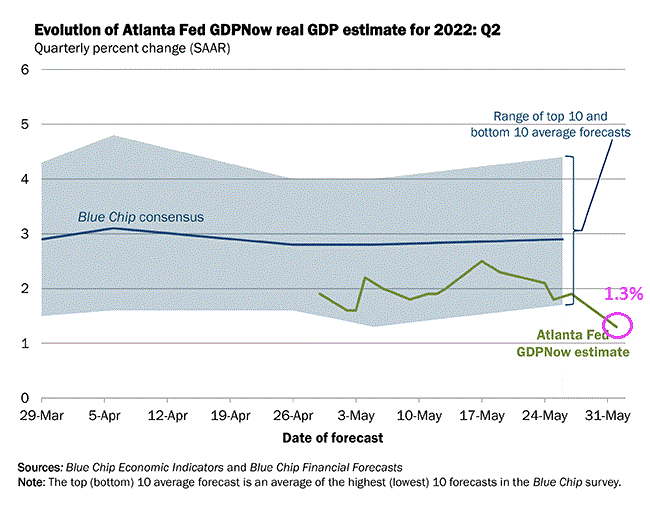
And then we have the Atlanta Fed GDPNow, real-time GDP tracker for Q2 at 1.3%.
As M2 Money growth slows, US GDP is slowing as well. Is this a monetary hangover??
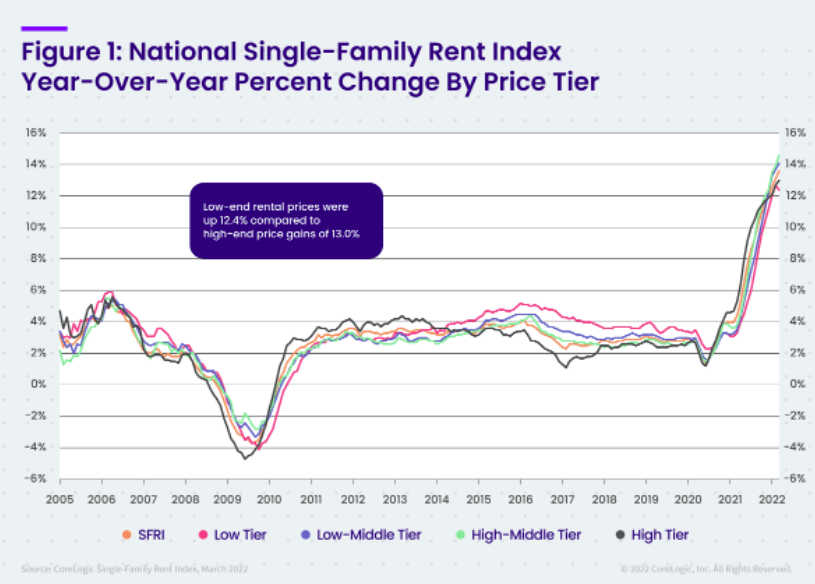
And, of course, rents are soaring for the American middle class and low wage workers.
President Biden met with Federal Reserve Chairman Powell to discuss how to control the inflation that is crushing the middle class and low-wage workers.
Here is a good example of why Biden is worried. There is a mid-term election on the horizon and people are angry and scared. Housing, generally the largest asset owned (or rented) by a household is simply unaffordable thanks, in part, to the over-stimulation of the economy by 1) The Federal Reserve in terms of money printing and 2) the Federal government in terms of fiscal stimulus in response to the Covid outbreak in March 2020.
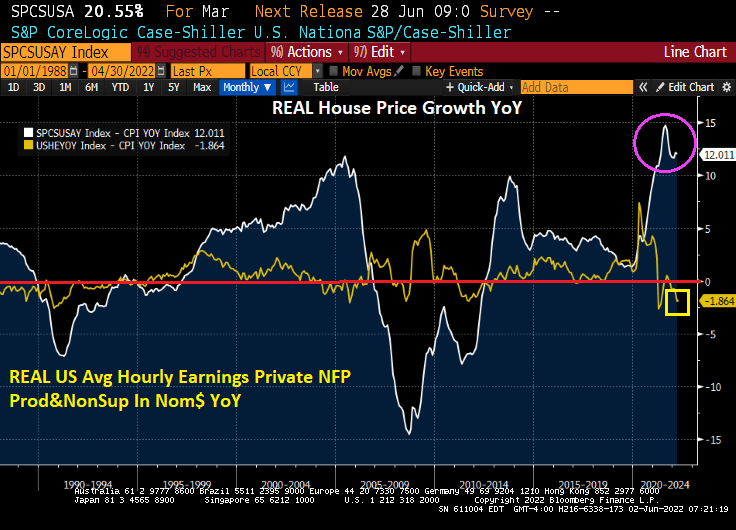
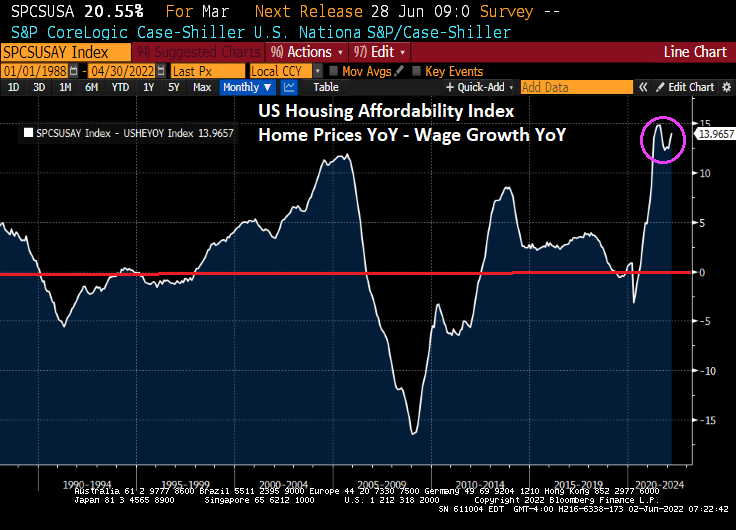
In nominal terms, the gap between US home prices (Case-Shiller National Home Price Index YoY – US Average Hourly Earnings YoY) is near the all-time high.
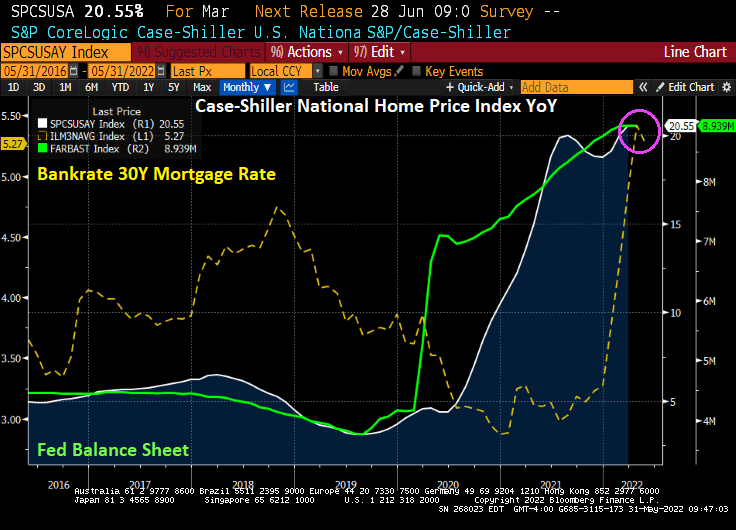
Yes, home price growth exploded upwards when The Fed rapidly expanded their balance sheet in response to the Covid outbreak … and only now are considering shrinking the balance sheet.
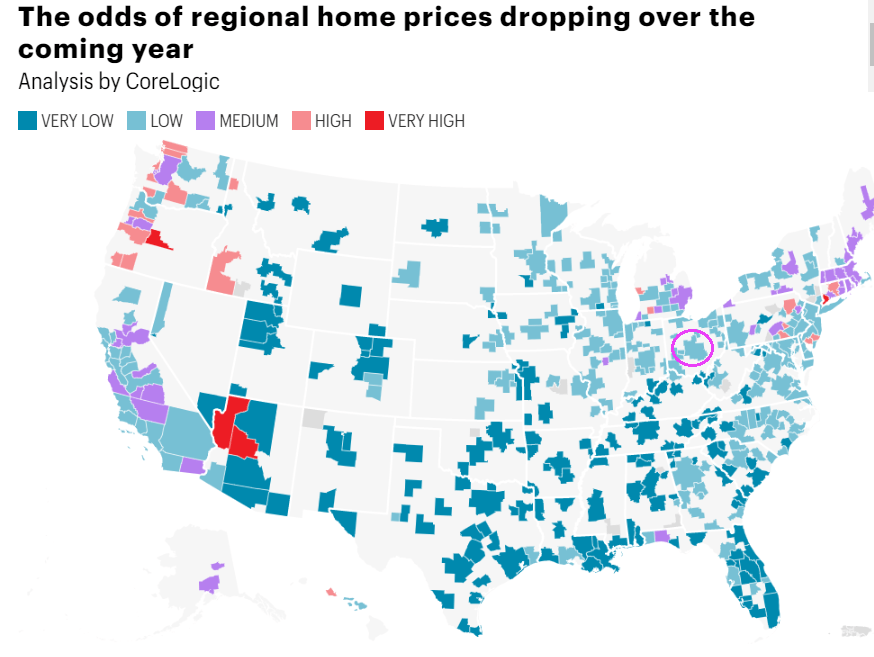
In terms of house prices, CoreLogic has a nice chart depicted the odds of home prices dropping over the coming year. I circled Columbus Ohio because that is where I am moving (knock on wood).
And then we have the 30-year mortgage rate rising with The Fed’s expected tightening of monetary policy. That will certainly make housing even less affordable, unless house price growth cools dramatically.
Adjusting for the appreciation in its assets the Fed had seen through the end of last year, the unrealized losses were an even larger $458 billion.
This makes the Ukrainian relief bill of $30 billion look like chump change. Although it is about the same amount as Biden’s student loan forgiveness plan which would about to $321 billion.
Nobody spends other peoples’ money like politicians and now The Federal Reserve. Who are also DC-based politicians.
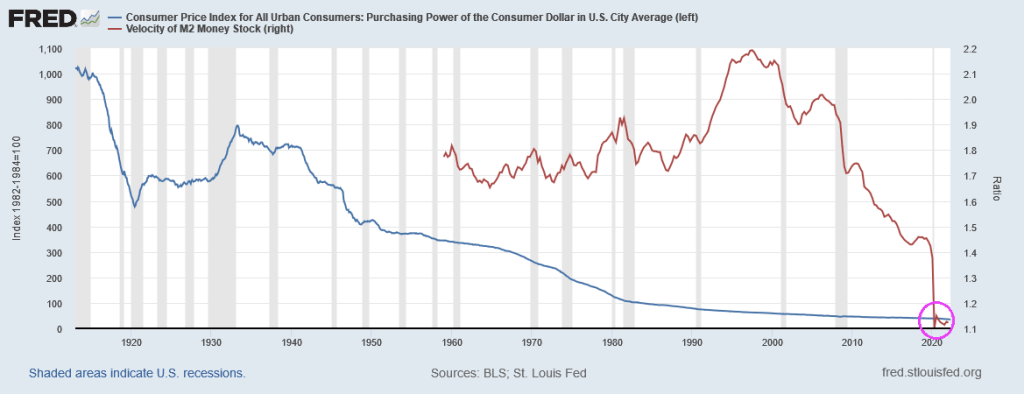
And yes, the purchasing power of the US Dollar and M2 Money Velocity (GDP/M2) appear to be collapsing like a dying star.
The Federal Reserve has been signaling a tightening of its loose monetary policy (essentially loose since the housing bubble burst of 2008 and the ensuing financial crisis). It is still loose as The Fed hasn’t really trimmed its massive balance sheet yet and has just raised it target rate to 1%.
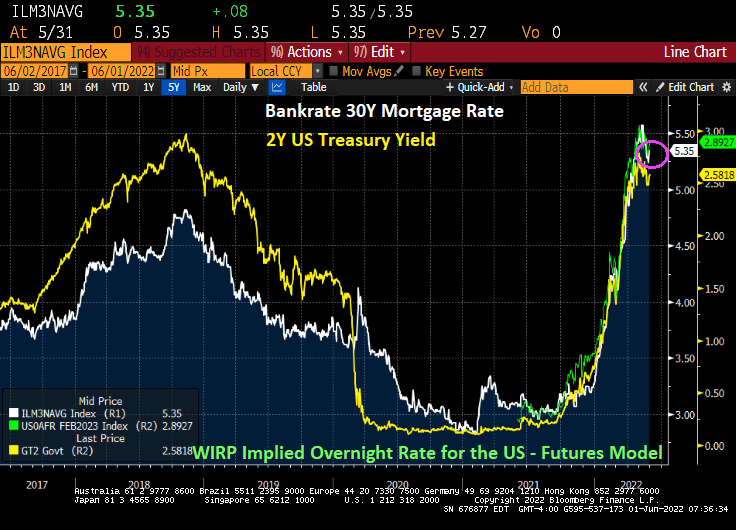
So, potential home owners have to pay 5.10% for a 30-year fixed-rate mortgage while the effective Fed Funds rate, the rate at which banks lend to each other, is a measly 0.83%. This puts consumers at a relative disadvantage to large Wall Street firms that are gobbling up houses at an accelerated rate.
With the US housing market slowing (thanks to The Fed’s signaling of monetary tightening), the question now is how far will The Fed go in its “War on Inflation!”?
You can see a major cause of inflation in the US since 2000: Federal spending and Federal (public) debt. During The Great Recession of 2008-2009, we saw inflation (CPI YoY) collapse into negative territory as Federal spending and debt soared. But the mini-recession of 2020 caused by the Covid governments shutdowns led to TWO surges in Federal spending and debt: Covid relief followed by the infrastructure spending bill. Combined with Biden’s anti-fossil fuel executive orders and massive splash of Federal spending in to the economy, we have inflation soaring.
If surges in Federal spending (requiring surges in Federal debt) have gone away (except for $40 billion in Ukrainian relief and Biden’s possible student loan cancellation of $10,000 that will cost an estimated $321 billion … and help drive up college tuitions even further), we may be over the “twin gorgings” of the Covid spending spree. This alone may result is a decline in the inflation rate.
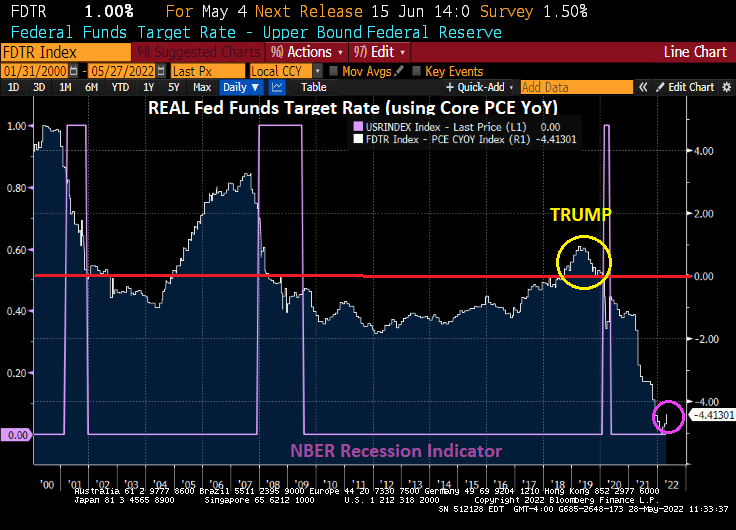
Where do we sit today with the REAL neutral rate? The REAL Fed Funds Target Rate (upper bound) is -4.41%. It was in positive territory during the Trump years. But then Covid struck.
No wonder Wall Streeters like to go “Down To The Nightclub!” The Fed still has not taken the monetary stimulypto away, but have taken it away for consumers buying housing.
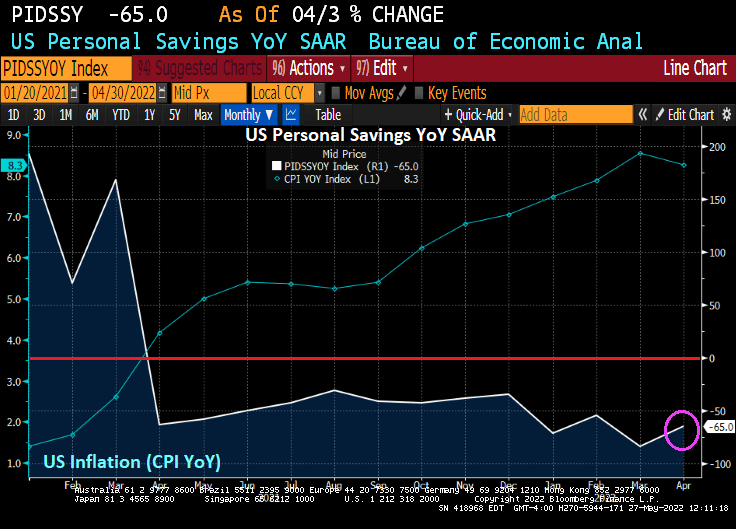
Americans’ Savings Rate Drops to Lowest Since 2008 as Inflation Bites.
Yes, inflation really bites. In fact, as US inflation is near the 40-year high, US personal savings declined -65% YoY as consumers try to cope with rising prices.
Its not only that personal savings is crashing in the face of inflation, revolving debt has soared as consumers try to cope with rising prices. I call this chart “The Biden Bowl.” Soaring consumer credit card debt with crashing personal savings.


You must be logged in to post a comment.