Simply Unaffordable! Real Home Price Growth At 12% YoY, Real Wage Growth At -1.864% (Inflation Making Americans Suffer As Mortgage Rates Rise FAST)

Simply unaffordable!

President Biden met with Federal Reserve Chairman Powell to discuss how to control the inflation that is crushing the middle class and low-wage workers.

Here is a good example of why Biden is worried. There is a mid-term election on the horizon and people are angry and scared. Housing, generally the largest asset owned (or rented) by a household is simply unaffordable thanks, in part, to the over-stimulation of the economy by 1) The Federal Reserve in terms of money printing and 2) the Federal government in terms of fiscal stimulus in response to the Covid outbreak in March 2020.
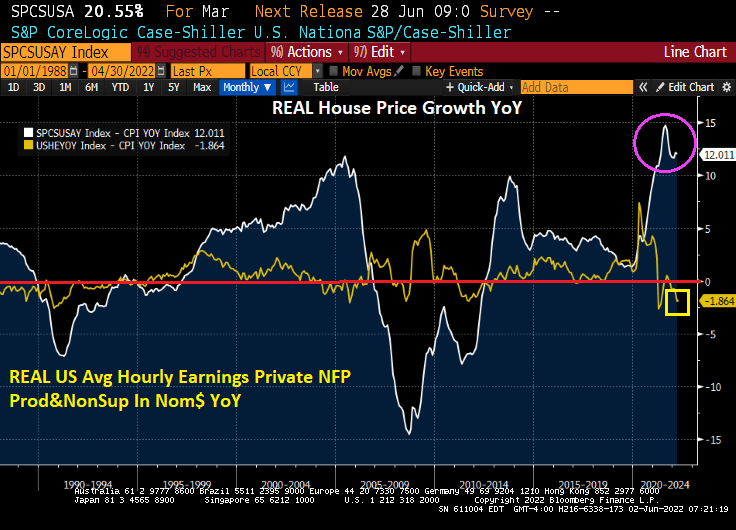
In nominal terms, the gap between US home prices (Case-Shiller National Home Price Index YoY – US Average Hourly Earnings YoY) is near the all-time high.
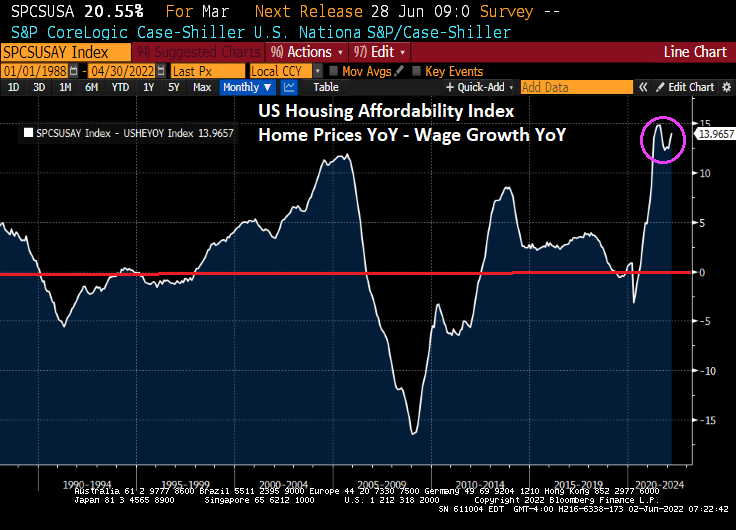
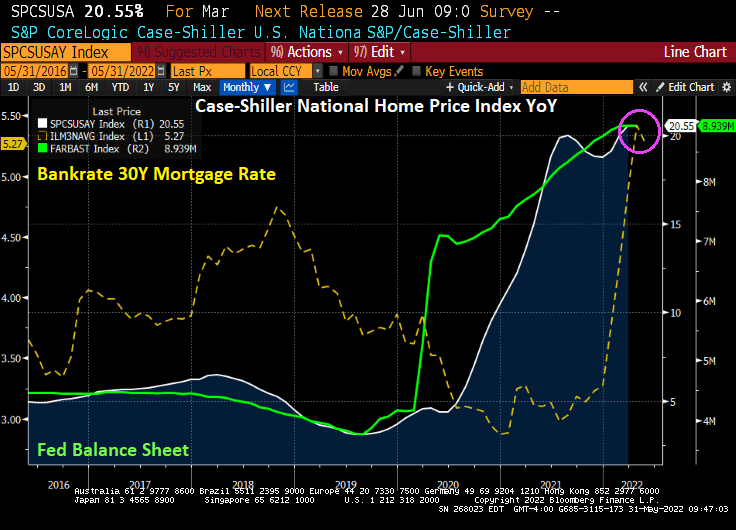
Yes, home price growth exploded upwards when The Fed rapidly expanded their balance sheet in response to the Covid outbreak … and only now are considering shrinking the balance sheet.
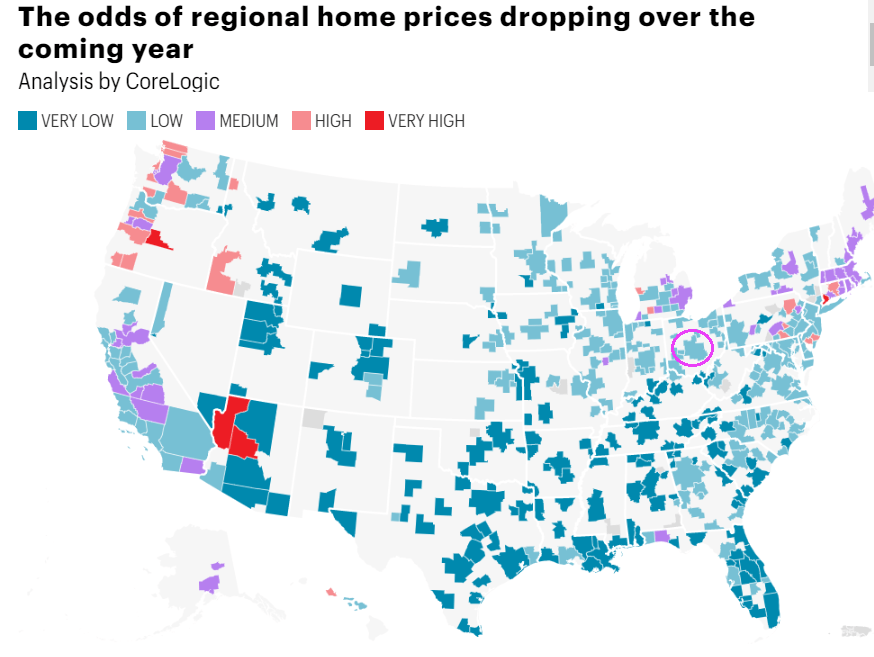
In terms of house prices, CoreLogic has a nice chart depicted the odds of home prices dropping over the coming year. I circled Columbus Ohio because that is where I am moving (knock on wood).
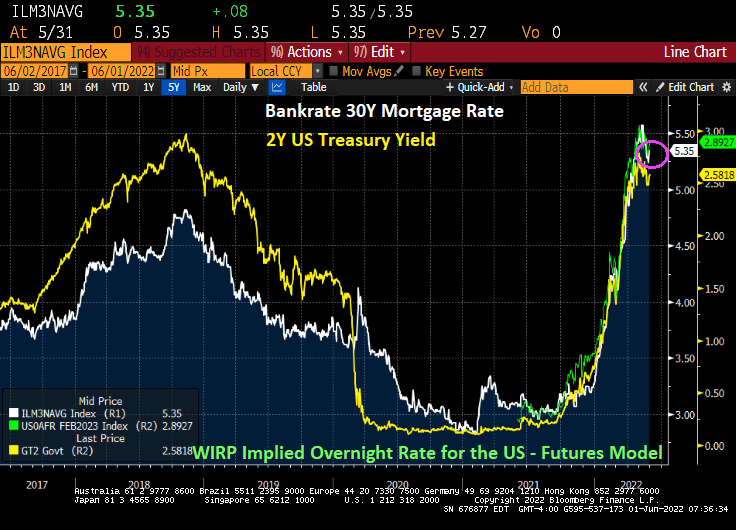
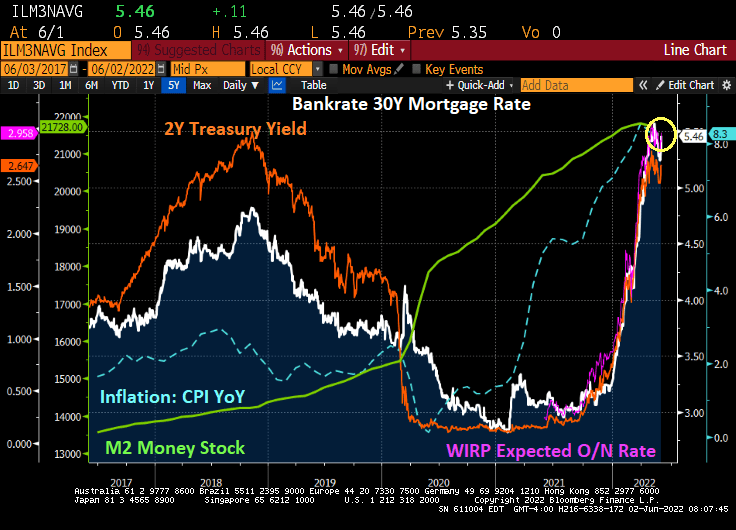
And then we have the 30-year mortgage rate rising with The Fed’s expected tightening of monetary policy. That will certainly make housing even less affordable, unless house price growth cools dramatically.
You might as well face it, we’re addicted to gov.

Doctor, doctor (Yellen), we’ve got a bad case of UNAFFORDABLE HOUSING.
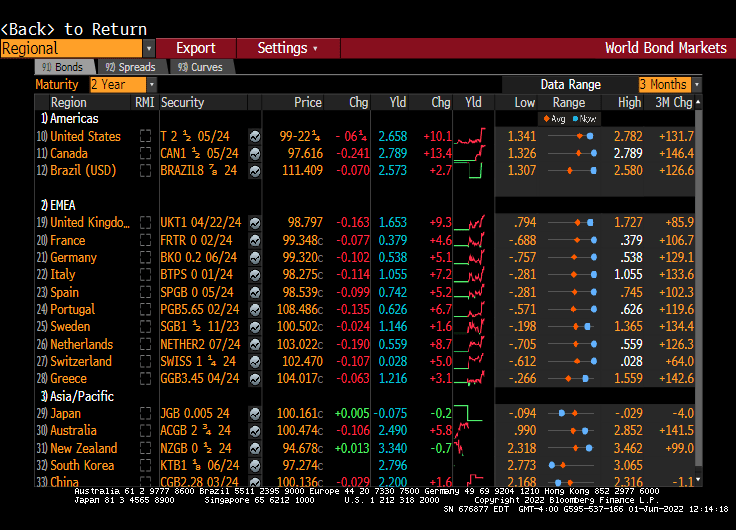
Step! 2-year Treasury Yield Rises +10.5 Basis Points On Fed Tightening, 10Y-2Y Yield Curve Flattens

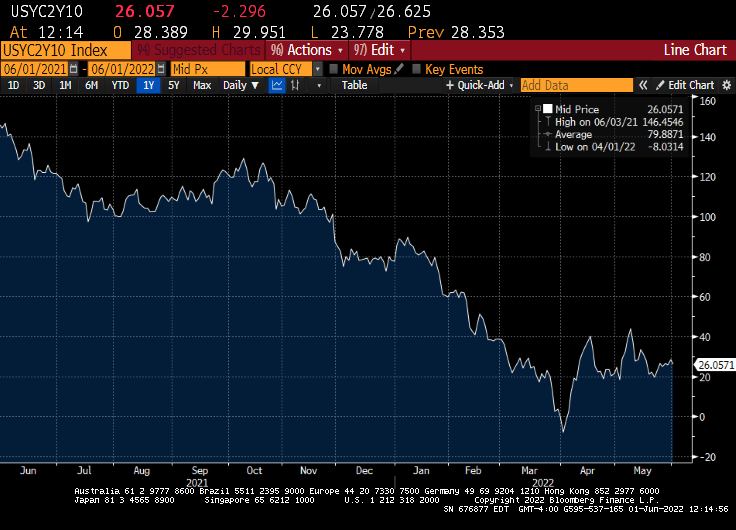
Another 10 basis point jumps in Treasury yields, this time at the 2-year Treasury Note.

The 10Y-2Y Treasury slope just flattened to +26 BPS.

Another step in rising mortgage rates!

Washington DC is anything but Harmony Hall.

Fed Carrying $330B In Unrealized Losses On Its Assets As of Q1 (Purchasing Power Of US Dollar And M2 Money Velocity Collapsing Like Dying Star)

Yikes! One of the unmentioned costs of Fed monetary tightening is the one to US taxpayers.

Fed carrying $330B in unrealized losses on its assets according to Q1 financial statement. Which US tax payers are on the hook.

Adjusting for the appreciation in its assets the Fed had seen through the end of last year, the unrealized losses were an even larger $458 billion.

This makes the Ukrainian relief bill of $30 billion look like chump change. Although it is about the same amount as Biden’s student loan forgiveness plan which would about to $321 billion.

Nobody spends other peoples’ money like politicians and now The Federal Reserve. Who are also DC-based politicians.

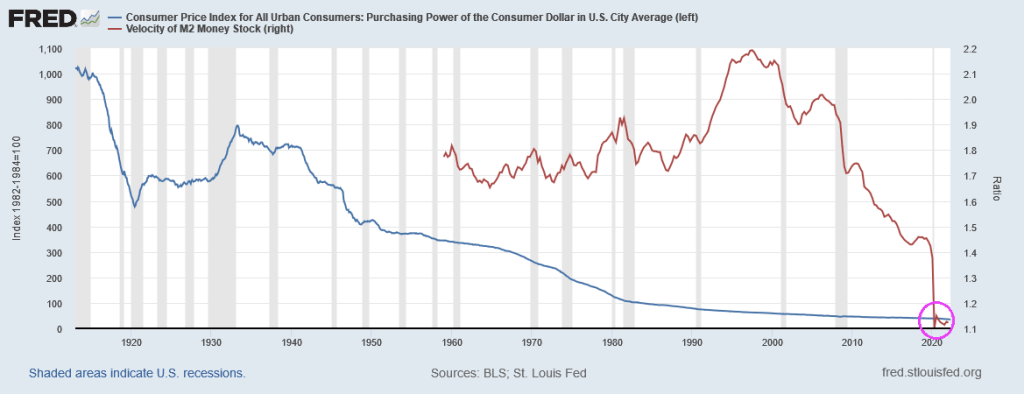
And yes, the purchasing power of the US Dollar and M2 Money Velocity (GDP/M2) appear to be collapsing like a dying star.

The Fed Is Pitting Wall Street Against Main Street, Investor Share Of Home Purchases Soars (How Far Will The Fed Go With “Tightening”?)

The Federal Reserve has been signaling a tightening of its loose monetary policy (essentially loose since the housing bubble burst of 2008 and the ensuing financial crisis). It is still loose as The Fed hasn’t really trimmed its massive balance sheet yet and has just raised it target rate to 1%.

So, potential home owners have to pay 5.10% for a 30-year fixed-rate mortgage while the effective Fed Funds rate, the rate at which banks lend to each other, is a measly 0.83%. This puts consumers at a relative disadvantage to large Wall Street firms that are gobbling up houses at an accelerated rate.

RealtyTrac has a Attom-sourced table of investor purchases of housing from Q3 2021, before The Fed started helping to crank-up mortgage rates for consumers.

With the US housing market slowing (thanks to The Fed’s signaling of monetary tightening), the question now is how far will The Fed go in its “War on Inflation!”?

You can see a major cause of inflation in the US since 2000: Federal spending and Federal (public) debt. During The Great Recession of 2008-2009, we saw inflation (CPI YoY) collapse into negative territory as Federal spending and debt soared. But the mini-recession of 2020 caused by the Covid governments shutdowns led to TWO surges in Federal spending and debt: Covid relief followed by the infrastructure spending bill. Combined with Biden’s anti-fossil fuel executive orders and massive splash of Federal spending in to the economy, we have inflation soaring.

If surges in Federal spending (requiring surges in Federal debt) have gone away (except for $40 billion in Ukrainian relief and Biden’s possible student loan cancellation of $10,000 that will cost an estimated $321 billion … and help drive up college tuitions even further), we may be over the “twin gorgings” of the Covid spending spree. This alone may result is a decline in the inflation rate.

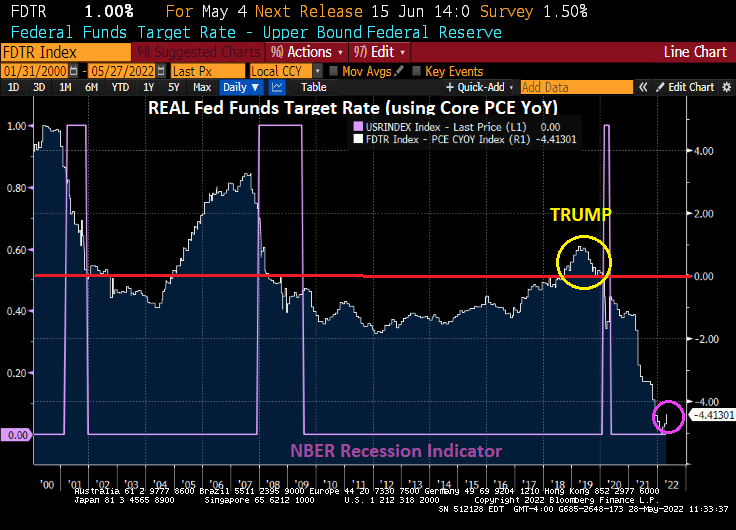
Where do we sit today with the REAL neutral rate? The REAL Fed Funds Target Rate (upper bound) is -4.41%. It was in positive territory during the Trump years. But then Covid struck.

So, we sit here today with Fed Monetary policy “loose as a goose.” And Wall Street investors “drunk as a skunk” on Fed Stimulus.

No wonder Wall Streeters like to go “Down To The Nightclub!” The Fed still has not taken the monetary stimulypto away, but have taken it away for consumers buying housing.

The Biden Bowl! US Personal Savings Declines -65% YoY In April As Inflation Rages (Credit Card Debt Soars As Personal Savings Collapses)

Americans’ Savings Rate Drops to Lowest Since 2008 as Inflation Bites.

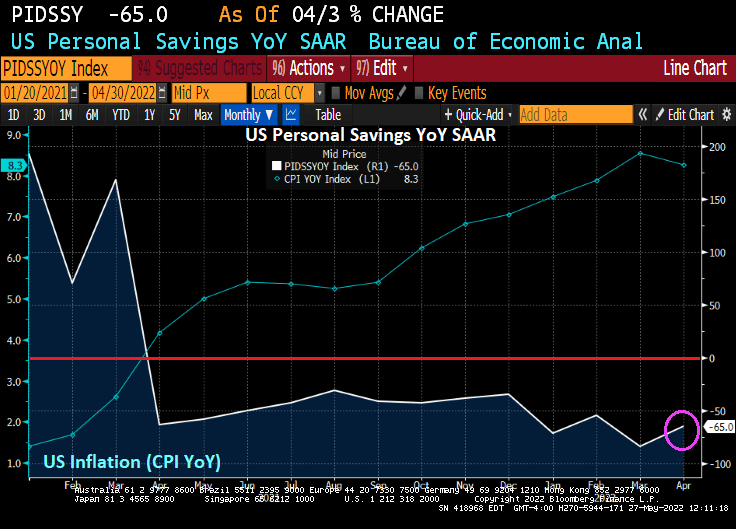
Yes, inflation really bites. In fact, as US inflation is near the 40-year high, US personal savings declined -65% YoY as consumers try to cope with rising prices.

Its not only that personal savings is crashing in the face of inflation, revolving debt has soared as consumers try to cope with rising prices. I call this chart “The Biden Bowl.” Soaring consumer credit card debt with crashing personal savings.

Consumer Sentiment For Home Buying Falls To Lowest Point In History, Even Lower Than Housing Bubble Burst And Financial Crisis Of 2008 (Housing Too Expensive, Mortgage Rates Soaring, Inflation Roaring)

The numbers keep getting worse.

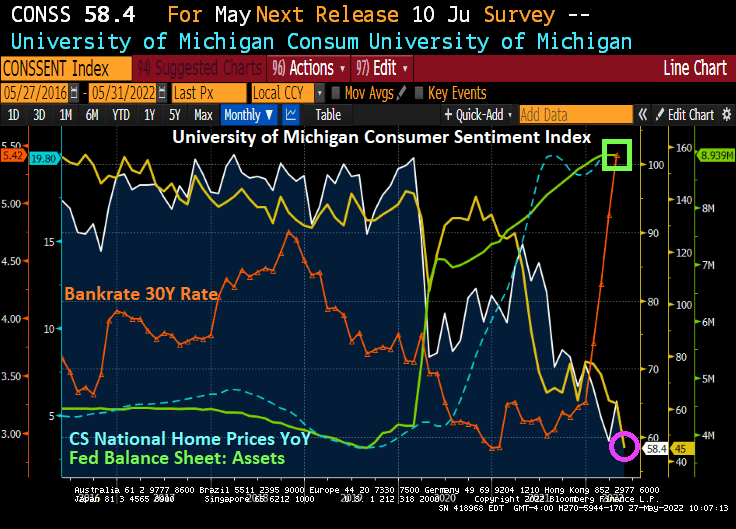
The University of Michigan Consumer Survey showed a decline in May to 58.4 (100 is baseline). Soaring inflation is a likely culprit.

But the truly horrible survey result is the UMich Buying Conditions for Houses, plunging to 45. The reason? Crazy, expensive house prices courtesy of The Federal Reserve and rising mortgages (also, courtesy of The Federal Reserve).

The buying conditions for houses is now the lowest in the history of the University of Michigan consumer survey. In fact, consumer sentiment for housing is far lower than during the awful housing bubble burst of 2008 and the subsequent financial crisis.

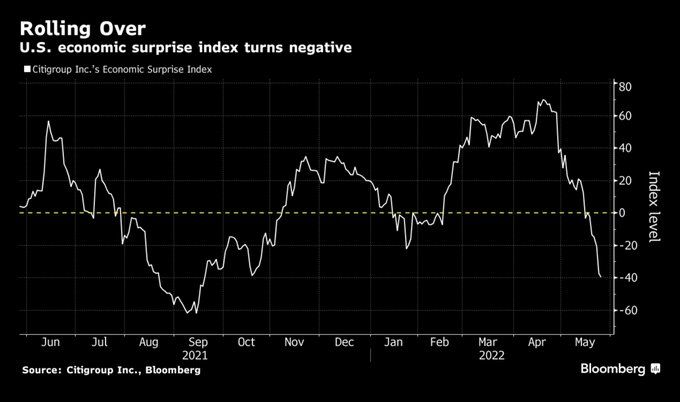
And the US economic surprise index has turned negative.

Here is Fed Chair Jerome Powell wielding his monetary bat called “Lucille.”

US Q1 Real GDP Worse Than Expected -1.5% QoQ, Price Inflation Worse Than Expected 8.1% QoQ (At Least Personal Consumption Was Up 3.1%)

Today’s US Real GDP was worse than economists expected.

US Real GDP Annualized QoQ printed at -1.5%. And GDP prices QoQ printed at 8.1%, also higher than expected.

At least Personal Consumption printed higher than expected at 3.1%.

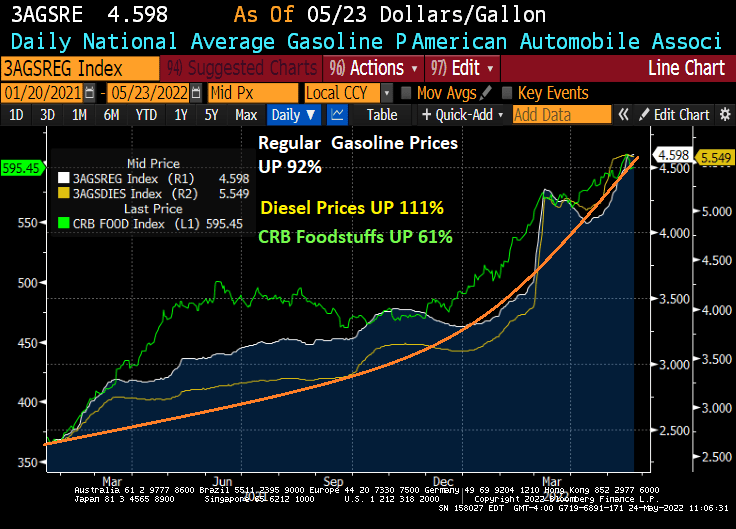
Import prices (goods) led the way at 20.9%. Part of Biden’s brilliant strategy of reducing domestic oil production and import expensive energy from overseas?

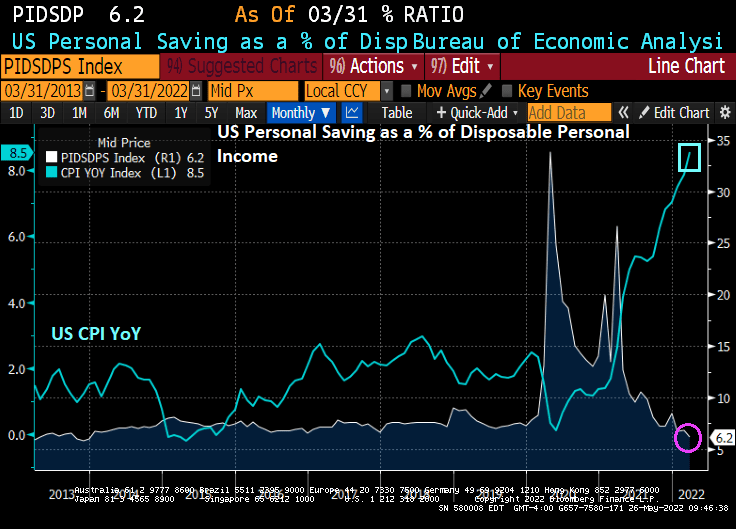
Consumers are spending more, but the personal savings rate is down to the lowest level since 2013 at 6.2% as consumers try to cope with inflation.

US Q1 GDP Forecast -1.3%, Atlanta Fed’s GDPNow Q2 Tracker Only +1.8% (M2 Money Velocity Remains Near All-time Low)

The US Q1 GDP report is due out tomorrow morning. The forecast is for -1.3% decline in GDP.

The Atlanta Fed GDPNow real-time GDP tracker is for 1.806% for Q2. If this holds, then recession fears will diminish.

Even though the US may avoid consecutive negative GDP quarters, M2 Money Velocity (GDP/M2 Money) got crushed by The Fed’s reaction to Covid back in 2020.

Talk about a bad return on “the people’s money”.

AEI’s April Home Price Index UP 17.3% YoY As The Fed And “Slowhand” Powell Keep Monetary Stimulus In Place (Bostic Talking About A Pause?)

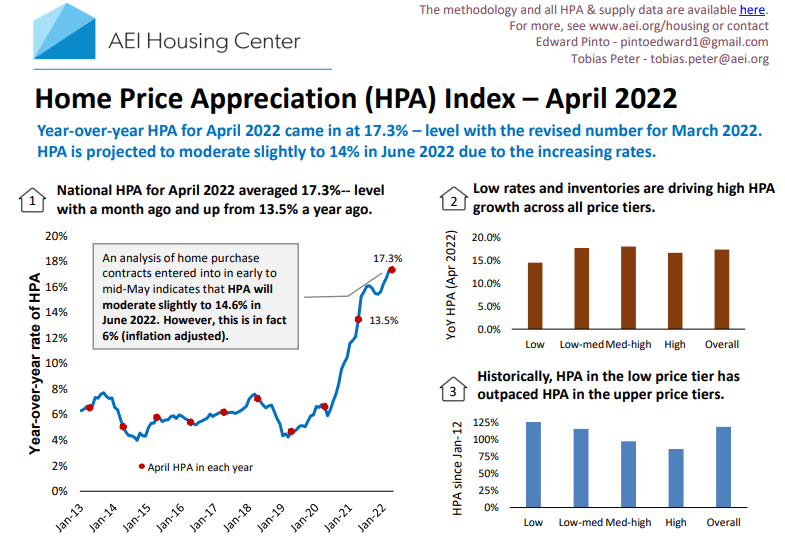
All I can say is “Wow.” Tobias Peter and Ed Pinto of the American Enterprise Institute (AEI) released their April housing report and it was a doozy. The AEI’s home price appreciation index came in at a blood curdling 17.3% YoY.

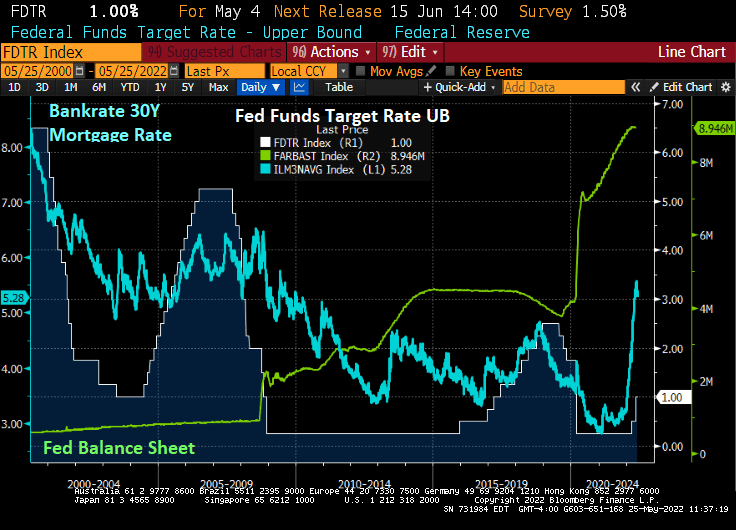
The reason why home prices are still raging at 17.3% YoY? The Fed’s monetary stimulypto is STILL in place! The Fed’s balance sheet (green line) is still staggering, and The Fed Funds target rate (white line) is a measly 1%.

Atlanta Fed President Raphael Bostic is talking about a pause in Fed tightening. Which they haven’t paused yet.

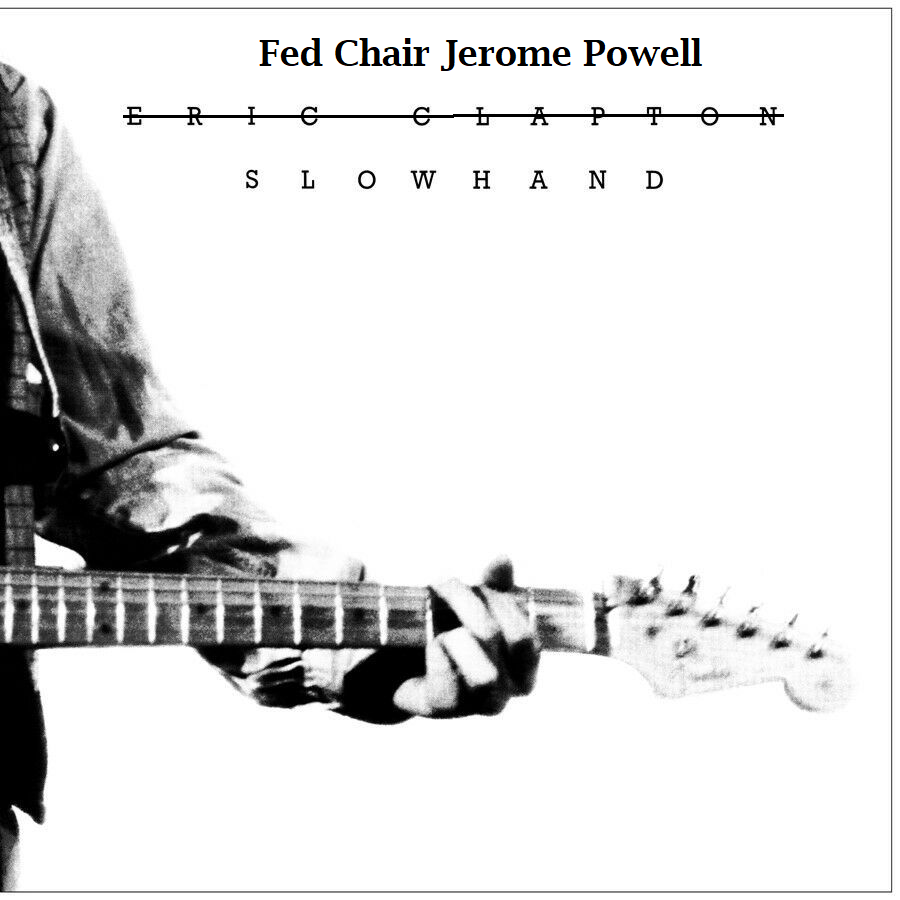
Fed Chair Jerome Powell is really “slowhand,” not Eric Clapton. Bostic is now a member of The Fed’s “Slowhand” strategy.

Mortgage Update! Mortgage Applications Fell 1.2% WoW, Refi Applications Down 75% YoY, Purchase Applications Down 16% YoY, Mortgage Rate UP 71% YoY

Mortgage applications decreased 1.2 percent from one week earlier, according to data from the Mortgage Bankers Association’s (MBA) Weekly Mortgage Applications Survey for the week ending May 20, 2022.

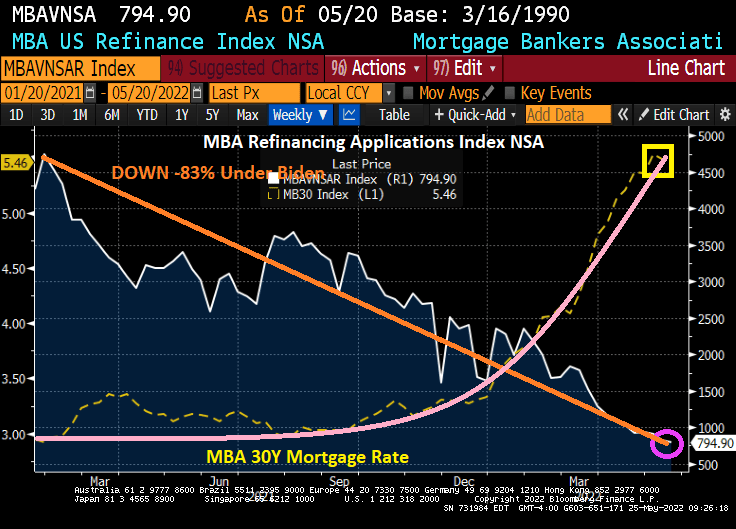
The Refinance Index decreased 4 percent from the previous week and was 75 percent lower than the same week one year ago. And under Biden, the refinance index is down -83.2%.

The good news? The seasonally adjusted Purchase Index increased 0.2 percent from one week earlier. The unadjusted Purchase Index decreased 1 percent compared with the previous week and was 16 percent lower than the same week one year ago. And the mortgage purchase applications index is down -12% under Biden.

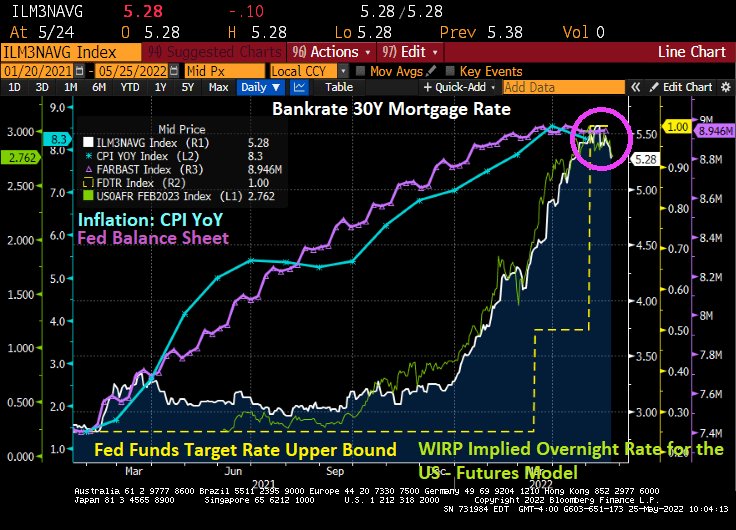
While mortgage interest rates are up 71.7% than one year ago and mortgage rates are up 87% under Biden. As The Federal Reserve signals (but not yet accomplished) monetary tightening.

Once again, The Fed is dead set on cooling inflation caused by 1) Biden’s anti-drilling policies and 2) the remnants of the Federal government spending splurge to combat Covid. The Fed has been increasing their asset purchases (purple line) as inflation increase (blue line). Now they are signaling a decline in the balance sheet (green line) in the hope that it will cool inflation. Fat chance.

Let’s see how DEAD SET The Fed is about tightening monetary policy in the face of rising energy and food prices while a war rages in Ukraine and China in a Covid lockdown.

We are all goin’ down the road feelin’ bad under Biden.