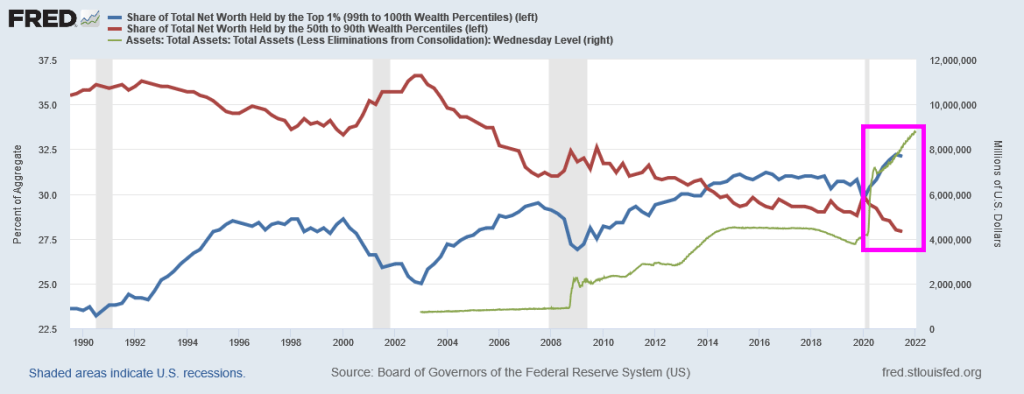
Since the 2020 Covid outbreak, the top 1% have been on the Stimulypto gravy train. The top 1% in terms of share of total net worth (blue line) is near the all-time high while the bottom 50% share of total net worth (red line) is at the all-time low.
So, you thought all that Covid relief spending along with Fed monetary stimulus would help the bottom 50%?
Start with the UMich Buying Conditions for Houses. It “rose” to 83. Unfortunately, 100 is the baseline and any number below 100 is bad. The reason? The massive increase in US home prices since 2020.
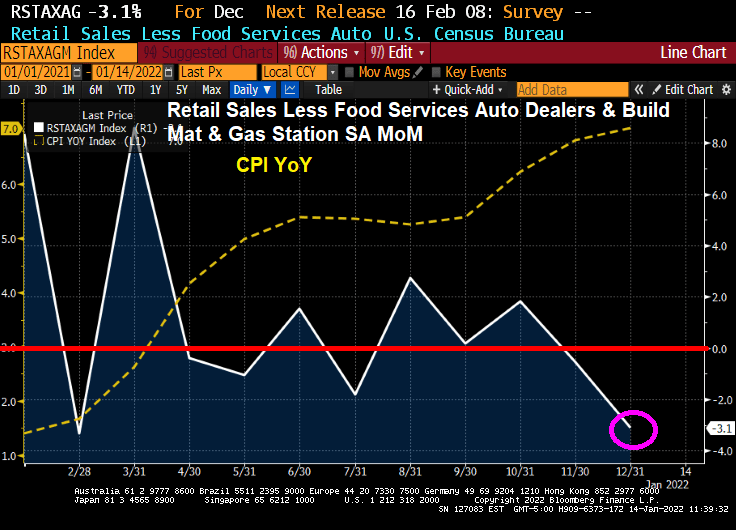
But retail sales are hurting thanks to higher prices. Retail sales less food services and auto are DOWN 3.1% MoM.
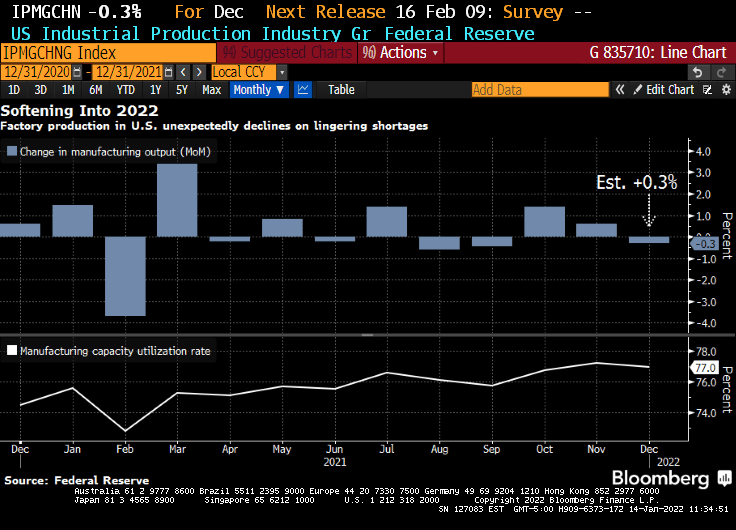
Meanwhile, US industrial production fell to -0.3%.
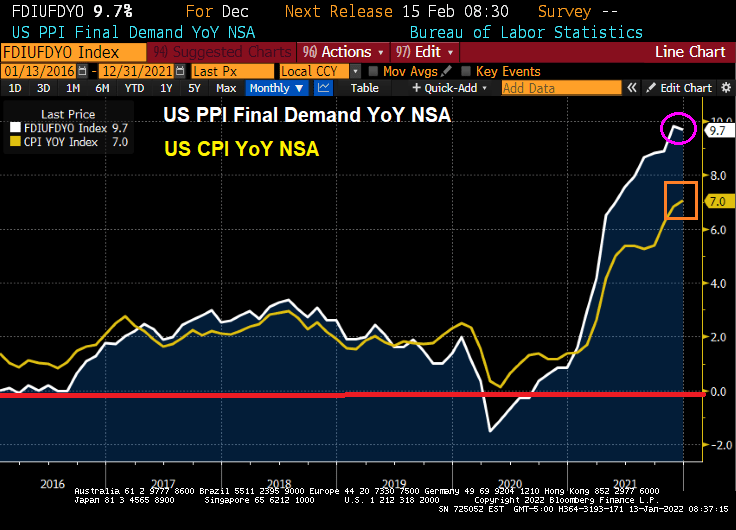
Yesterday’s inflation report was the worst in 40 years. But at least today’s Producer Price Index Final Demand is down slightly from November. But PPI Final Demand YoY is still roaring at 9.7%.
The producer price index for final demand increased 0.2% from the prior month and 9.7% from a year earlier, Labor Department data showed Thursday. The annual advance was the largest in figures back to 2010.
Excluding the volatile food and energy components, the PPI climbed 0.5% in December and was up 8.3% from a year earlier.
Too much Federal government spending, too much Fed monetary stimulus, Omicron helping created labor shortages, etc. But the real killer has been ENERGY prices. Note that natural gas, gasoline and WTI crude oil were falling in November/December helping to slow PPI growth by a smidge. BUT energy prices are skyrocketing in January. So … look for higher PPI in January.
Here is the painting by Thomas Hart Benton that drove “Brokeback Biden” to try to destroy fossil fuel production. Or at least this is Washington DC’s idea of what Oklahoma and Texas are like.
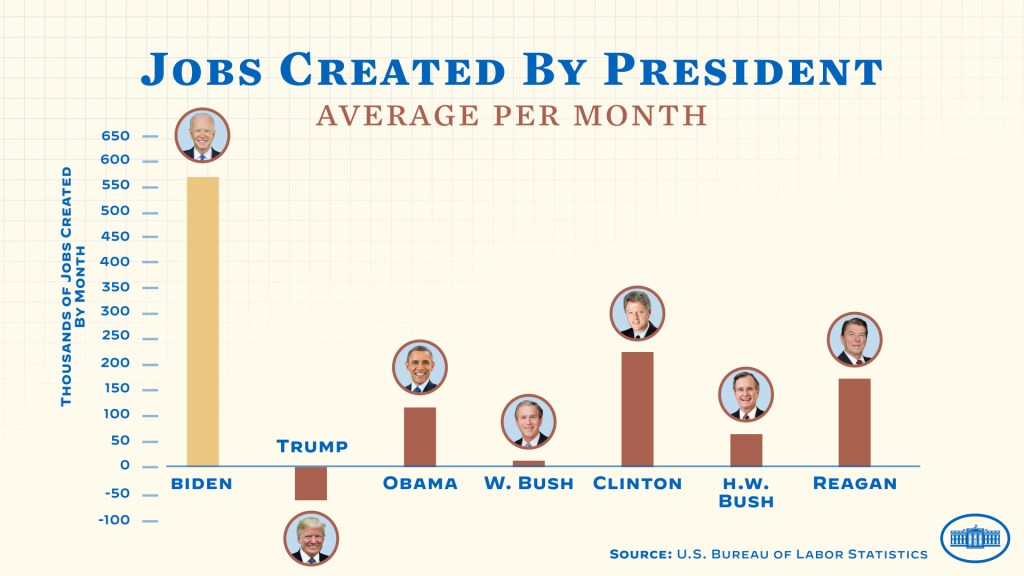
Recently, the White House claimed that the Biden Administration created more jobs (per month) than Trump, Obama, George W Bush, George HW Bush, Clinton and Reagan.
It always helps to be elected President after a recession when the economy naturally snaps back from the economic doldrums (like Obama after the financial crisis, Clinton after the first Gulf War, Reagan after Carter).
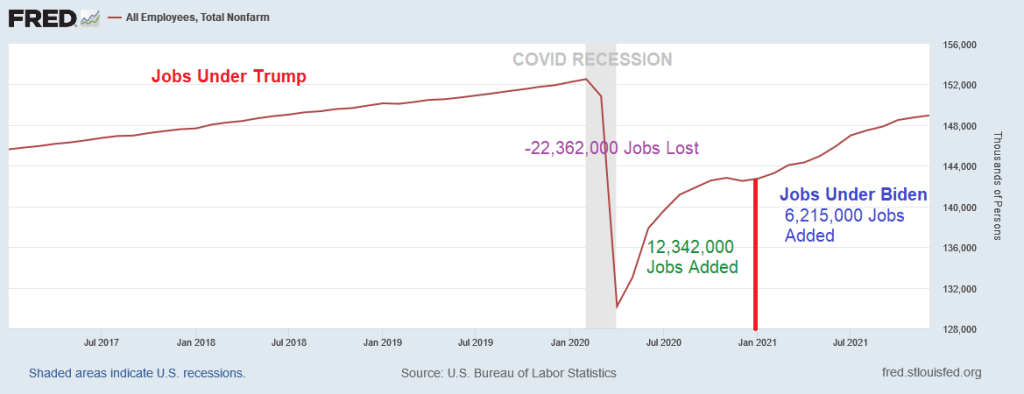
So let’s look at job totals under Trump, the COVID lockdowns, the ensuing economic damage, and the Biden “rebound.” In a brief two months in early 2020 thanks to COVID and lockdowns, the US economy lost 22.362 MILLION jobs. But the snap-back effect under Trump was 12.342 MILLION jobs added back by the time Biden was sworn-in as President.
Under his term as President, Biden has benefited from “Snap-back inertia” and saw 6.215 MILLION jobs added in just a year. Pretty impressive, except that it is about half the snap-back effect experienced under Trump.
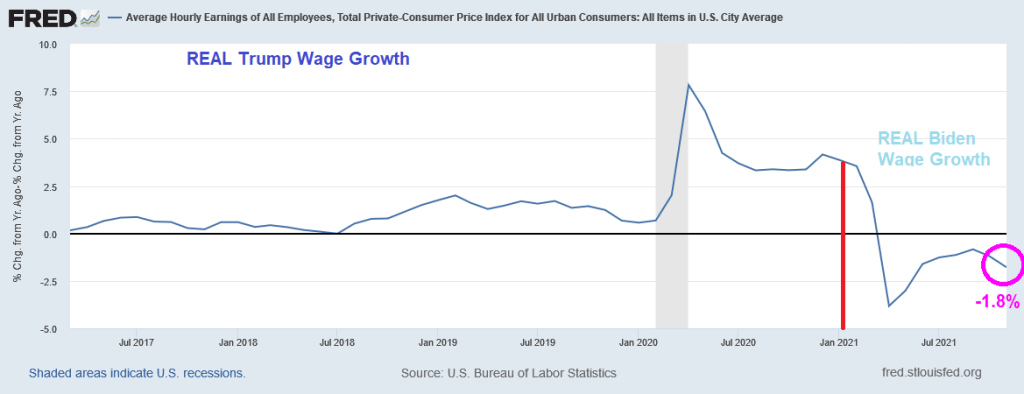
How about REAL wage growth (nominal wage growth less inflation)? Real wage growth was higher under Trump and has been declining under Biden. Strange that the White House isn’t bragging about declining real wage growth under Biden.
Let’s see how Omicron impacts the labor market and whether Biden/Psaki will take credit for the snap-back from Omicron.
Call this the Biden malaise (or Ka-malaise) for wage growth. Where inflation nukes positive wage gains.
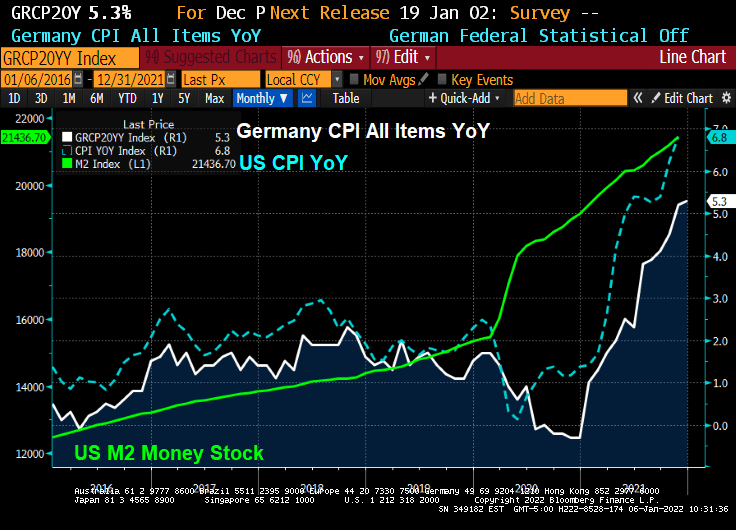
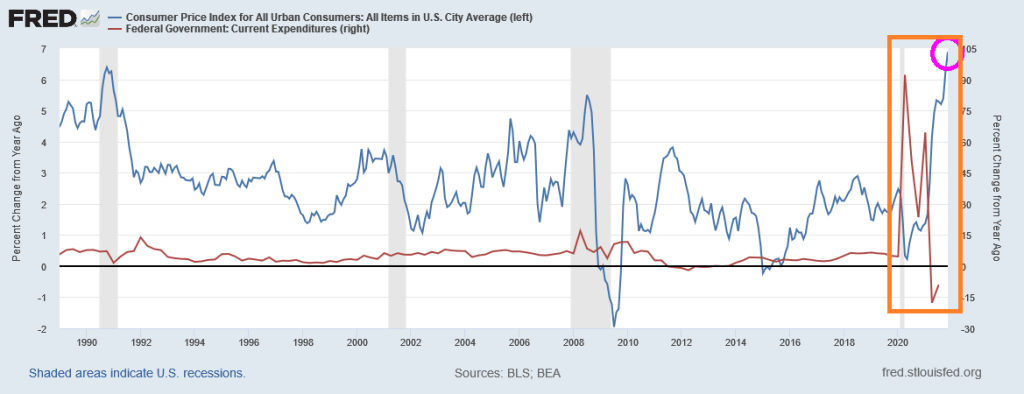
The world has become a wild and wacky place since COVID was unleashed on an unsuspecting population. Since the massive spending spree by The Federal government in the USA coupled with extraordinary monetary stimulus from The Federal Reserve, US inflation has shot up to 6.8% YoY.
German is also having an inflation moment. With their CPI YoY running at 5.3%, faster than the anticipated 5.1%.
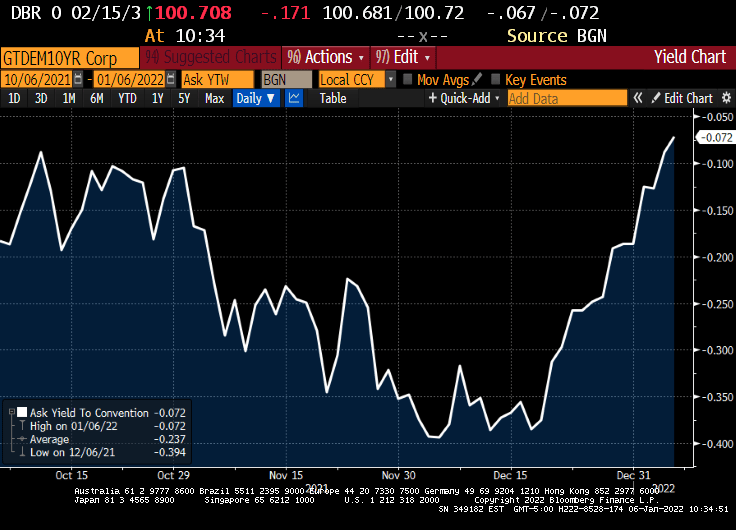
At least the German 10-year sovereign yield is ALMOST back to 0%.
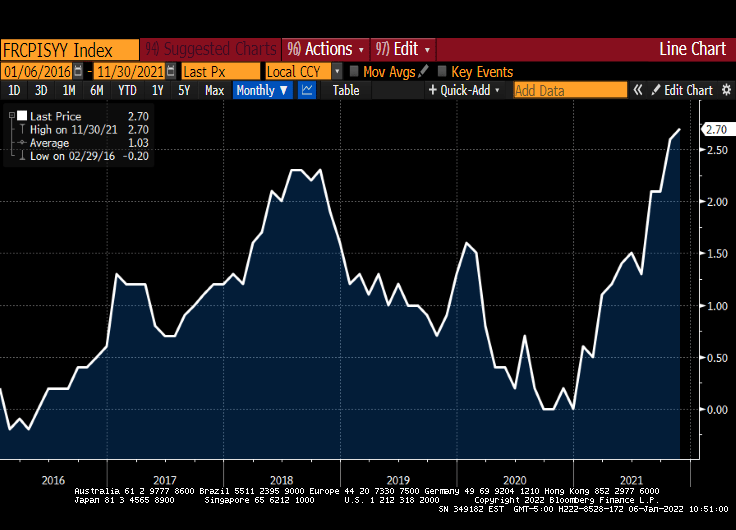
France, on the other hand, is seeing inflation rising to 2.70% YoY.
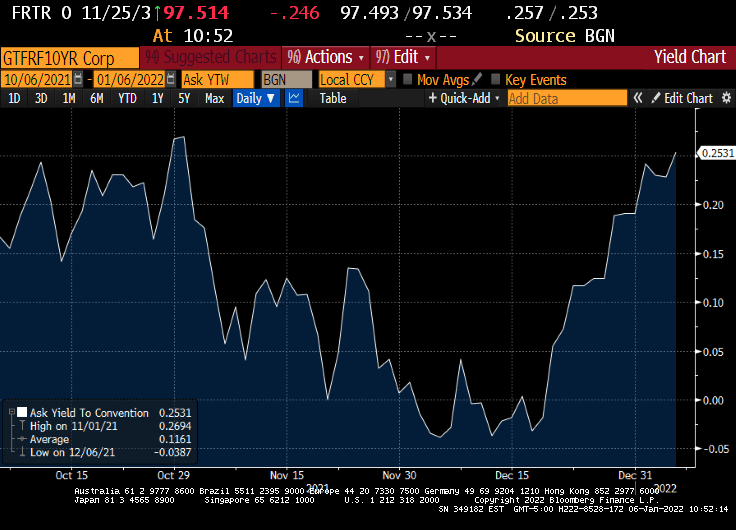
While the French 10Y sovereign yield rose to 0.2531%.
France’s Macron certainly likes to have his photo taken as if he wants to go 10 rounds with UK’s Tyson Fury.
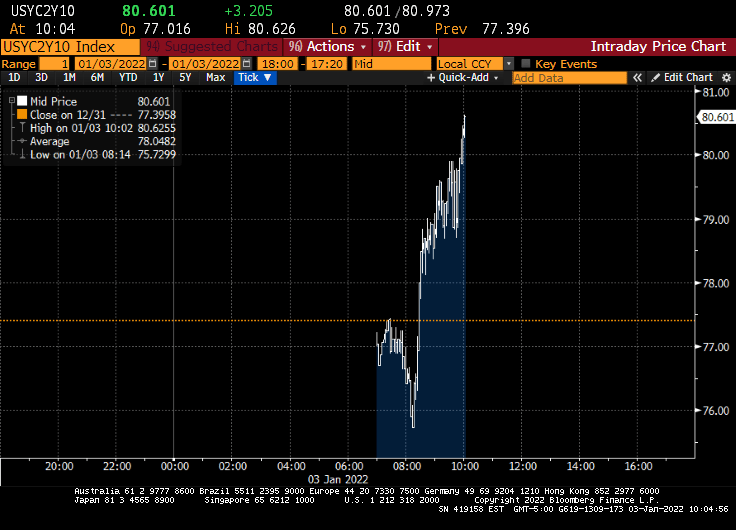
Happy New Year! And Treasuries are off to fast start with investors bailing on Treasuries and buying stocks. AND the expectation that The Fed will raise rates 3 times this year.
The 10-year Treasury Note yield rose above 1.60% this morning.
And the US Treasury 10Y-2Y curve rose to 80.601 basis points.
Fed Funds Futures data is showing 3 rates hikes in 2022. May, September and December.
The Fed Dots project is definitely showing an upward trend in the Fed Funds Target rate with FOMC member forecasting the median target rate to be above 2% by 2024.
Of course, Fed reverse repo activity grew to an all-time high (but it is expected to pare-back).
How about mortgage rates? I expect mortgages rates to rise over 2022 as the 10-year Treasury Note rises.
Cautionary note: The Fed is likely to protect economic growth and ignore inflation. So I expect FOMC will continue to reinvest prepayments into Treasury and MBS, pro-rata to the current portfolio.
A good quote from The Hill story: “Under Biden, the American economy has recovered from its Trump-era lows with remarkable speed.” As Leslie Knope said “That seems like an unfair phrasing.”
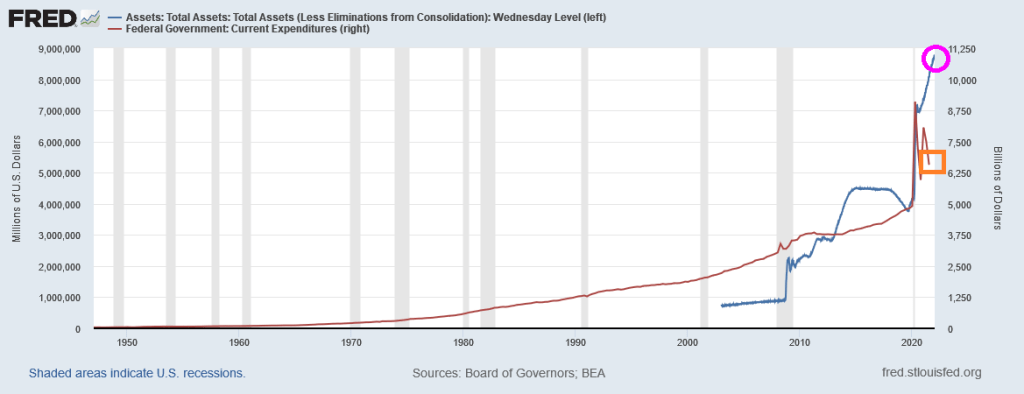
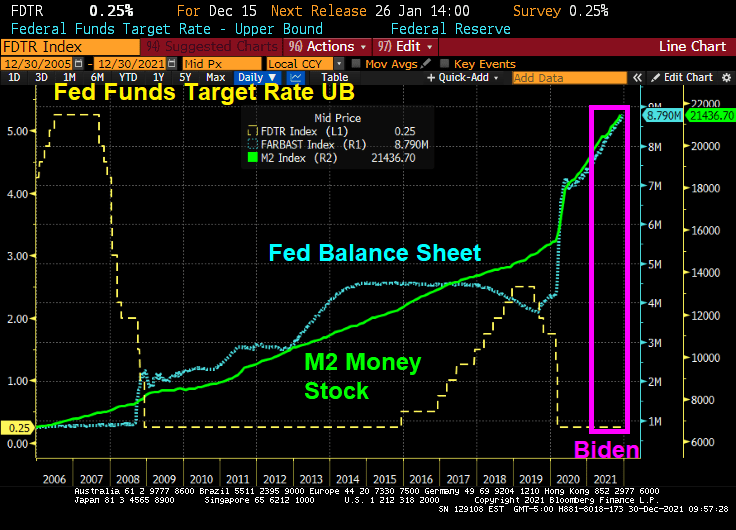
Hmm. Well, here is a chart that best explains the “Biden Miracle.” It shows the growth in Federal expenditures from the previous year during the banking crisis and then the COVID crisis. During the banking crisis, the increase in Federal expenditures (red) was normal. It was the increase in The Fed’s balance sheet (blue) that was staggering. But for the mini-recession related to COVID (only two months so you can barely see it on the chart below), it was the growth in Federal expenditures (red) combined with another round of staggering Federal Reserve stimulus (blue).
A different view of Federal “Stimulypto” is show below. Since COVID and the election of Joe Biden as President, Fed monetary stimulus is at an all-time high and Federal expenditures, while they have slowed, are still above the pre-COVID spending levels.
Please note that the massive surge in Federal expenditures and Fed monetary stimulus began under Trump, but were only continued under Biden. That is why no one notices … it was Trump.
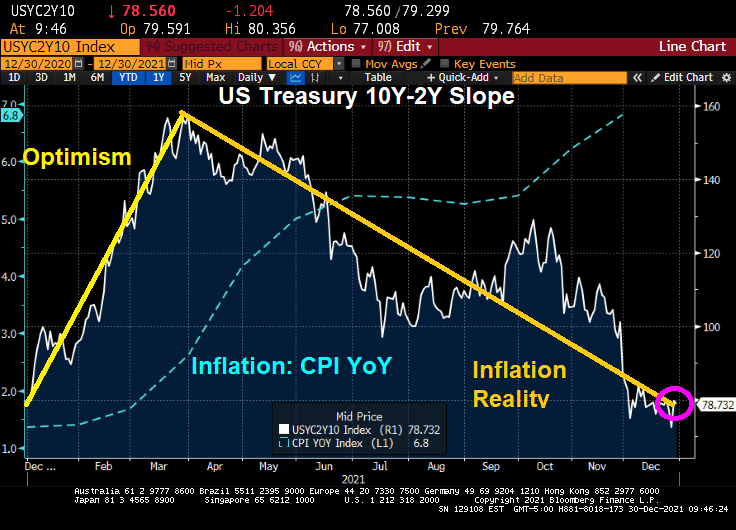
And if we look at the 10Y-2Y Treasury curve slope, the US is slippin’ into darkness since the slope typically rises after a recession, then falls. And we are in the falling (or slippin’) stage.
So, President Biden is benefiting from Trump’s and The Fed’s Stimulypto. I don’t expect partisan outlets like The Hill or crooner Barbra Streisand to look at the data.
With Build Back (Inflation) Better not passing in the US Senate, I fully expect The Federal Reserve to continue “low riding” interest rates. Inflation will probably cool as well as Federal expenditure growth slows.
So, Streisand’s statement should have said “Joe Biden’s economic record in his first year is the best in 40 years. The media largely ignores this … because the unsustainable Federal stimulus began under Trump, not Biden.”
Another thing The Hill and Barbra Streisand left out was declining REAL average hourly earnings growth (that is, average hourly earnings YoY – inflation).
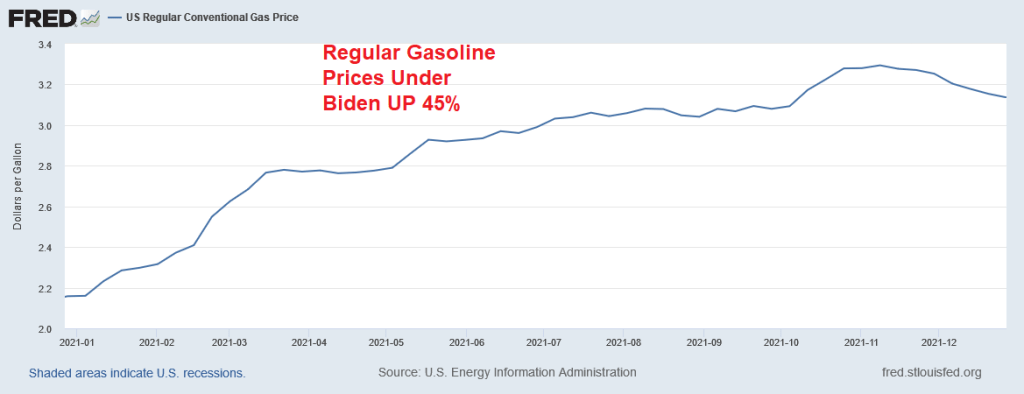
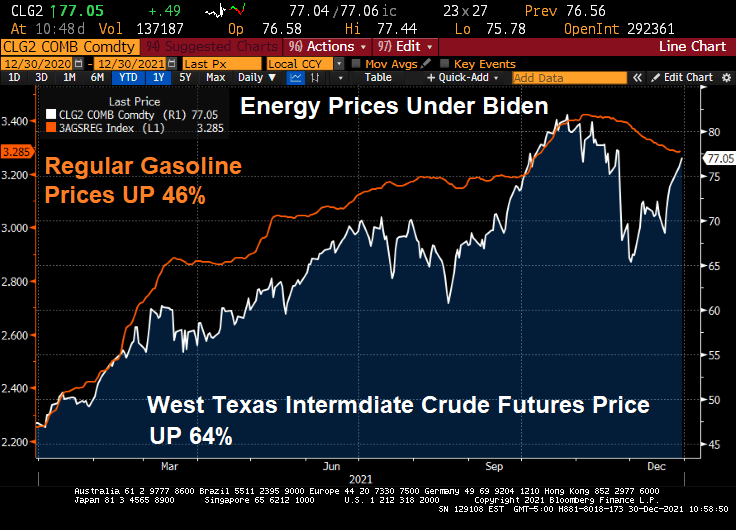
Biden’s real contribution? Anti-fossil fuels actions have driven up energy prices. Regular gasoline prices, for example, are up 45% under Biden.
If The Fed actually follows through and removes COVID stimulus and Congress doesn’t keep the incredible rate Federal spending growing, I sincerely doubt that GDP will continue at this hot pace.
Inflation is the highest in 40 years. There used to be a lot of discussion about hedging against inflation in the 1970s and 1980s, but discussion subsided as inflation cooled in the US. But now it is roaring back as Fed monetary stimulus continues unabated and The Federal government continues to spends like crazy.
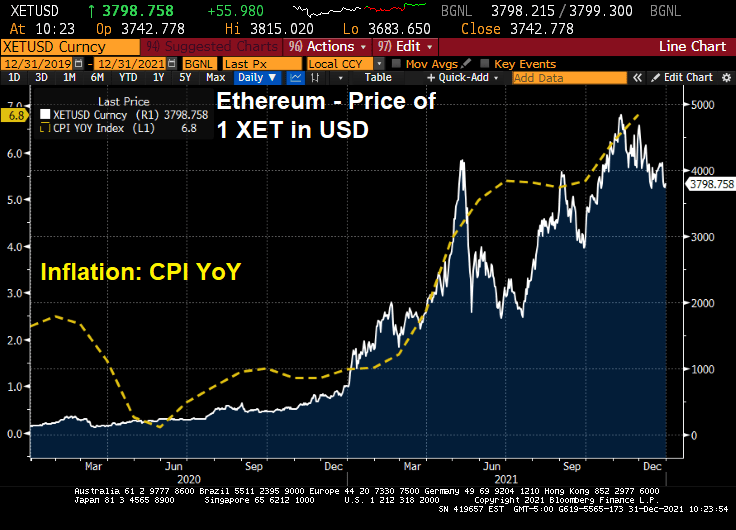
So, how do we protect ourselves against inflation caused by Federal government policies (or follicies)? How about cryptocurrencies like Ethereum?
Ethereum really started to take off as US inflation took off. Not a perfect fit (or hedge), but on average Ethereum has kept up with inflation.
If you believe in technical analysis, Ethereum is in the 3rd wave on the downside.
But if you believe the Ichimoku Cloud, Ethereum lies BELOW the cloud indicating that Ethereum is likely to rise.
Bear in mind that Biden’s energy policies have created large increases in energy prices which lead to large increases in other products such as food prices. Again, not all inflation is due to Federal policies. Arabica coffee prices are driven by droughts and excessive rainfall, etc. But inflation causes a rise in agriculture prices due to transportation cost increases, increases in fertilizer prices (thank to natural gas price increases), and panic buying by consumers.
Despite what Federal officials jawbone about, inflation has momentum and is unlikely to swiftly subside, particularly if the Build Back (Inflation) Better Act passes in 2022.
Remember, consumer purchasing power of the US Dollar has declined dramatically since the creation of The Federal Reserve System in 1913. The Fed isn’t going away and neither is wasteful Federal spending, like BBB.
It has been almost a year since Joe Biden has been President of the United States and a Democrat majority took control of The House and Senate. And what has happened to the US Treasury yield curve slope over the past year?
The yield curve is back where it started. There was the “honeymoon effect” where the curve slope rose. After all, Biden was Obama’s Vice President for 8 years and The Democrats has promised so much in the 2020 election. But by early April, the reality of the massive Federal spending (combined with Fed Stimulypto) began showing what was feared: inflation (blue line) started to grow at a rapid rate of speed. With inflation now at 6.8% YoY,
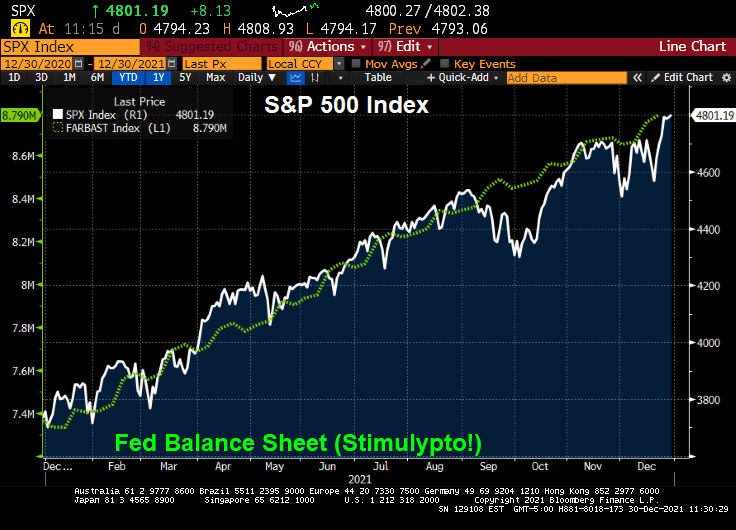
In fairness to Biden, The Federal Reserve has been overstimulating the economy since The Federal Reserve since Ben Bernanke and the Fed Open Market Committee (FOMC) dropped the hammer on The Fed Funds Target Rate once the rate hit 5.25% in September 2007. They kept cutting it reached 25 basis points (or 0.25%) in December 2008. In August 2008, Bernanke and Company began their “Quantitative Easing” or asset purchasing programs. Between The Fed’s Target Rate and QE, The Fed has continued to overstimulate markets ever since. Under Biden, The Fed Funds Target Rate remains at 0.25% and The Fed’s Balance sheet has grown to $8.79 Trillion (bigger than the entire economies of Japan and Germany put together!).
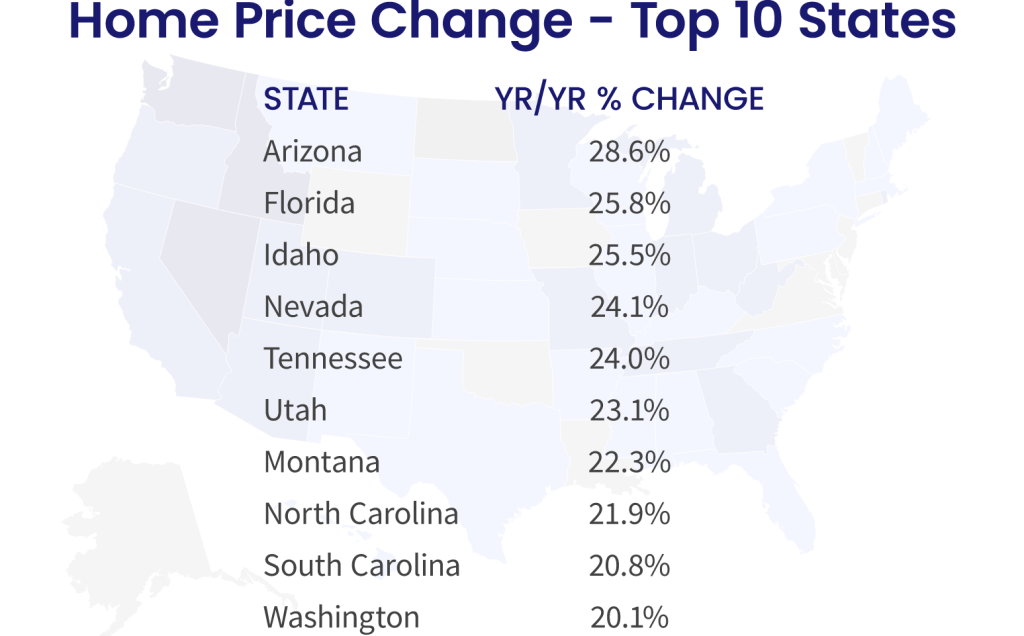
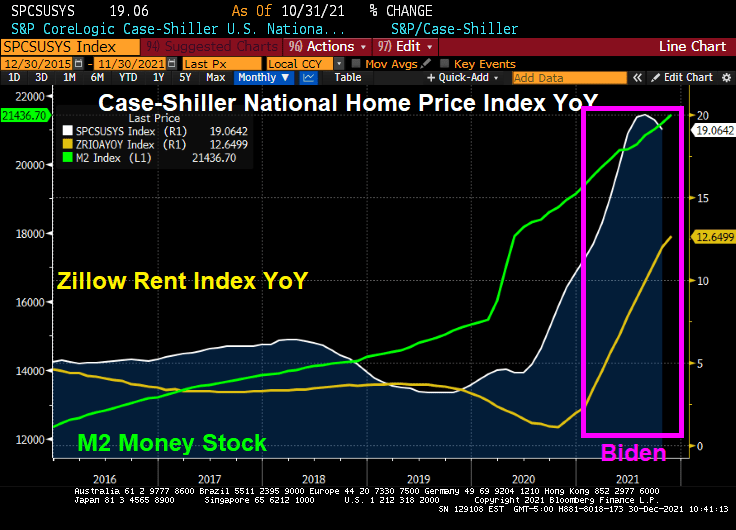
How about housing? Home prices are growing at 19% YoY while rents are growing at 12.65% YoY.
Energy prices have risen dramatically under Biden. Gasoline is up 46% despite a slight reprieve recently. WTI crude prices are up 64%.
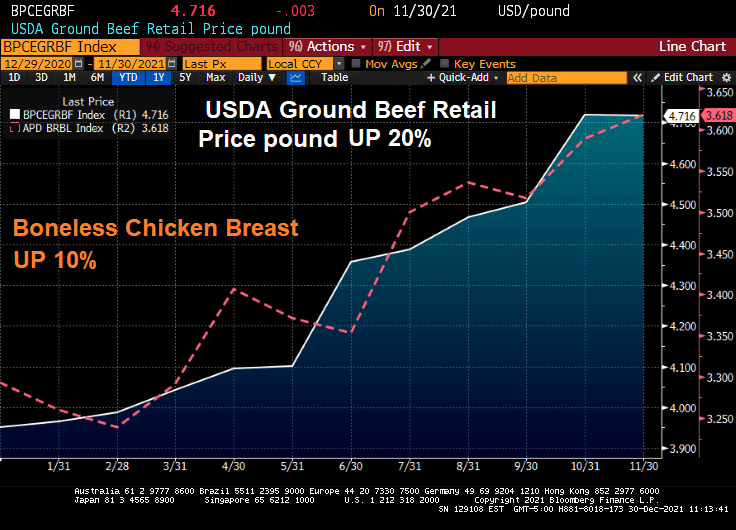
How about food? Beef prices are up 20% and chicken prices are up 10%.
On a positive note, the S&P 500 index has soared … thanks has soared during Biden’s term thanks to Fed stimulus and Federal spending on COVID.
The Build Back Better Act if passed (in its entirety or on a piecemeal basis) will lead to even MORE inflation.
Perhaps Biden’s spokesperson Jen Psaki can recreate the Biden Administration as a lovable, hilarious family like the comic strip Gasoline Alley with old Joe Biden as Skeezix. And insider-trading star, House Speaker Nancy Pelosi as the family matriarch.


You must be logged in to post a comment.