The Talking Heads at The Federal Reserve keep yammering about persistant inflation (which Yellen kept saying was transitory) and whether or not Fed rate hikes will be necessary to get infation to 2%.
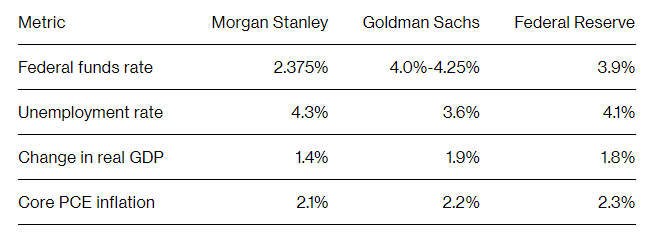
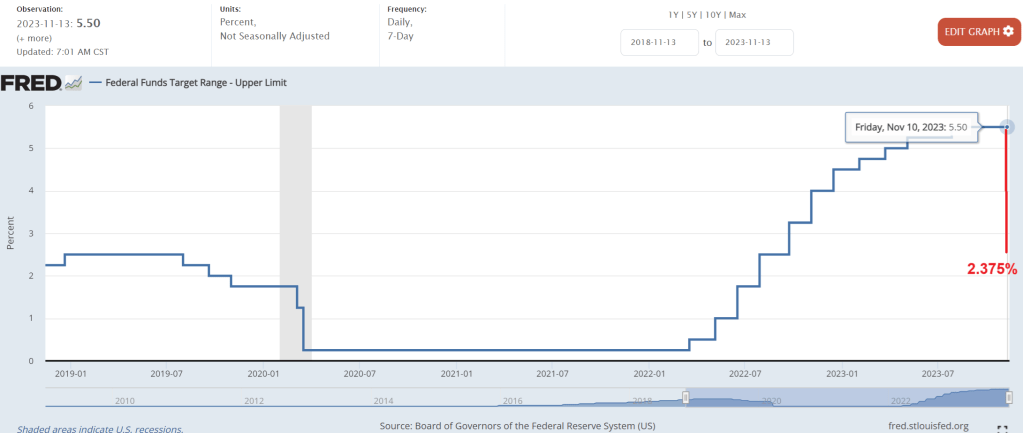
Instead of muddling lectures (like by Atlanta Fed President Rafael Bostic) on Fed tightening to fight inflation, let’s address the elephant in the room (no, not Chris Christie or Hillary Clinton), but Morgan Stanley’s soft landing forecast of a Fed Funds rate cut from 5.50% today to 2.375% in 2024. This is a whopping 215 basis point cut!
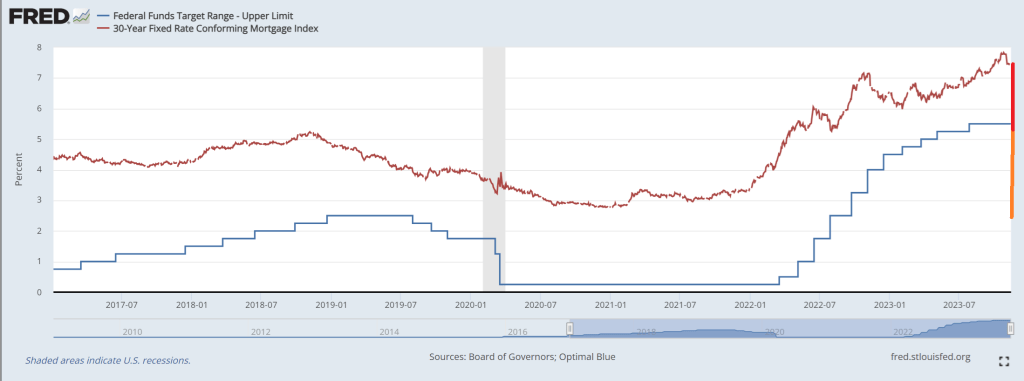
Currently, the spread between the 30-year conforming mortgage rate and The Fed Funds Target rate is 1.981% of 198.1 basis points. While the better spread is the mortgage rate compared to the 10-year Treasury yield, I am going to use Morgan Stanley’s Fed Funds target rate forecast for 2024. Assuming the spread is constant, this results in a mortgage rate in 2024 of … drumroll … 5.50%.
In one sense, a 200 basis point decline in the 30-year mortgage rate would be welcome news to home buyers. On the other hand, Morgan Stanley is forecasting a soft landing and a rise in the unemployment rate to 4.3%, hardly good economic news.
So, fear the talking Fed. They are talking about fighting stubborn inflation while ignoring the slowdown forecast for 2024.
Even eating breakfast under Bidenomics is more expensive. Particularly if you like orange juice like I do. To save money, I am probably going to have to switch to nasty-tasting Tang.
Food CPI is up 3.69% year-over-year. The rate of growth in food prices is slowing. But do I trust BLS data on CPI? Of course not.
Orange juice prices are up 47% under Biden.
And we see that REAL GDP is growing at a slower rate than nominal GDP.
Speaking of Bidenomics, here is an interesting Zero Hedge story on “The Biden-Du Pont Nexus: From A Prestigious Golf Club To A Controversial Child Rape Plea Deal.” What is it with Delaware elites having sex with their children?? And why is NY AG Letitia James prosecuting Donald Trump when there has been no crime while she let’s Epstein’s clients who flew to have sex with minors (used to be illegal) off the hook?
But I feel good! After my breakfast of … Scotch Broth. OJ is just too expensive.
On a amusing or sad note, Biden campaign communications director Michael Tyler’s message to Americans who are worse off economically under Biden: “That’s precisely why we need another four years to finish the job.” OMG! What does “finish the job” mean?? I am afraid to ask.
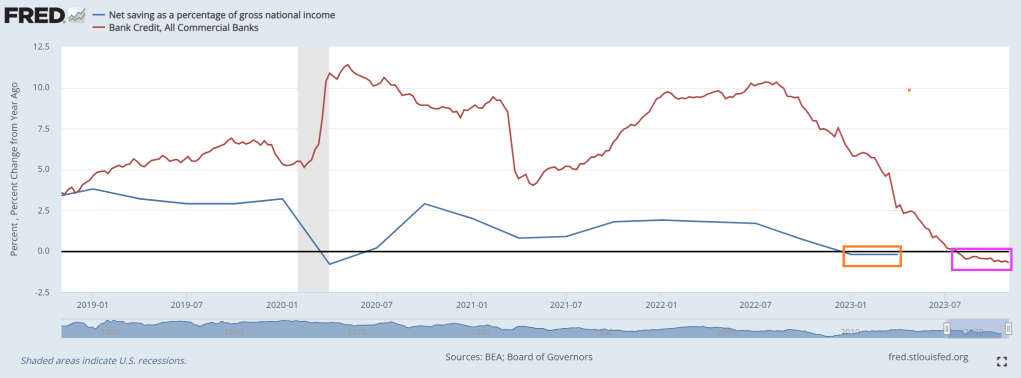
Where we currently sit is … bank credit growth is in the red (15th straight week of negative growth) and net savings as a percentage of gross national income has seen negative growth YoY for 2 consequtive quarters.
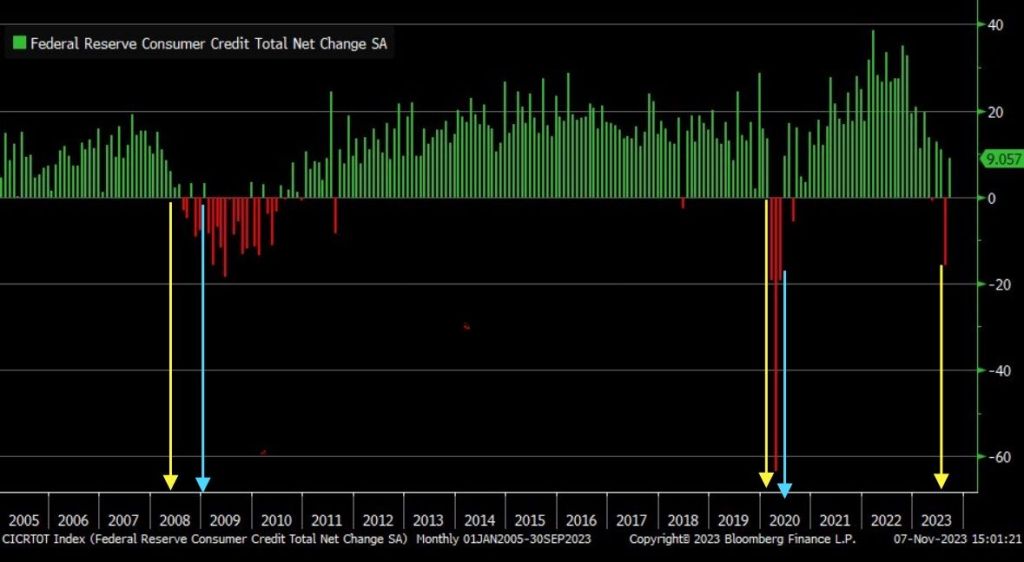
September marked the largest consumer credit drop since May 2020, signaling a significant recession warning.
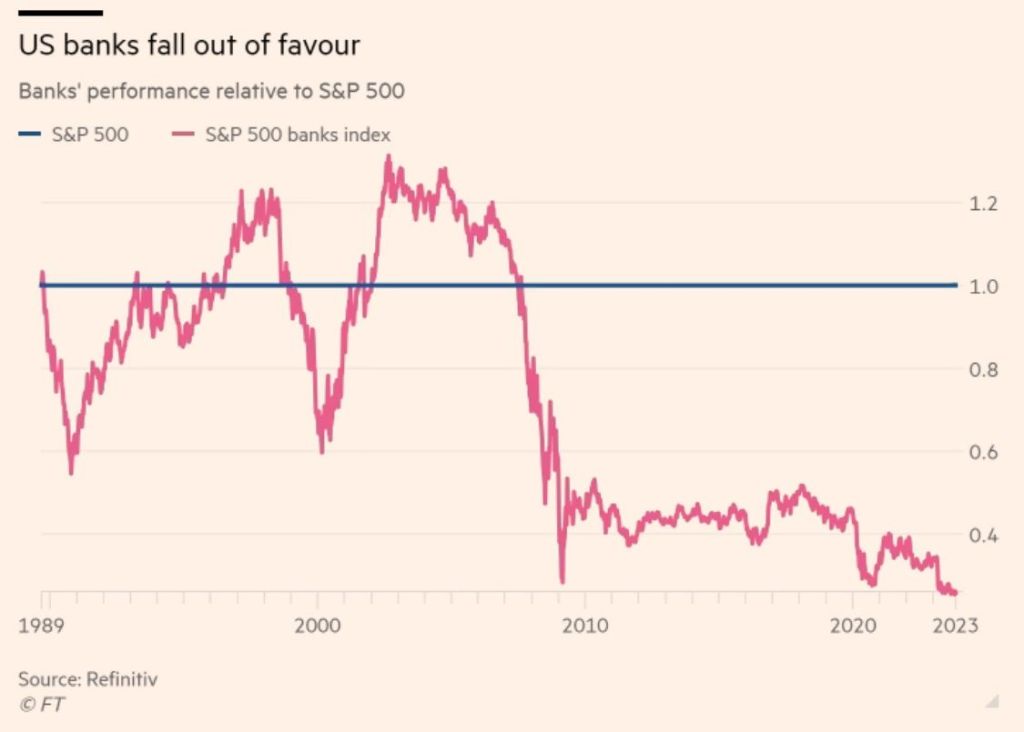
And with Bidenflation (or Yellenflation) and The Fed’s counterattack, we are seeing bank stocks losing relative to the tech sector.
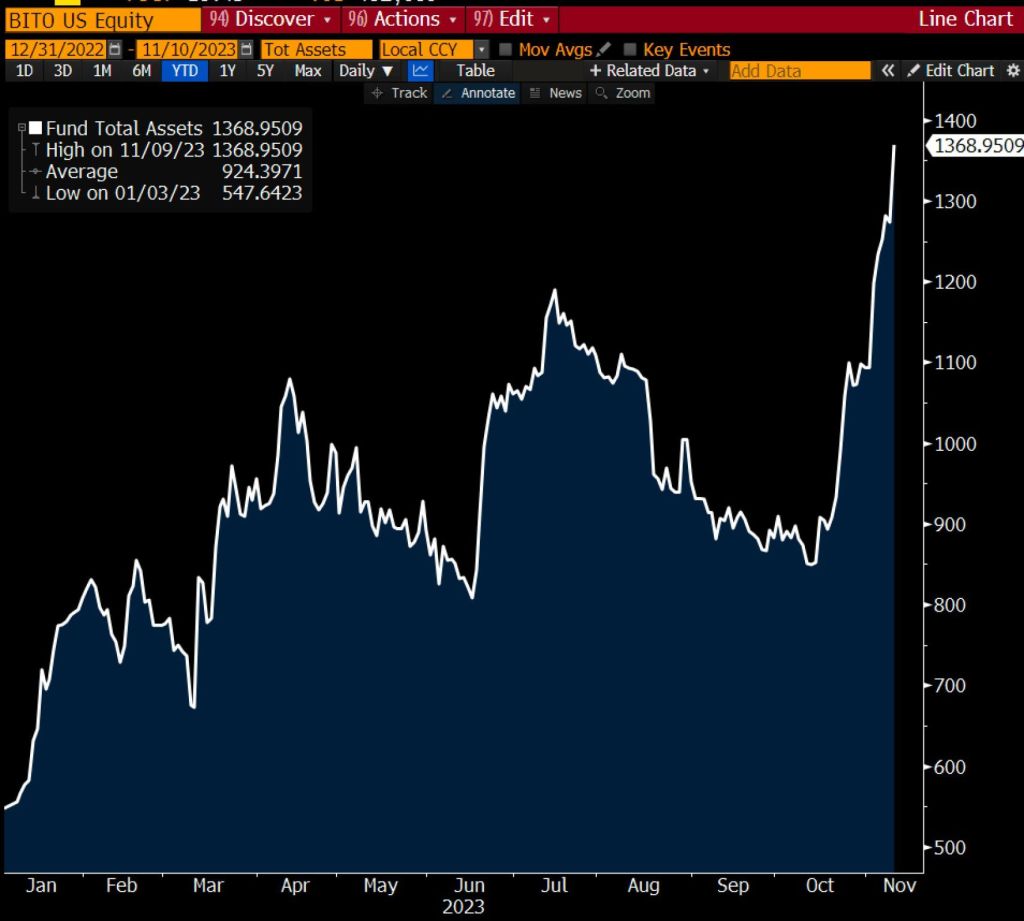
Proshares Bitcoin (BITO)’s assets have nearly doubled in the past 30 days.
Yes, the Three Stooges (Biden, Yellen, Powell) have put the US on a highway to hell!
The primary reason for Moody’s downgrade of US credit? The absolutely insane ramp-up of Federal spending starting with the Covid outbreak in early 2020. And the subsequent economic shutdowns and the closure of public schools. But even as Covid faded to diminished status, Bidem demanded an increase in Federal spending. Well, Biden’s war (Ukraine) which looks like spending in perpetutity.
Of course, Biden/Congress love to spend money, but raising personal taxes to pay for it is political suicide. A private sector firm would cut spending to balance its budget, government simply doubles down on spending. Never let a crisis go to waste!
And The Federal deficit keeps on growing under Biden/Yellen’s economic reign of error.
After a disastrous 30Y bond auction this week, a collapse in Treasury market liquidity, and an accelerating rise in the market’s perception of the United States’ credit risk, Moody’s has just cut its outlook on US credit ratings to negative from stable.
Source: Bloomberg
The key driver of the outlook change to negative is Moody’s assessment that the downside risks to the US’ fiscal strength have increased and may no longer be fully offset by the sovereign’s unique credit strengths.
In the context of higher interest rates, without effective fiscal policy measures to reduce government spending or increase revenues, Moody’s expects that the US’ fiscal deficits will remain very large, significantly weakening debt affordability.
Continued political polarization within US Congress raises the risk that successive governments will not be able to reach consensus on a fiscal plan to slow the decline in debt affordability.
Moody’s does affirm the Aaa rating:
The affirmation of the Aaa ratings reflects Moody’s view that the US’ formidable credit strengths continue to preserve the sovereign’s credit profile.
First, Moody’s expects the US to retain its exceptional economic strength. Further positive growth surprises over the medium term could at least slow the deterioration in debt affordability.
Second, the US’ institutional and governance strength is also very high, supported in particular by monetary and macroeconomic policy effectiveness. While the adjustment of the US economy and financial sector to higher-for-longer interest rates is underway, policymakers have facilitated the transition through transparent and effective policy.
Finally, the unique and central roles of the US dollar and Treasury bond market in the global financial system provide extraordinary funding capacity and significantly reduce the risk of a sudden spiraling of funding costs, which is particularly relevant in the context of high debt levels and weakening debt affordability.
The US’ long-term local- and foreign-currency country ceilings remain unchanged at Aaa. The Aaa local-currency ceiling reflects a small government footprint in the economy, relatively predictable and reliable institutions, very low external imbalances and moderate political risks, all of which reduce the risks posed to non-government issuers by government actions or shocks that would commonly affect the government and the private sector. The foreign-currency ceiling at Aaa reflects the country’s strong policy effectiveness and open capital account which reduce transfer and convertibility risks to minimal levels.
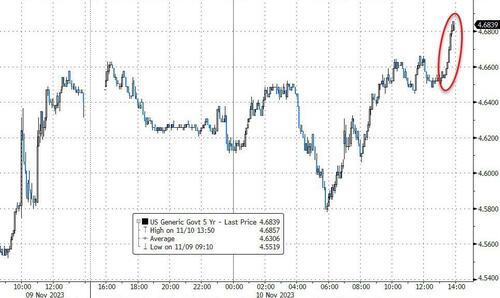
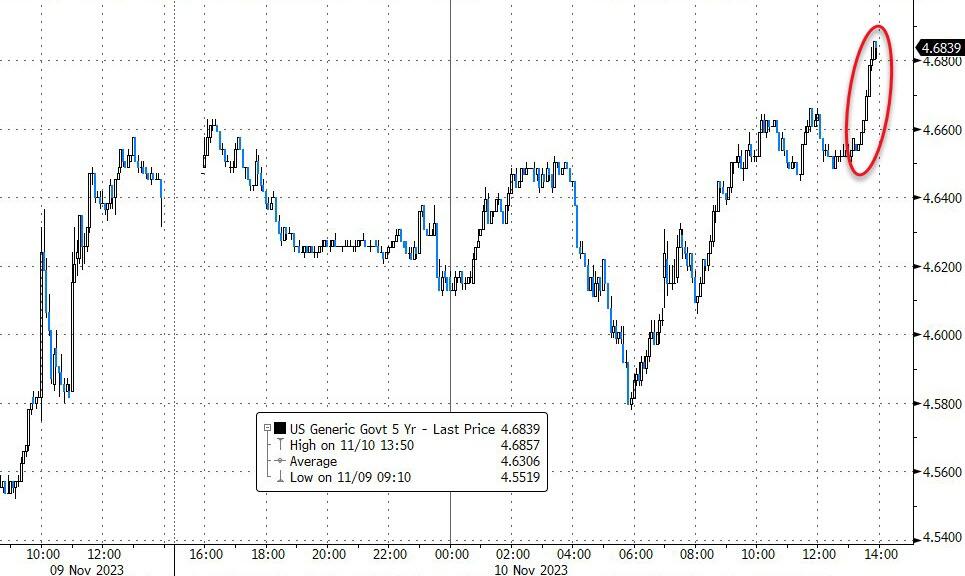
The market – late on a Friday – pushed yields on the 2Y and 5Y Treasyr notes to fresh new highs for the day…
Full Rationale:
ABSENT POLICY ACTION, FISCAL STRENGTH WILL DECLINE
The sharp rise in US Treasury bond yields this year has increased pre-existing pressure on US debt affordability. In the absence of policy action, Moody’s expects the US’ debt affordability to decline further, steadily and significantly, to very weak levels compared to other highly-rated sovereigns, which may offset the sovereign’s credit strengths.
Past increases in interest rates by the Federal Reserve will continue to drive the US government’s interest bill higher over the next few years. Meanwhile, although the government’s revenue base will rise in line with the economy as a whole, in the absence of specific policy action, this will occur at a much slower pace than the rise in interest payments. Moody’s expects federal interest payments relative to revenue and GDP to rise to around 26% and 4.5% by 2033, respectively, from 9.7% and 1.9% in 2022. These projections factor in Moody’s expectation of higher-for-longer interest rates, with the average annual 10-year Treasury yield peaking at around 4.5% in 2024 and ultimately settling at around 4% over the medium term. The debt affordability forecasts also take into account Moody’s expectations that, absent significant policy changes, the federal government will continue to run wide fiscal deficits of around 6% of GDP near term and to around 8% by 2033, the widening being driven by higher interest payments and aging-related entitlement spending.
By comparison, deficits averaged around 3.5% of GDP from 2015-2019. Such deficits will raise the US federal government’s debt burden to around 120% of GDP by 2033 from 96% in 2022. In turn, a higher debt burden will inflate the interest bill.
For a reserve currency country like the US, debt affordability – more than the debt burden – determines fiscal strength. As a result, in the absence of measures that limit the size of fiscal deficits, fiscal strength will increasingly weigh on the US’ credit profile.
FISCAL RISKS ARE EXACERBATED BY ENTRENCHED POLITICAL POLARIZATION UNDERSCORING RISING POLITICAL RISK
At a time of weakening fiscal strength, there is an increased risk that political divisions could further constrain the effectiveness of policymaking by preventing policy action that would slow the deterioration in debt affordability. These risks underscore rising political risk to the US’ fiscal position and overall sovereign credit profile.
Recently, multiple events have illustrated the depth of political divisions in the US: renewed debt limit brinkmanship, the first ouster of a House Speaker in US history, prolonged inability of Congress to select a new House Speaker, and increased threats of another partial government shutdown due to Congress’ inability to agree on budgetary appropriations. In Moody’s view, such political polarization is likely to continue. As a result, building political consensus around a comprehensive, credible multi-year plan to arrest and reverse widening fiscal deficits through measures that would increase government revenue or reform entitlement spending appears extremely difficult.
While the US’ Aaa rating takes into account relative weaknesses with regards to the quality of the country’s legislative and executive institutions and fiscal policy effectiveness compared to other Aaa-rated sovereigns, there is a risk that these weaknesses take greater credit relevance because the deteriorating debt affordability trend would call for a more significant and effective fiscal policy response.
In particular, the US’ lack of an institutional focus on medium-term fiscal planning, either through legislated fiscal rules aimed at improving the fiscal balance or general bipartisan consensus on the need for fiscal consolidation, is fundamentally different from what is seen in most other Aaa-rated peers such as in Government of Germany (Aaa stable) and Government of Canada (Aaa stable). Meanwhile, the more short-term focus of US fiscal policymaking, along with limited fiscal flexibility – because a very large portion of nondiscretionary budgetary spending is on mandatory entitlement programs and debt service (around 75% of total outlays), exacerbates already fractious bipartisan politics around a relatively disjointed and disruptive budget process. As annual debt service costs continue to rise, fiscal flexibility will diminish even further.
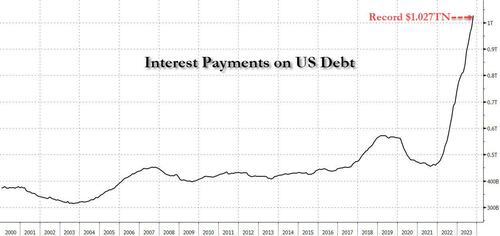
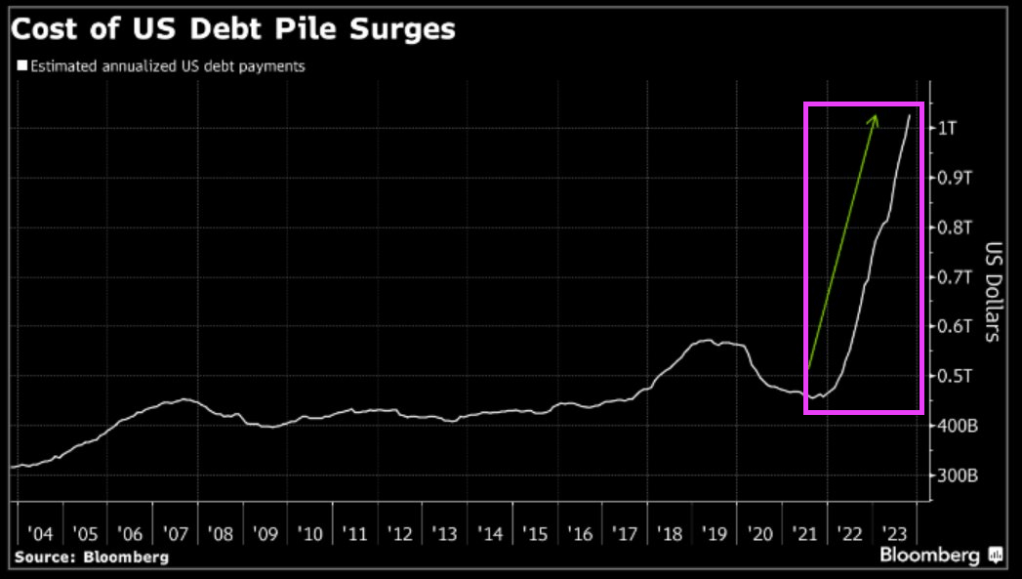
Remember, annual interest payments of the $33.8 TRILLION debt load is now over $1 TRILLION. Yes. rampant Federal spending begat inflation which begat Fed rate hikes.
Under Bidenomics, with its high inflation rate and crushing negative wage growth, consumers are draining their savings and living on a prayer …. and consumer credit to cope.
What is worriesome in the transition rates (like current to 90-days delinquent) Credit cards (blue) and auto loans (red).
A closer look at credit card delinquency rates on a year-over-year (YoY) basis, showing the fastest growth in delinquencies since the Covid economic lockdowns.
Then we have commercial real estate delinquencies are now the highest the have been since 2013.
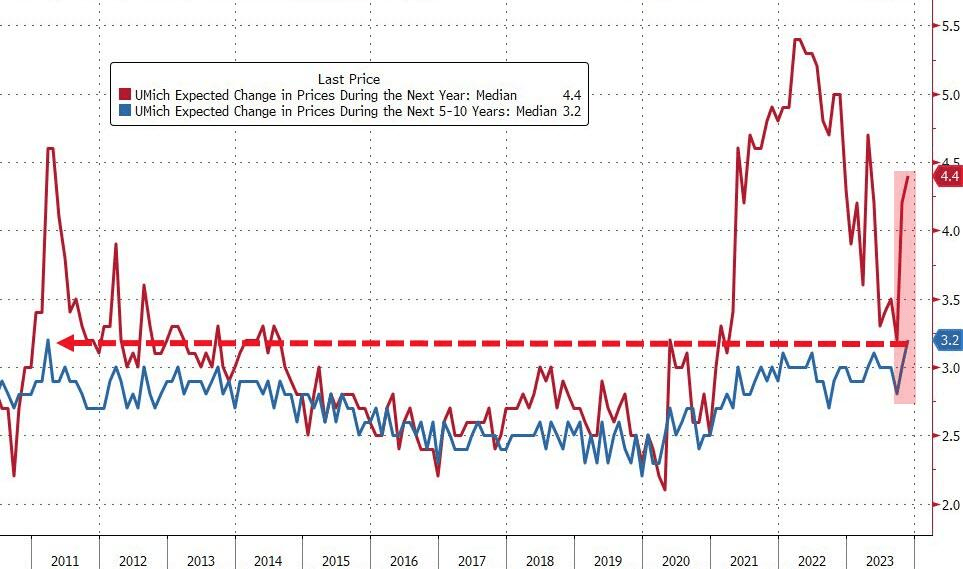
Meanwhile, University of Michigan consumer sentiment about inflation spiked to 4.4%. That is the highest medium-term inflation expectation since 2011.
Has anyone considered the impact of Biden/Mayorkas’s open southern border with Mexico? Other than the crime, stress on existing services like healthcare, schools and Social Security. But where will the 8 million illegal immigrants reside? Well. the Biden Administration has an answer: throw money at it! This time, $45 billion to convert empty office space to homes. Not just for illegals, but for anyone.
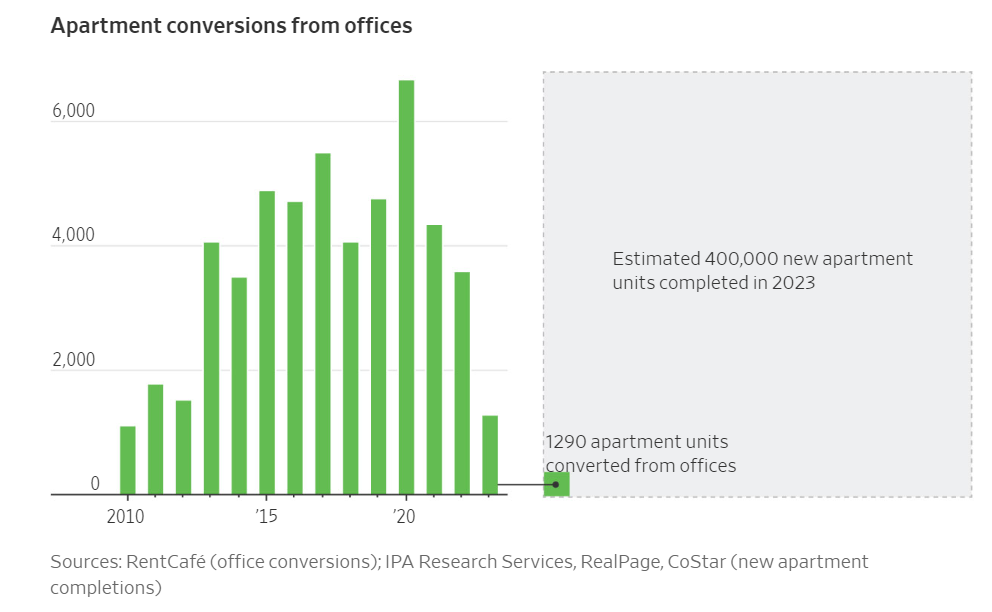
Cities hoping to convert emptying office buildings into apartments are running into financing issues, stagnating rental markets and other challenges that are bottling up their efforts.
Developers last year created just 3,575 apartment units in the U.S. through office conversions, according to an analysis by rental listing site RentCafe. That amounts to less than 1% of all apartments built that year through new construction.
Federal and local governments are also trying to give conversions a boost. The White House said last month that it was updating guidance for existing grants and spending programs to make billions in federal dollars available for these projects. It also said it would seek the conversion of more government-owned properties into housing.
Some cities, such as Washington, D.C., New York and San Francisco, are also taking steps to encourage more conversions. Tax incentives and faster approvals are “rocket fuel” for these projects, said Sheila Botting, a principal at commercial property brokerage Avison Young.
Even so, the process has always been fraught with difficulty and few office buildings are natural candidates. Conversions are easiest in older, lower-quality and mostly empty buildings with small floors. But less than 1% of office space in the biggest U.S. cities ticks those boxes, according to Avison Young.
In significant ways, the conversion process is getting even harder now. Slowing rent growth might make apartment conversions less attractive to investors, if the trend persists into next year. Asking rents for apartments have fallen 1.2% nationally over the past 12 months, according to rentals website Apartment List.
Projects Not Economical
Without massive subsidies these projects are not economically feasible. Many aren’t even with massive subsidies.
In downtown Dallas, developer Wolfe Investments seeks to convert an 18-story, 1950s office tower into residential apartments, but has recently been fighting off foreclosure from its lender, Thistle Creek Partners, court records show.
Developers of One Camelback, a 200,000-square-foot office building in central Phoenix, are trying to convert it into what would be one of the city’s most expensive rental-apartment properties. A website advertises $8,000-a-month apartments, with floor-to-ceiling windows and crystal-clear views of nearby mountains.
But the developers, Sagamore Capital and partners defaulted on a loan of about $70 million. The project’s lender, Delphi Financial Group, has moved to foreclose. An auction of One Camelback is set for later this month, according to documents filed in Maricopa County, Ariz.
Biden Throws $45 Billion in Federal Funds to Convert Offices into Homes
Questions abound. Assume you can convert offices into homes, who wants to live in them? Is a tear down cheaper?
The government has 1,500 office buildings nationally and leases on almost 200 million square feet of additional space that it does not need. Instead of canceling leases and selling the real estate, it’s going to convert them into clean energy spaces.
With enough subsidies, developers will try nearly anything. Then when the projects fail, the developers ask for more money.
How is this Being Paid For?
Taxpayers of course. But Biden is funneling $45 billion from clean energy incentives in the ridiculously named Inflation Reduction Act (IRA) into housing conversions.
You might also be wondering what this has to do with clean energy, and the answer is nothing. The questions keep piling up and I have answers.
What’s Really Going On Here?
Biden is hoping to spread the IRA dollars around to buy more votes.
But to do so, he is taking money away from his other pet projects to fund the idea of the moment. His idea of the moment is to do something about the price of rent.
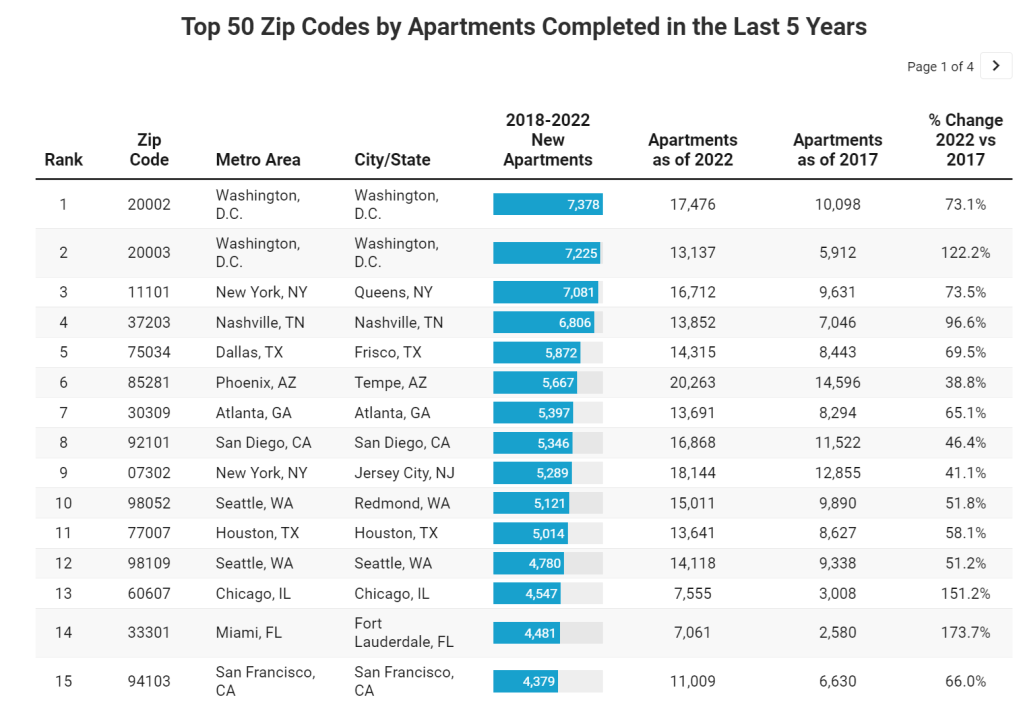
According to RentCafe, Washington DC had two zip codes that led the nation in apartments completed in the last five years (up to 2022).
Why is the private sector doing so few conversions? THAT is the right question. The answer? Office-to-housing conversion is hard and the demand may not be there. But with 8 million illegal immigrants having crossed the border, Biden has to do something. So Biden steps in with $45 billion to convert empty office space to homes. And I have to ask: is this a shadow wealth transfer to large Democrat-controlled cities as an apology for the havoc caused by Biden/Mayorkas open border policy?? Just asking!
So if an idea is really bad and won’t work, like solar power in areas with limited/spotty sunlight or wind turbines in areas with little/sporadic wind, Federal and State governments are always on stand-by to do something really stupid. Like rent control, which creates even worse distortions.
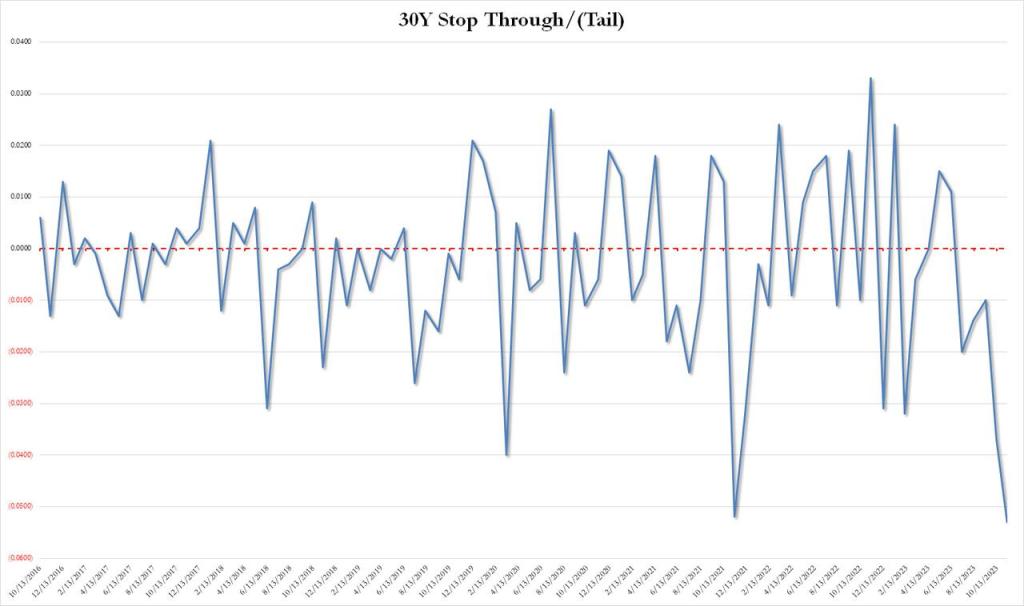
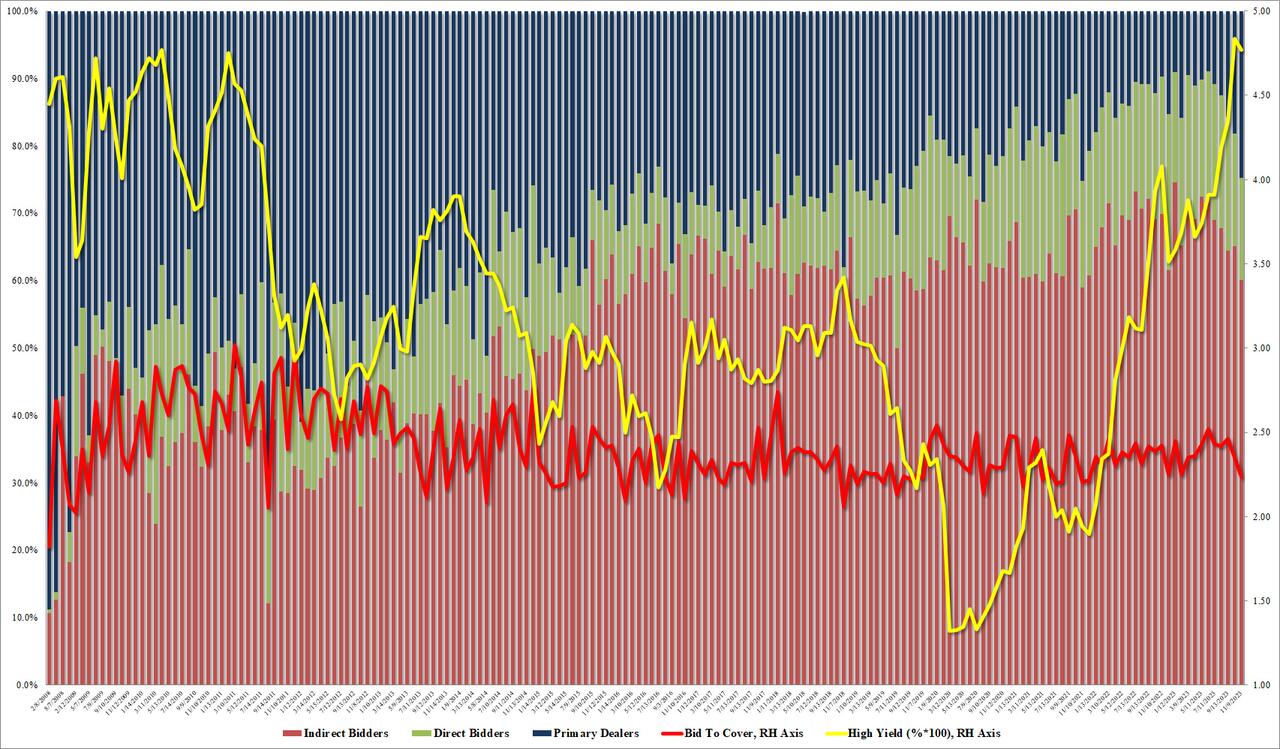
The bond priced at a high yield of 4.769%, which was below last month’s 4.837%, and just shy of the April 2010 high. But more importantly, it tailed the When Issued by a whopping 5.3bps, which was… well… terrible, because as shown in the chart below, this was the biggest tail on record (going back to 2016).
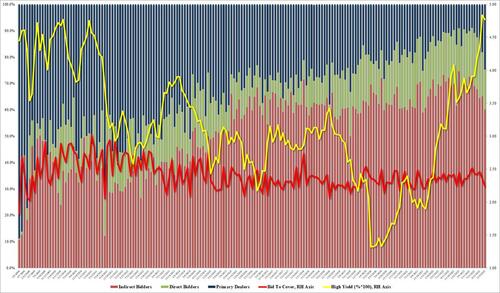
The bid to cover was just as bad: at 2.236 it was the lowest since Dec 2021.
The internals were even worse as foreign bidders (Indirects) tumbled from 65.1% to 60.1%, the lowest since Nov 2021, and with Directs taking down only 15.2%, banks (Dealers) were forced to step up and take the balance, or a whopping 24.7%, double the recent average of 12.7%, and the highest since Nov 2021.
This is a big warning flag because every time we have seen a surge in Dealer takedowns, some sort of Fed intervention – QE or otherwise – has usually followed and we doubt this time will be different.
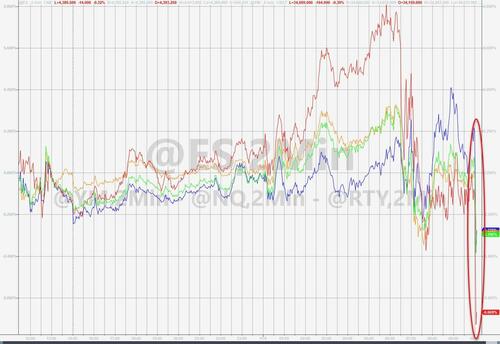
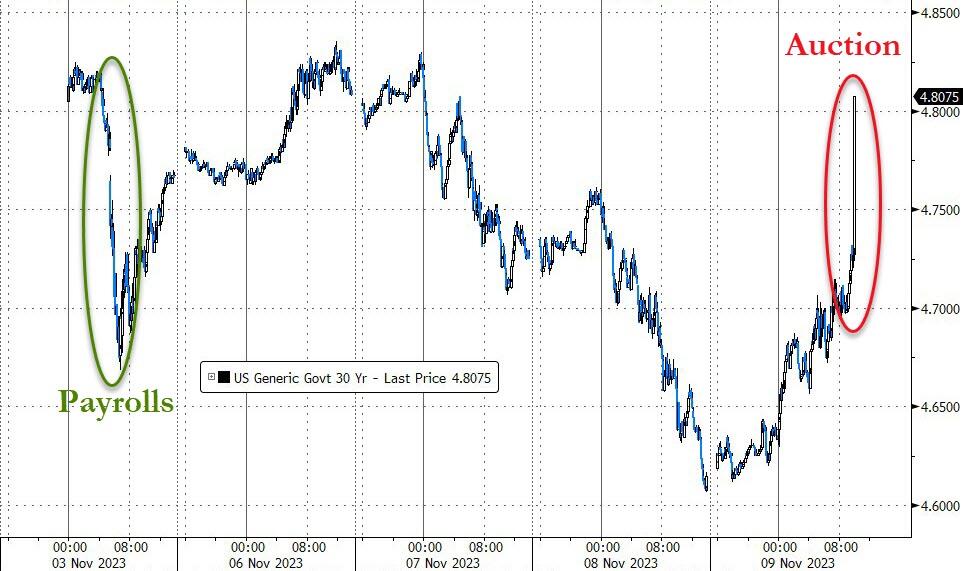
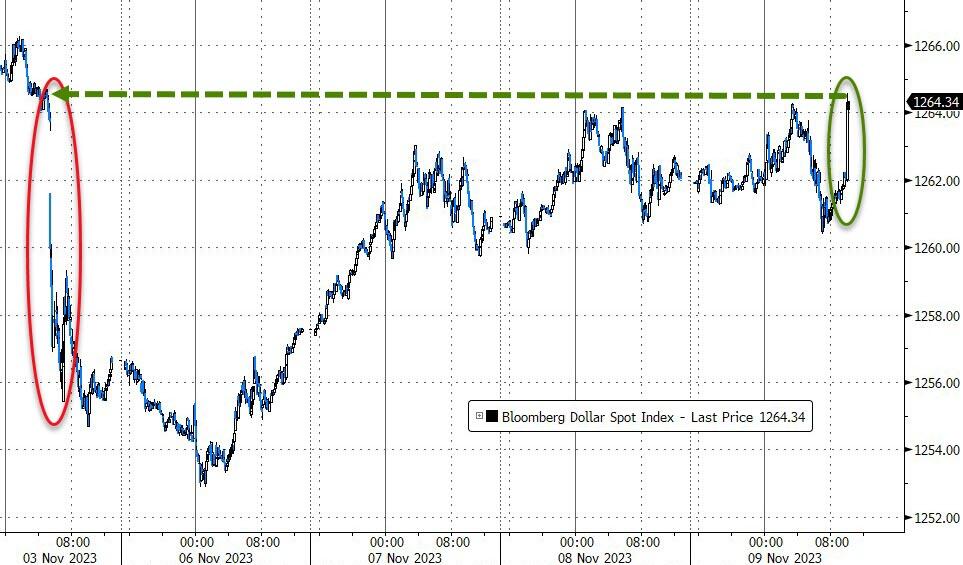
The market reaction to the catastrophic 30Y auction was immediately, sparking a swift and painful response across markets with bonds and stocks hammered lower and the dollar spiking.
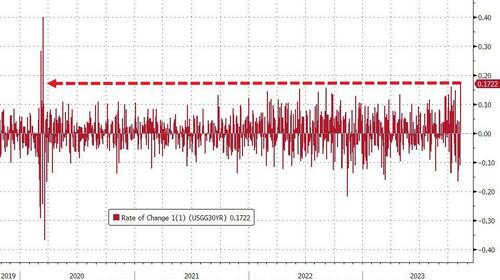
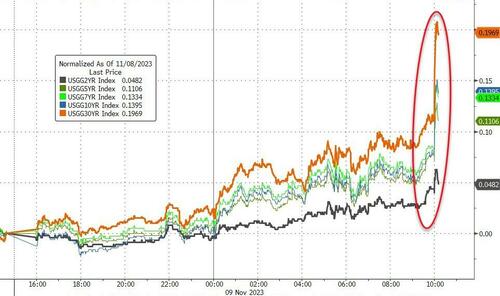
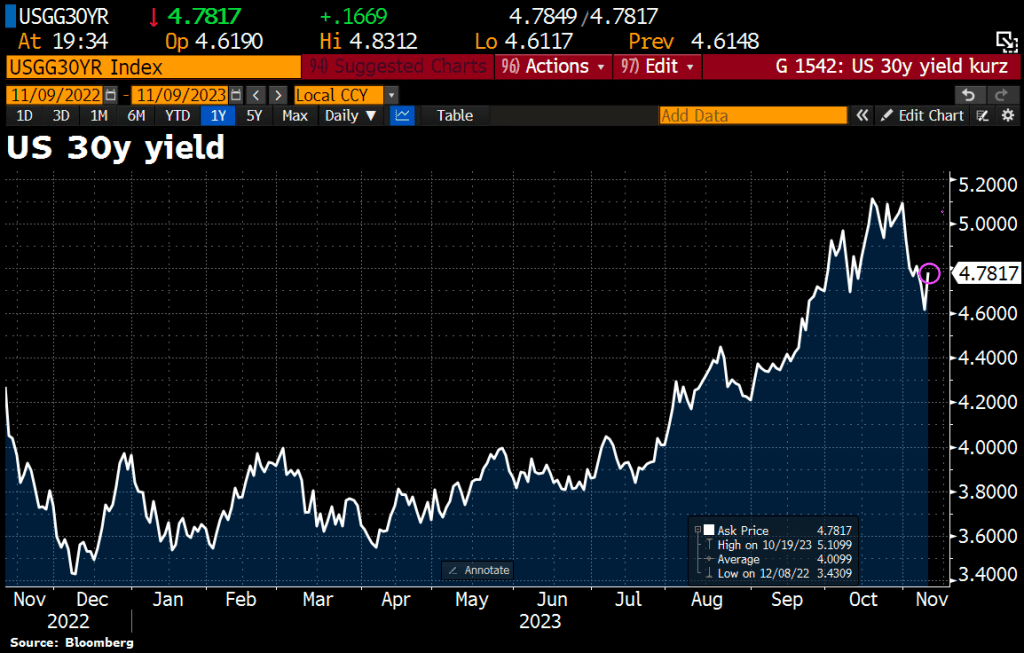
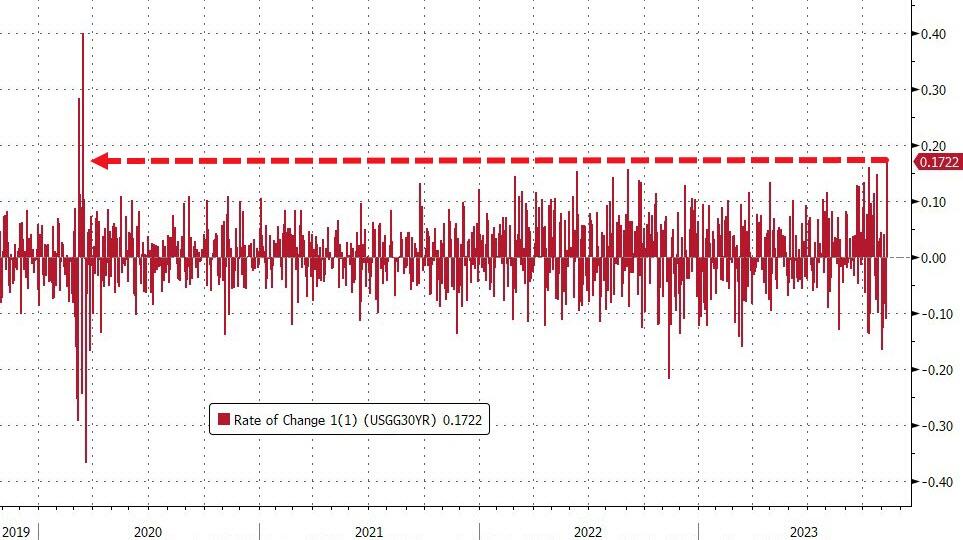
Treasury yields – as you would expect – exploded higher, with 30Y Yields back up to pre-payrolls levels…
That is the biggest spike in 30Y yields since March 2020…
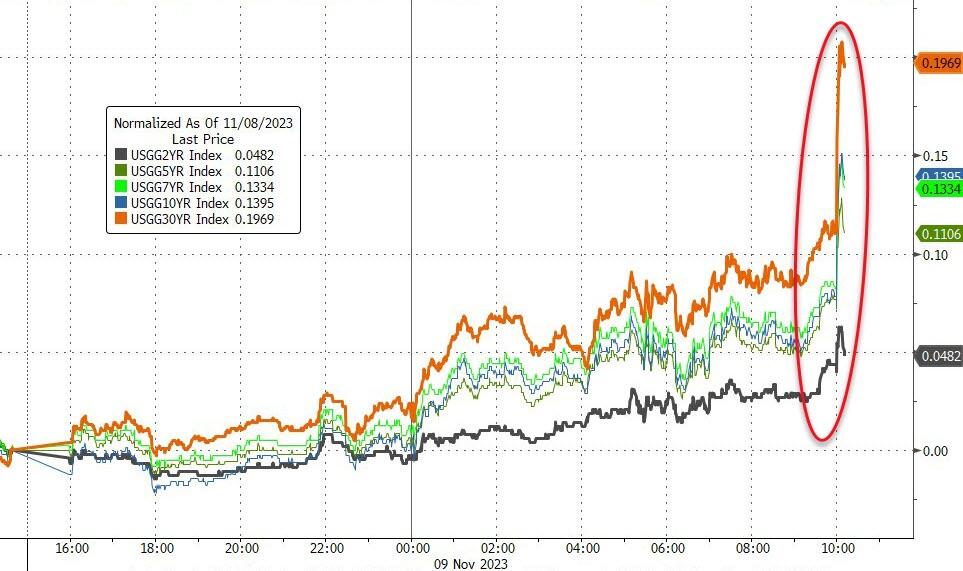
But the entire curve is higher in yields…
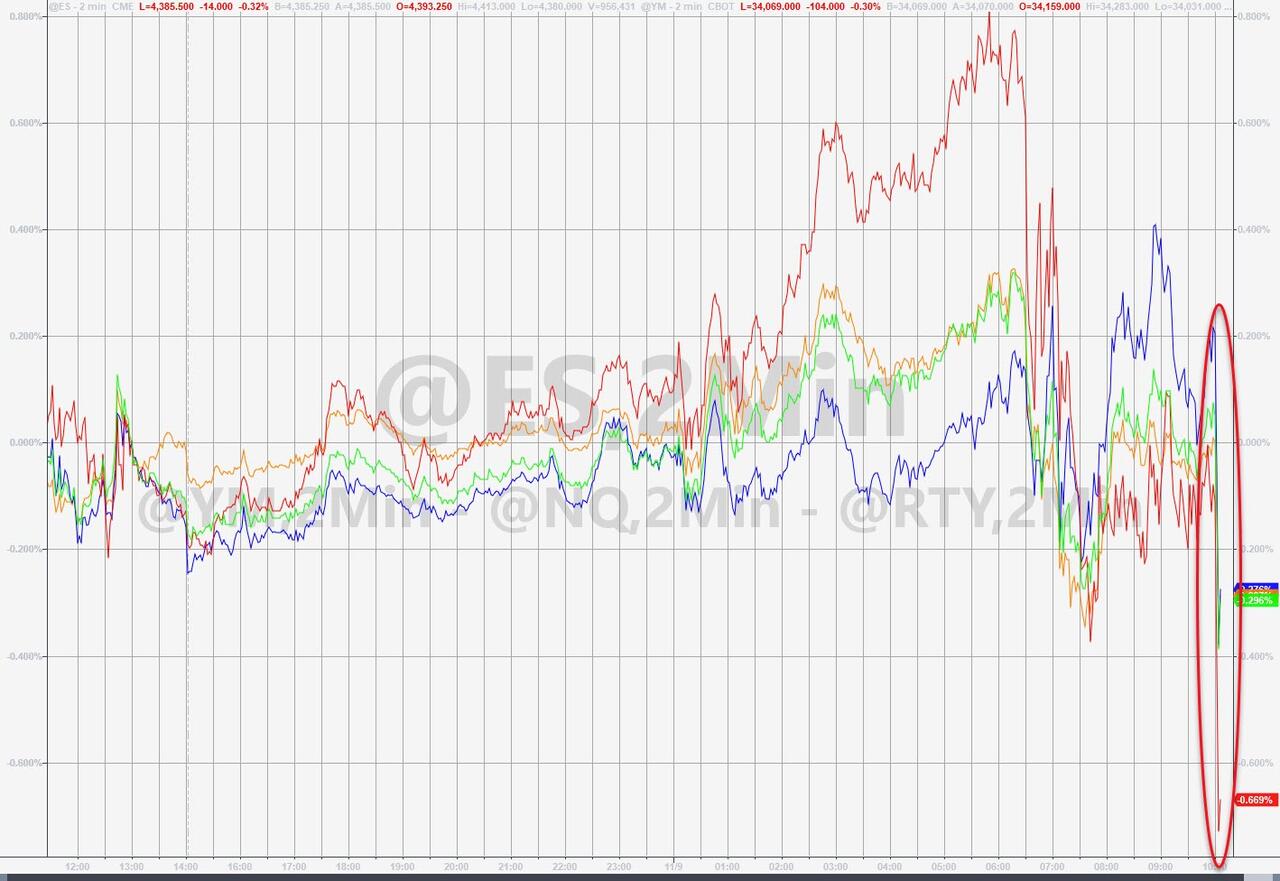
Stocks tanked…
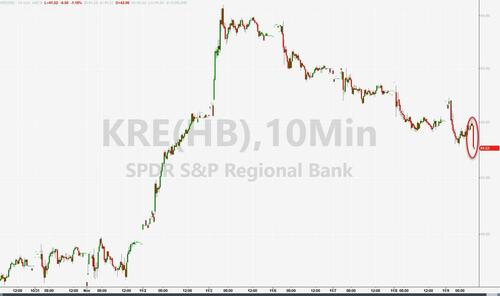
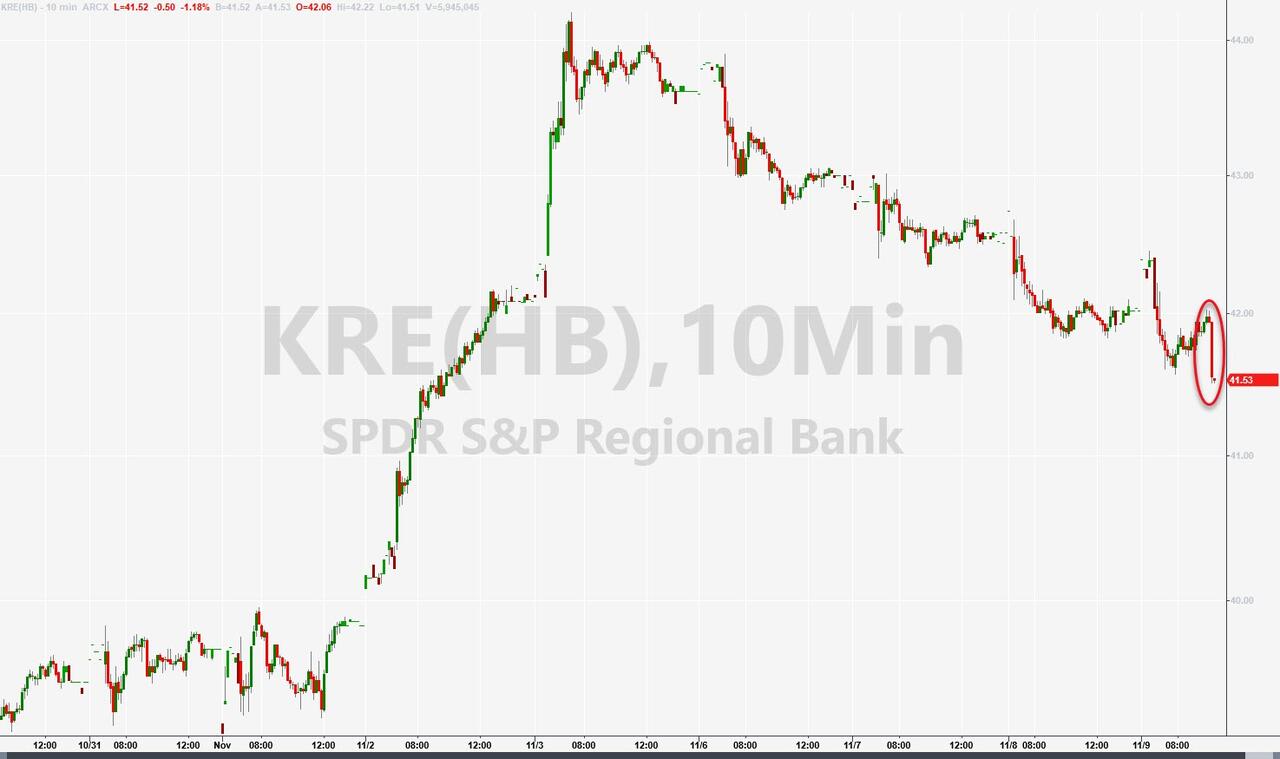
Regional bank stocks tumbled…
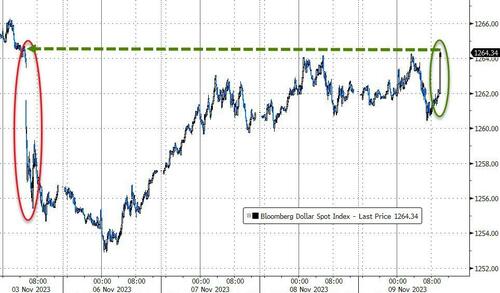
The dollar ripped back up to pre-payrolls levels…
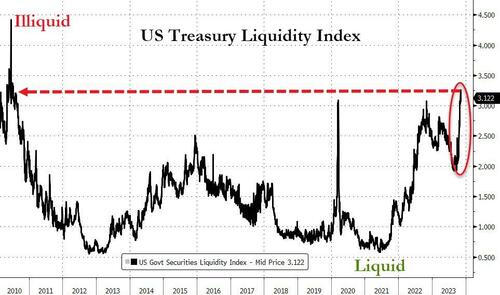
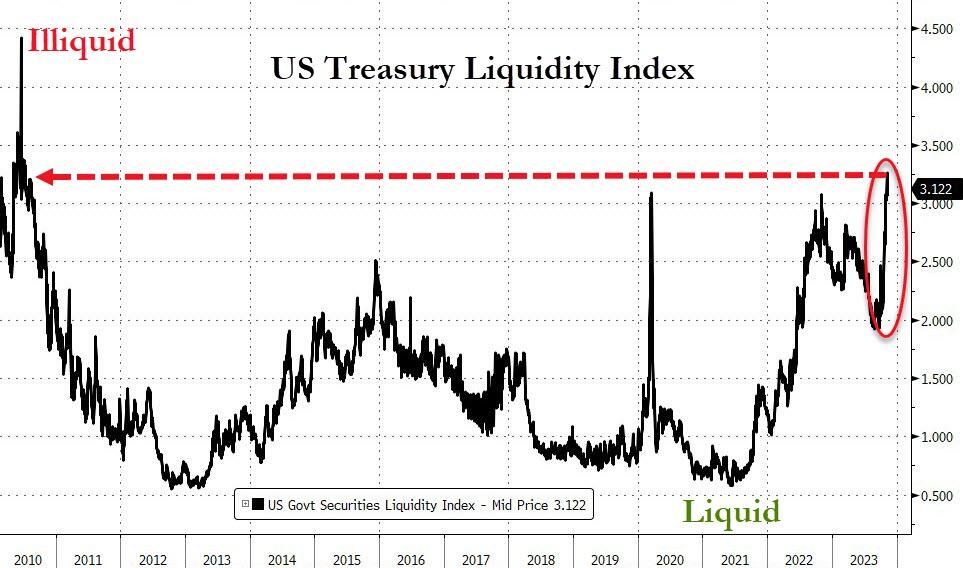
Finally, we note that this ugly auction comes as Treasury Liquidity is evaporating dramatically…
The Fed (and The Treasury) have a problem!! Particularly since the 30Y yield reversed course and is on the rise again.
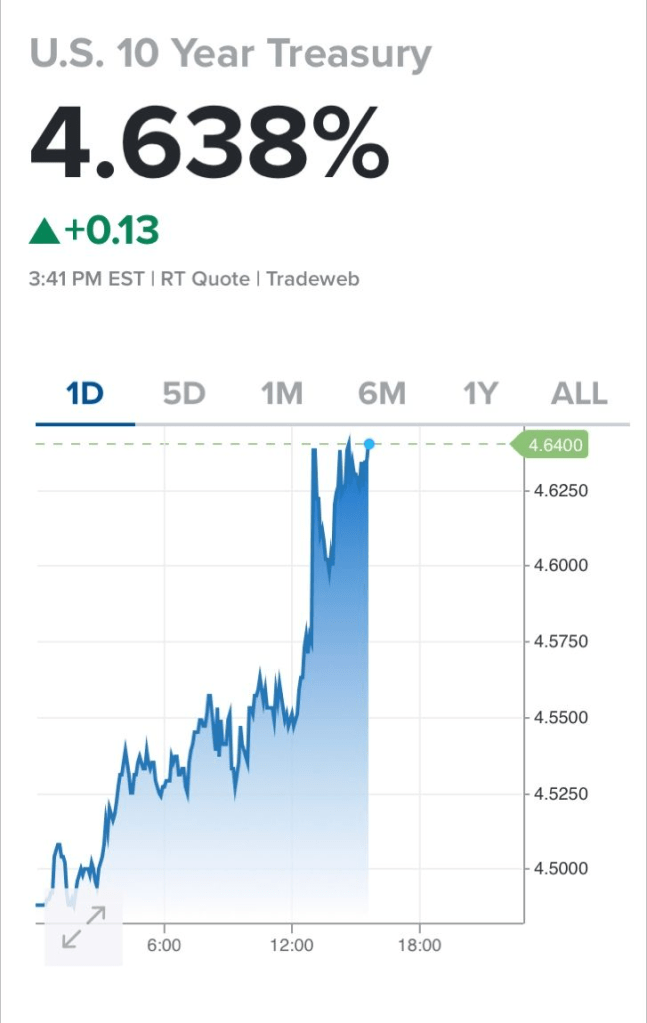
And at the 10 year tenor, the rate rose to 4.638%.
All together now!!
The Edmund Fitzgerald, symbolic of the US under Biden and Janet Yellen.
$1.027 trillion in interest is calculated by multiplying the average interest rate on marketable US Treasury debt (which according to the Treasury is 3.096% as of Oct 31) by the $26.003 trillion in marketable US debt (as of Oct 31) which nets off to $805 billion, and adding to this non-marketable debt interest (which as of Oct 31 was 2.884% multiplied by the amount of non-marketable debt which is $7.696 trillion) and which in turn is an additional $222 billion in interest. Add across and you get $1.027 trillion.
Naturally, this calculation of estimated real-time interest costs – which is entirely based on Treasury data – is different than what the Treasury actually paid. Interest costs in the fiscal year that ended Sept. 30 ultimately totaled $879.3 billion, up from $717.6 billion the previous year and about 14% of total outlays, however that number is merely lagging what the pro forma print currently is, and will inevitably catch up to it, and then lag on the other side even as pro forma interest payment start dropping (once interest rates plunge after the next QE/YCC is launched).
Fans of exponential functions, we got you covered: the unprecedented surge in both interest rates and interest expense in the past two years means that total US interest has doubled since April 2022 and that’s with the inherent lag in interest catch up – as a reminder, the vast majority of 5, 7, 10 and 30 year debt is still locked in at much lower interest rates, and as such, rates will continue to rise as all of the existing debt rolls into much higher rates over the coming years.
Looking ahead, the staggering surge in both yields and total long-term Treasuries in recent months confirms the government will continue to face an escalating interest bill. As a reminder, we were the first to point out that it took just one month after US federal debt first rose above $33 trillion for the first time, to spike by another $600 billion.
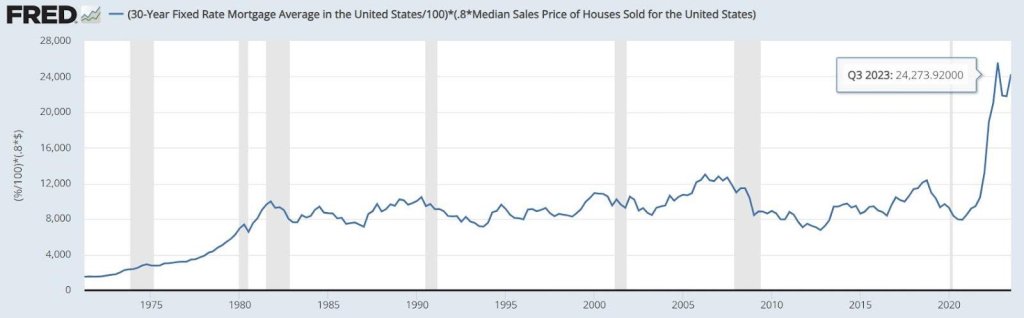
On the personal finance side, annual Interest payments on a 30-year, fixed-rate mortgage before Biden was $8,500, but after Biden it almost tripled to $24,300! That means that annual mortgage interest rose 186% under Biden.
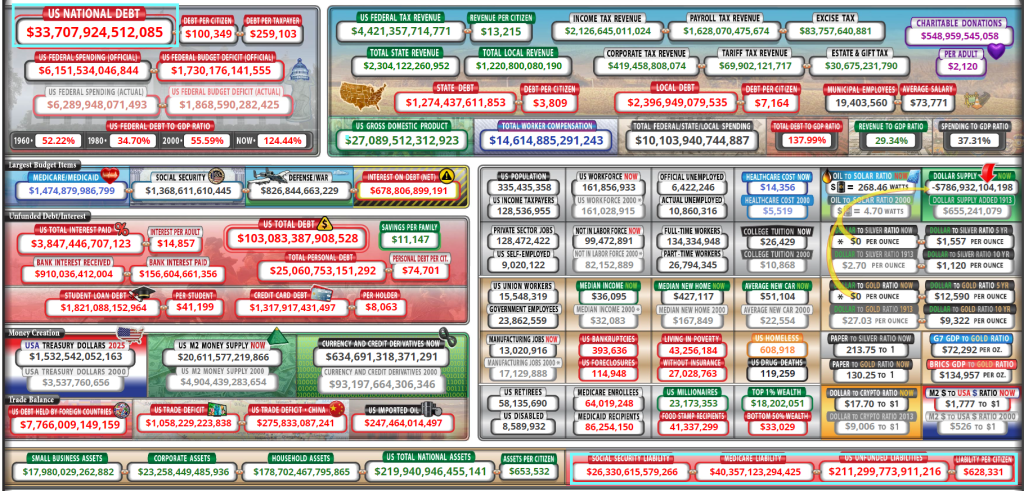
US Federal debt just hit $33.71 TRILLION. And unfunded liabilities (promises from Uncle Spam) are now $211 TRILLION. That is 526% of the the current debt load. Which means either lots of additional debt, higher tax rates or cuts in entitlements.
The cost of US debt continues to soars as The Fed combats Bidenflation.
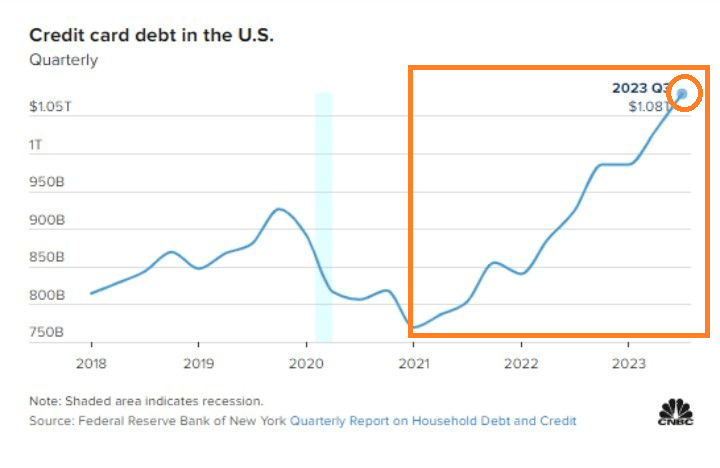
But it isn’t just Federal government debt that is exploding under Bidenomics. Consumer credit card debt has exploded under Bidenomics as consumer struggle with inflation.
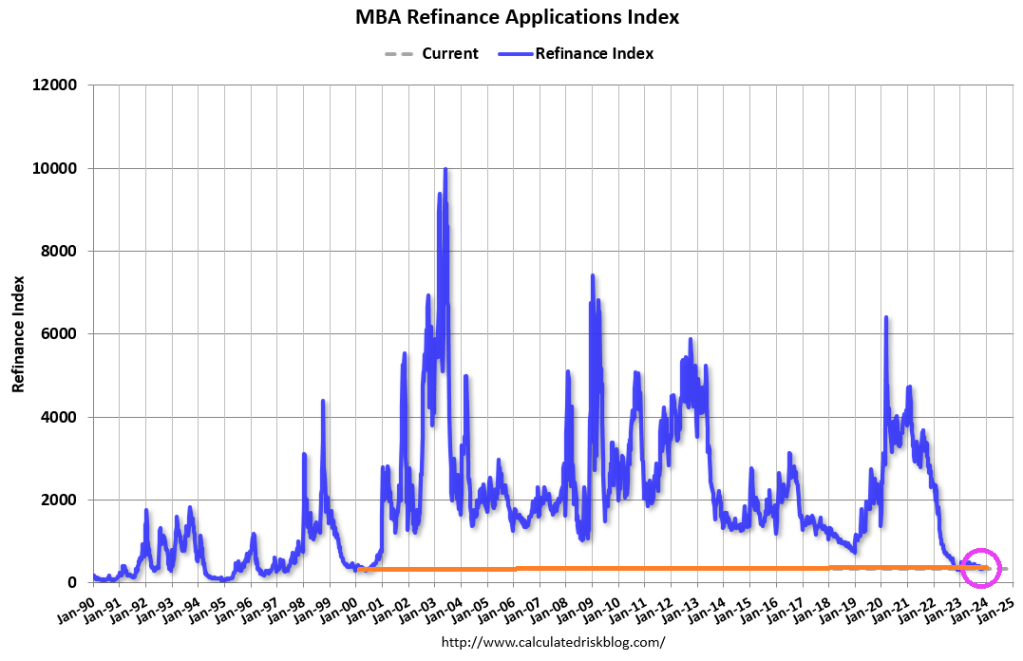
US inflation is lower than it was a year ago (cheers from The View CNN and MSNBC cheerleaders), but inflation remains stubborning above The Fed’s 2% target rate and will likely remain above 2% for the nexf few years. So mortgage demand is much like inflation … mortgage demand increased in the latest week but generally is very low compared to last year.
Mortgage applications increased 2.5 percent from one week earlier, according to data from the Mortgage Bankers Association’s (MBA) Weekly Mortgage Applications Survey for the week ending November 3, 2023.
The Market Composite Index, a measure of mortgage loan application volume, increased 2.5 percent on a seasonally adjusted basis from one week earlier. On an unadjusted basis, the Index increased 1 percent compared with the previous week. The Refinance Index increased 2 percent from the previous week and was 7 percent lower than the same week one year ago.
The seasonally adjusted Purchase Index increased 3 percent from one week earlier. The unadjusted Purchase Index increased 1 percent compared with the previous week and was 20 percent lower than the same week one year ago.
The 30-year fixed mortgage rate dropped by 25 basis points to 7.61 percent, the largest single week decline since July 2022. But, mortgage rates are up 169% under Biden and Bidenomics.


You must be logged in to post a comment.