Are you ready? You can tell an election is on the radar since inflation numbers are settling down for the most part. According to the BLS, overall inflation fell slightly in June to 3.0%.
Shelter CPI is up 5.14% YoY as M2 Money growth has been rising slowly … again.
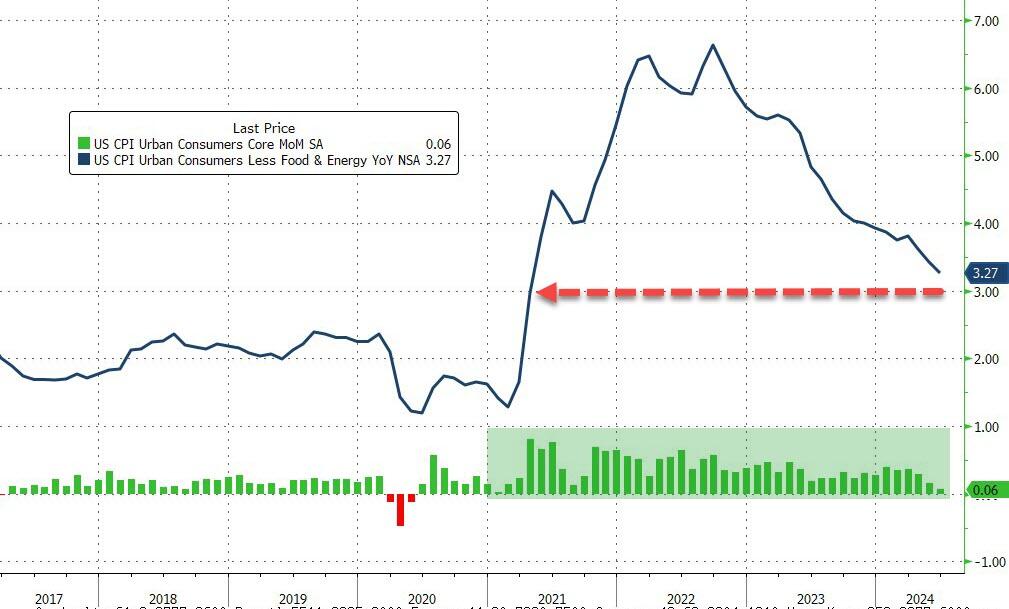
Core CPI also ‘missed’, rising just 0.1% MoM (vs +0.2% exp), dragging the YoY Core CPI down to +3.27% – its lowest since April 2021…
Source: Bloomberg
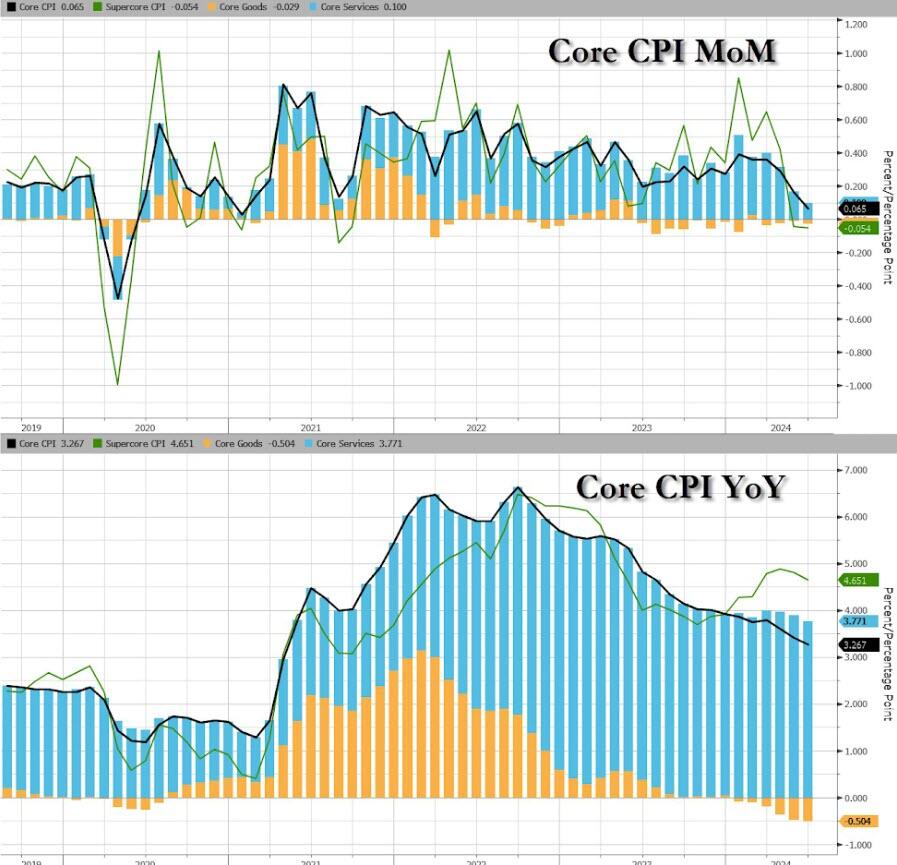
Goods deflation also dominates core prices disinflationary trend…
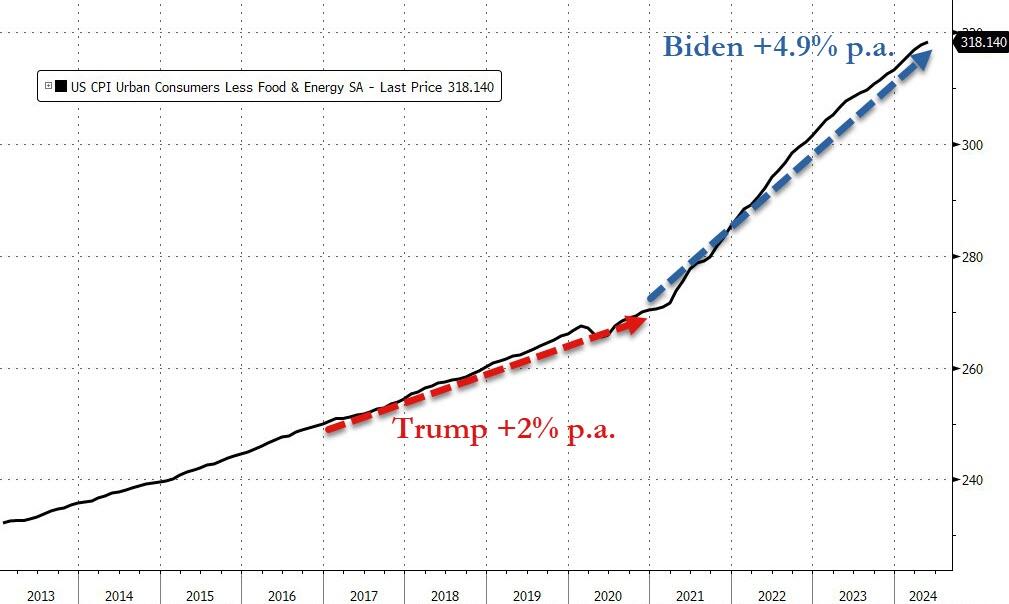
We do note that Core consumer prices have still not seen a single monthly decline since Bidenomics began.
Core consumer prices are up just under 18% since Bidenomics began (+4.9% per annum) – that is dramatically higher than the 2.0% per annum Americans experienced under Trump…
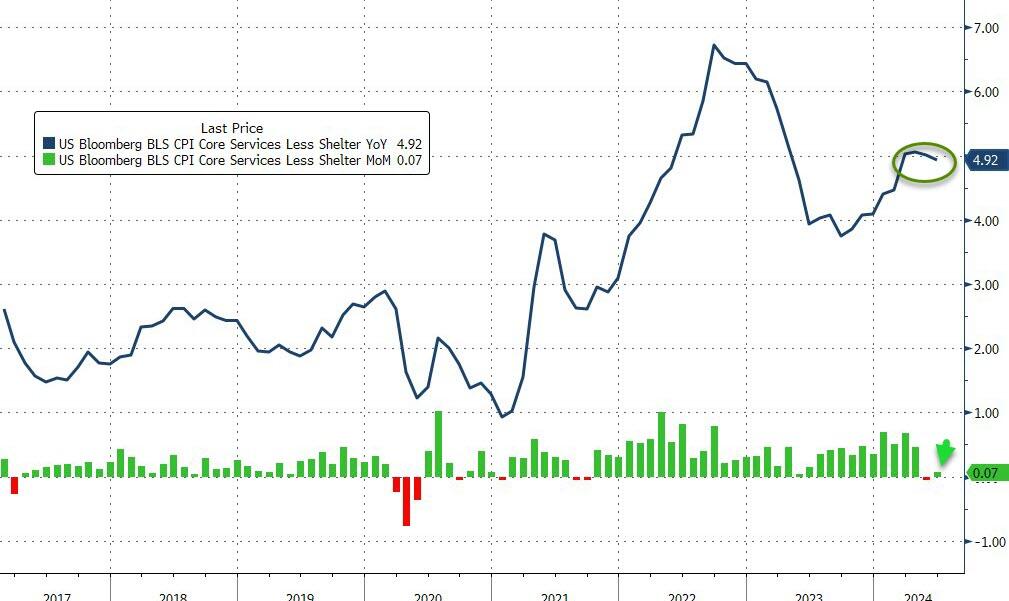
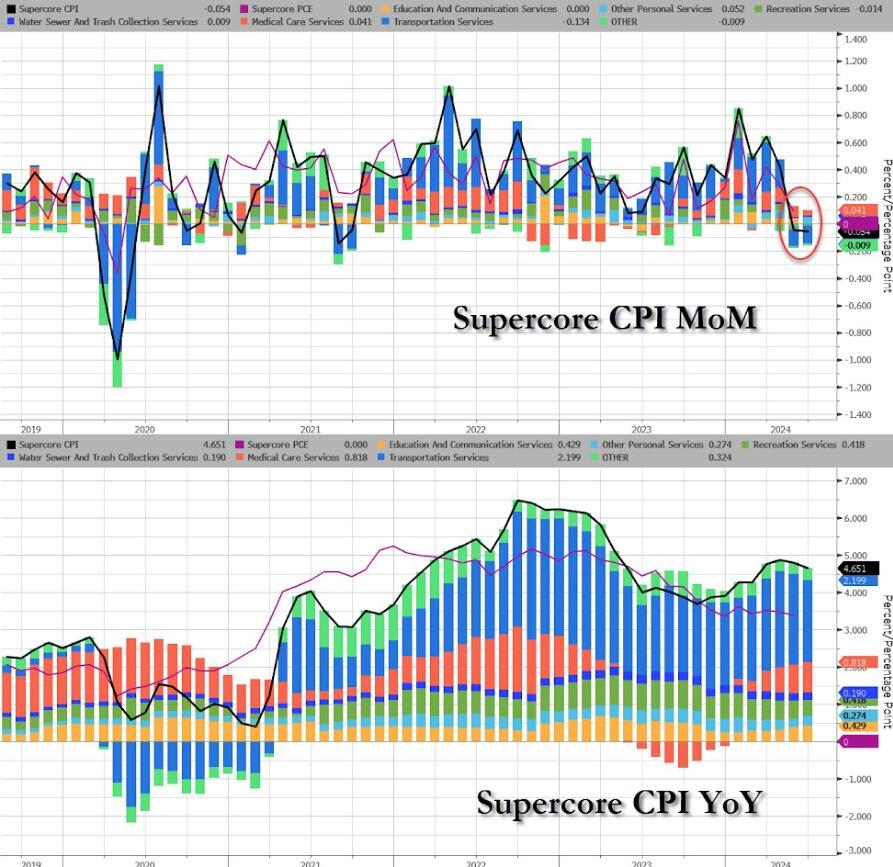
The much-watched SuperCore CPI rose on a MoM basis but declined (back below 5.0%) on a YoY basis (but obviously remains extremely elevated)…
Source: Bloomberg
Transportation Services are seeing prices fall…
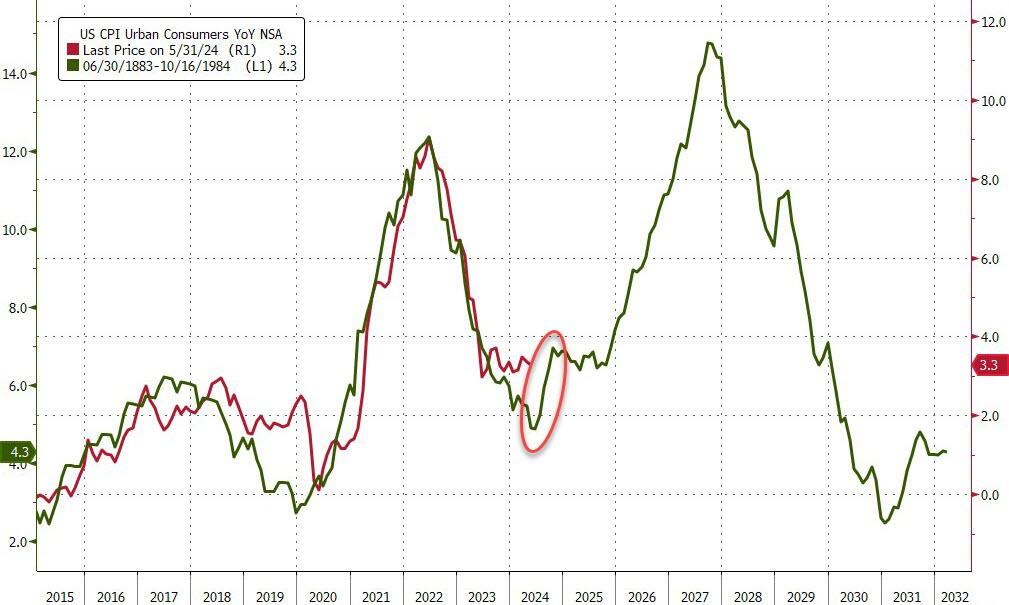
Finally, we can’t help but get a sense of deja vu all over again here. What if… The Fed cuts (because bad – recession – data), Biden loses (because dementia), and inflation re-accelerates (just like in the 80s)…
Source: Bloomberg
Challenger job cuts in construction we the highest since 2008 putting downward pressure on wages.
It seems everything Biden touches turns to stone. This used to be called “The Medusa Touch” but I changing that to “The Biden Touch.” And that includes housing. Or we can simply sing along with the late Jimmy Buffet and “Wasting aways again in Bidenville.”
And near 7% mortgage rates aren’t helping (as The Fed continues its fight against Bidenflation).
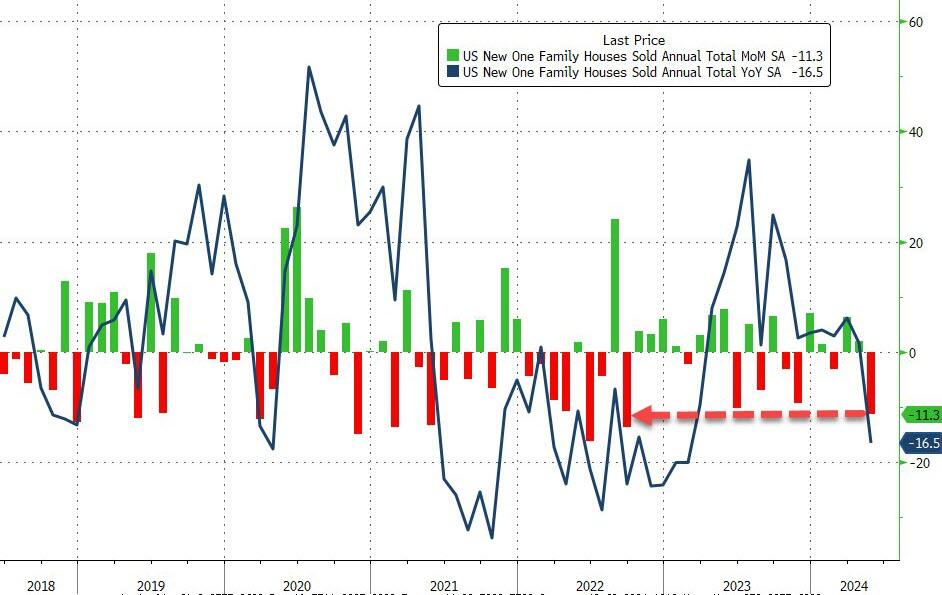
New home sales crashed 11.3% MoM (after April’s 4.7% drop was revised up to a 2.0% MoM rise). That is the biggest MoM drop since Sept 2022…
Source: Bloomberg
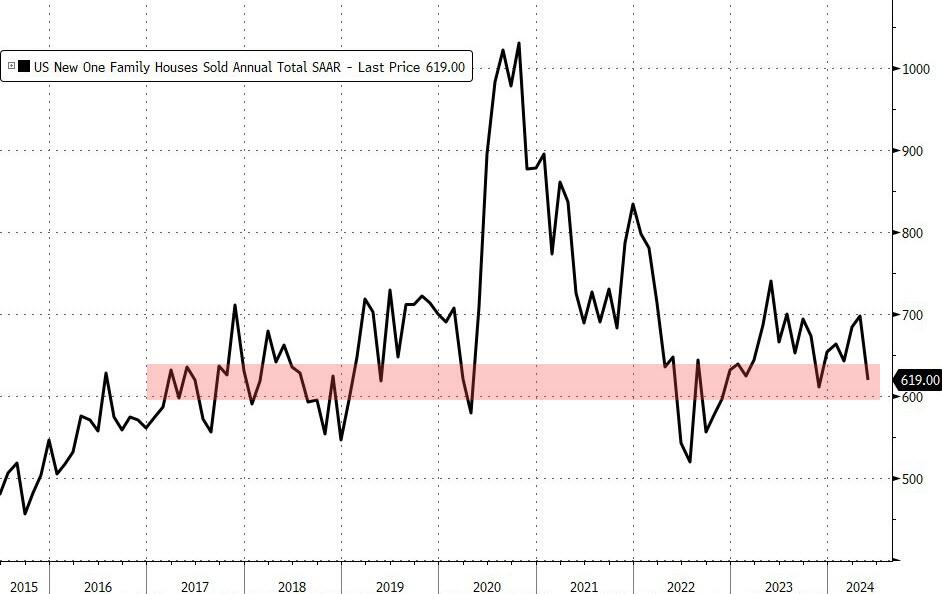
This is the biggest YoY drop since Feb 2023, taking the SAAR down to the same level as it was in 2016…
Source: Bloomberg
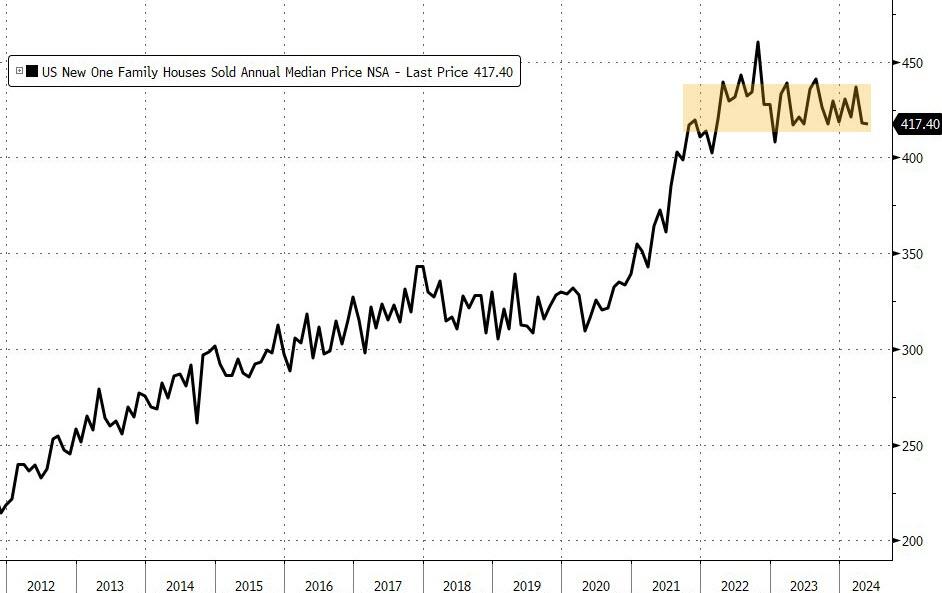
Median new home price fell 0.9% YoY to $417,400 – lowest since April 2023 – (with the average selling price at $520,000) with a big downward revision for April from $433k to $417k!…
Source: Bloomberg
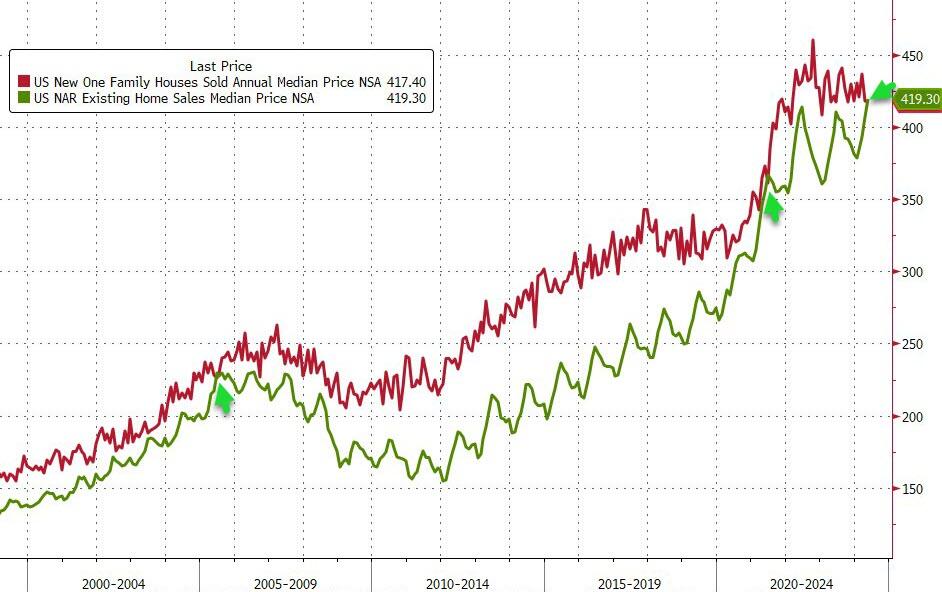
For the first time since June 2021, median existing home prices are above median new home prices…
Source: Bloomberg
As BofA warned yesterday:
“The US housing market is stuck, and we are not convinced it will become unstuck anytime soon. After a surge in housing activity during the pandemic, it has since retreated and stabilized. We view the forces that have reduced affordability, created a lock-in effect for homeowners, and limited housing activity will remain in place through our forecast horizon “
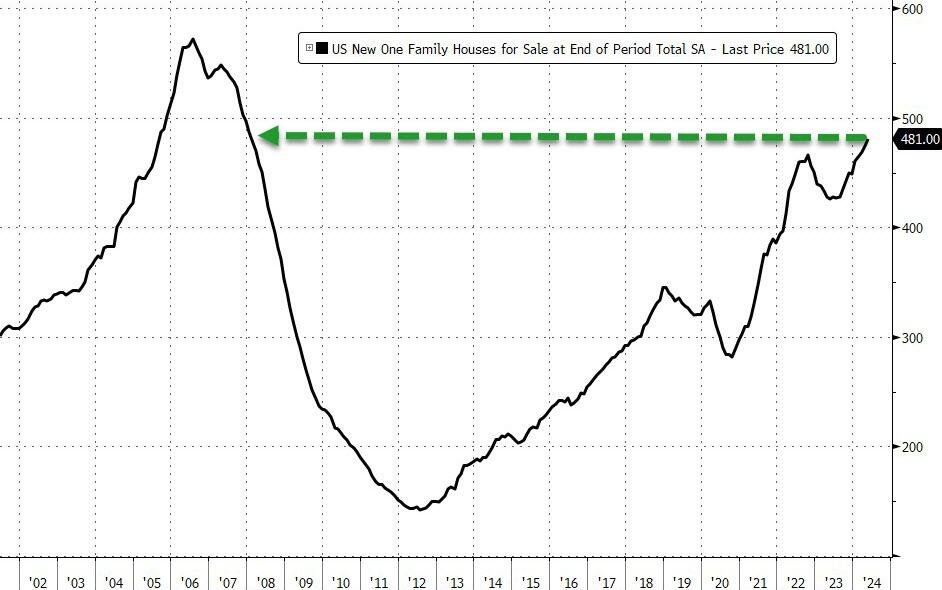
At the same time, the supply of available homes increased to 481,000, still the highest since 2008.
Source: Bloomberg
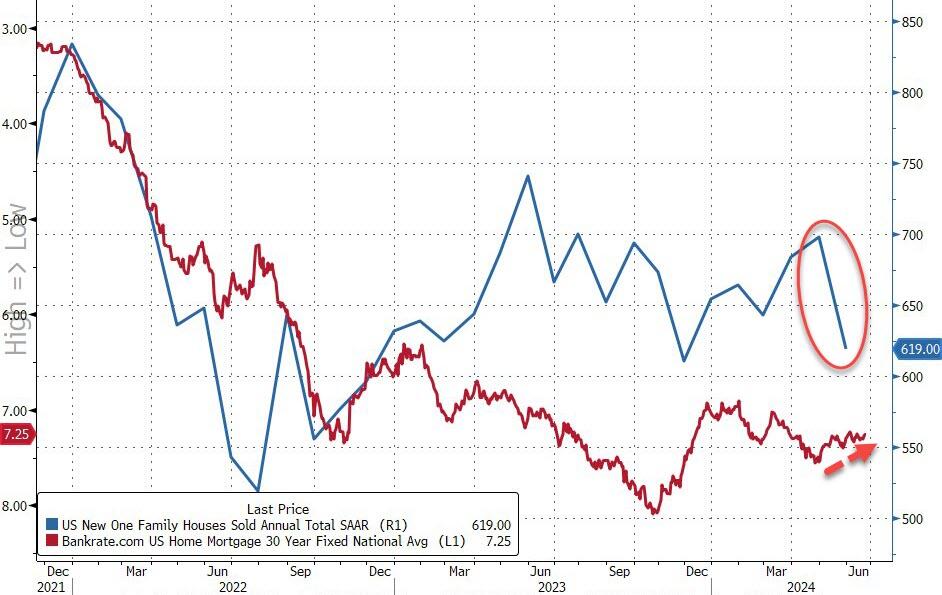
New home sales are catching down to the reality of mortgage rates continuing to hold above 7%…
Source: Bloomberg
It seems homebuilders finally gave up filling that gap in anticipation of an imminent Fed rate-cut to save the world.
Will Biden double down on his failed policies tonight in the CNN Presidential debate? Perhaps Joe can sing “Double Shot of Bidenomics.”
S&P/Case-Shiller released the monthly Home Price Indices for April (“April” is a 3-month average of February, March and April closing prices). The pace of appreciation has slowed from the previous month, reflecting the toll of 7% mortgage rates and low inventory.
This release includes prices for 20 individual cities, two composite indices (for 10 cities and 20 cities) and the monthly National index.
The S&P CoreLogic Case-Shiller U.S. National Home Price NSA Index, covering all nine U.S. census divisions, reported a 6.3% annual gain for April, down from a 6.5% annual gain in the previous month. The 10-City Composite saw an annual increase of 8.0%, down from an 8.3% annual increase in the previous month. The 20-City Composite posted a year-over-year increase of 7.2%, dropping from a 7.5% increase in the previous month. San Diego continued to report the highest annual gain among the 20 cities in April with a 10.3% increase this month, followed by New York and Chicago, with increases of 9.4% and 8.7%, respectively. Portland once again held the lowest rank this month for the smallest year-over-year growth, with a 1.7% annual increase in April. … The U.S. National Index, the 20-City Composite, and the 10-City Composite upward trends decelerated from last month, with pre-seasonality adjustment increases of 1.2%, 1.36% and 1.38%, respectively.
After seasonal adjustment, the U.S. National Index and 10-City Composite posted the same month-over-month increase of 0.3% and 0.5% respectively as last month, while the 20-City reported a monthly increase of 0.4%.
“For the second consecutive month, we’ve seen our National Index jump at least 1% over its previous all-time high,” says Brian D. Luke, Head of Commodities, Real & Digital Assets at S&P Dow Jones Indices. “2024 is closely tracking the strong start observed last year, where March and April posted the largest rise seen prior to a slowdown in the summer and fall. Heading into summer, the market is at an all-time high, once again testing its resilience against the historically more active time of the year.
“Thirteen markets are currently at all-time highs and San Diego reigns supreme once again, topping annual returns for the last six months. The Northeast is the best performing market for the previous nine months, with New York rising 9.4% annually. Sustained outperformance of the Northeast market was last observed in 2011. For the decade that followed, the West and the South held the top posts for performance. It’s now been over a year since we’ve seen the top region come from the South or the West.
Of course, Fed Money Printing is helping drive home price growth. Perhaps too much!
Here is Jerome Powell, Chairman of The Fed Bubble Blowing Machine!!
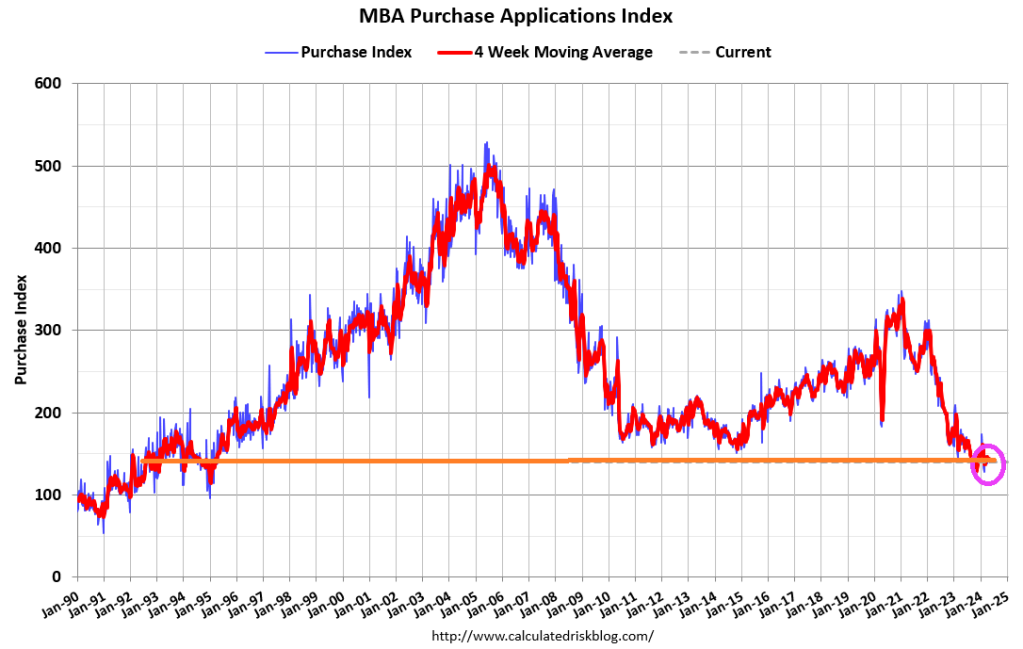
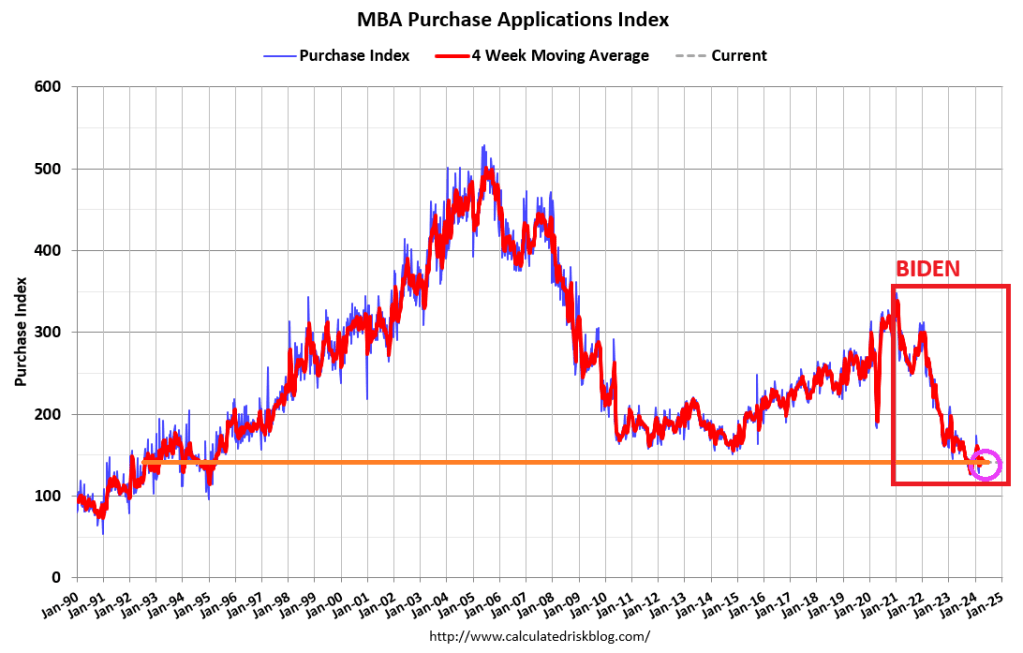
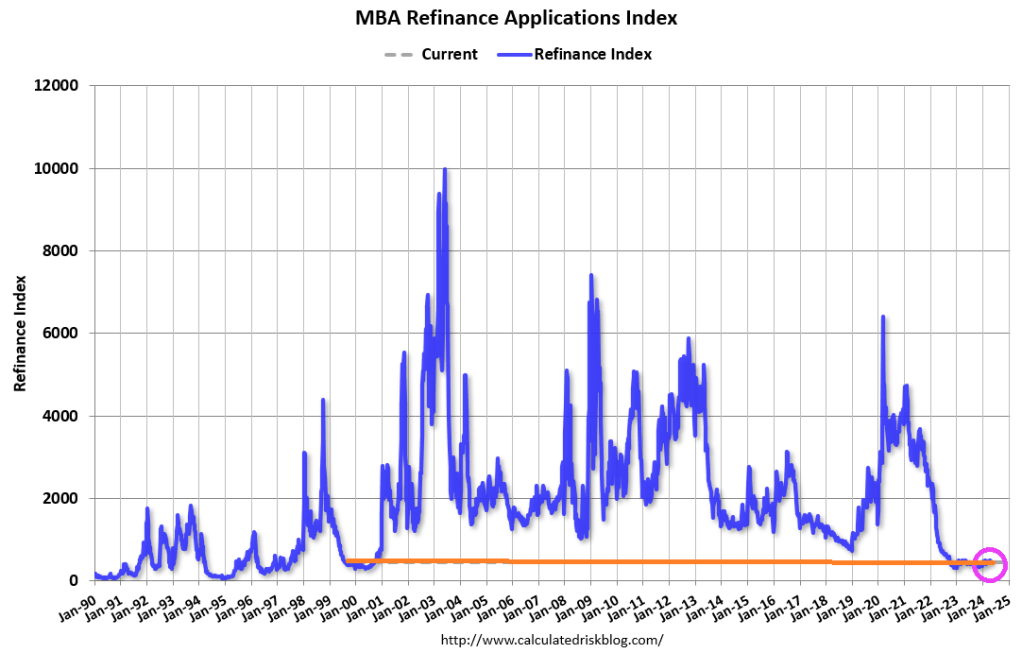
Mortgage applications increased 1.9 percent from one week earlier, according to data from the Mortgage Bankers Association’s (MBA) Weekly Mortgage Applications Survey for the week ending May 17, 2024.
The Market Composite Index, a measure of mortgage loan application volume, increased 1.9 percent on a seasonally adjusted basis from one week earlier. On an unadjusted basis, the Index increased 1.1 percent compared with the previous week. The seasonally adjusted Purchase Index decreased 1 percent from one week earlier. The unadjusted Purchase Index decreased 2 percent compared with the previous week and was 11 percent lower than the same week one year ago.
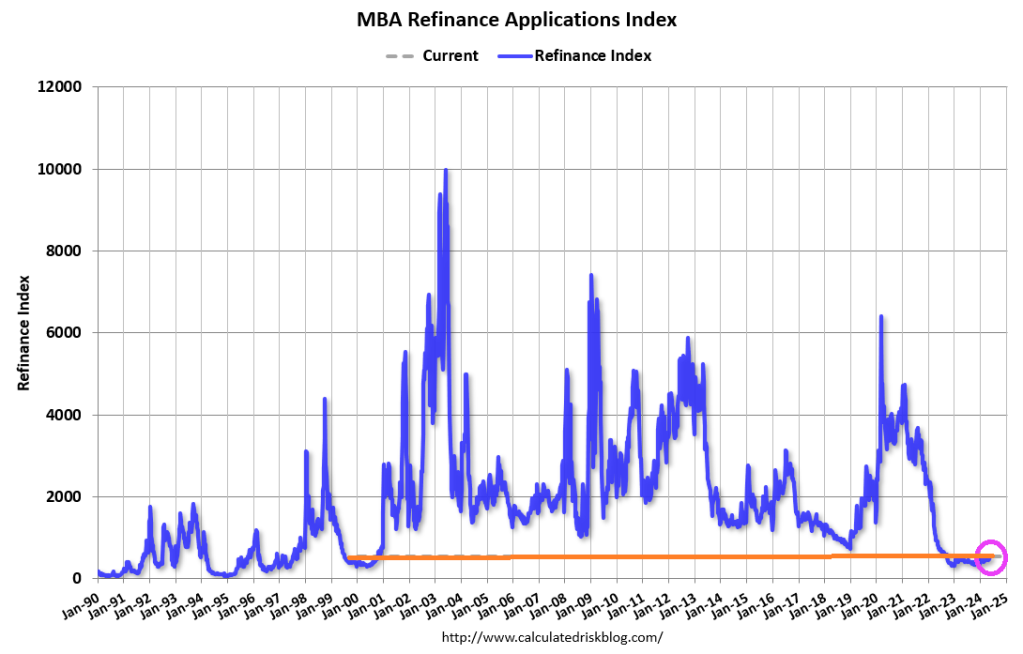
The 30-year fixed mortgage rate declined for the third straight week, dropping to 7.01 percent – the lowest level in seven weeks. Thus, the Refinance Index increased 7 percent from the previous week and was 21 percent higher than the same week one year ago.
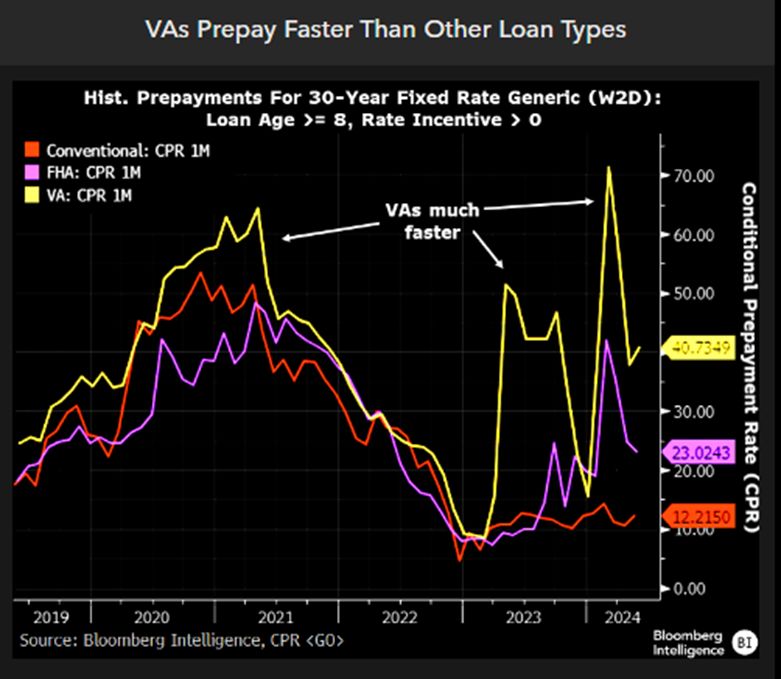
VA-insured mortgages prepay the fastest, followed by FHA-insured mortgages then conventional mortgages.
I know a place where the housing market is hot! Florida and Texas!
Bloomberg reports that PBoC Deputy Governor Tao Ling announced the new 300 billion yuan ($41.5 billion) nationwide program of cheap funding to allow state-owned companies to purchase unsold homes.
Ling said the funding will be directed at 21 providers, including policy banks, state-owned commercial lenders, and joint-stock banks. A rate of 1.75% will be offered. The low-cost loans have a one-year term and can be rolled over four times.
The new program powerfully signals that policymakers are pushing for property policy easing and measures to balance the supply-heavy housing market, which casts a dark cloud over the world’s second-largest economy. This announcement appears to be a step in the right direction in a national-level policy.
Also, on Friday, policymakers eased mortgage rules and removed the mortgage rate floors for first and second homes. PBoC also lowered the minimum downpayment ratio for first-time homebuyers to 15%. The downpayment ratio for second-home purchases was lowered to 25%.
Chinese Vice Premier He Lifeng said that authorities in cities with excess home inventories should purchase unsold properties and convert them into affordable housing. He also urged local governments to repurpose inactive land parcels held by property developers to alleviate their financial troubles.
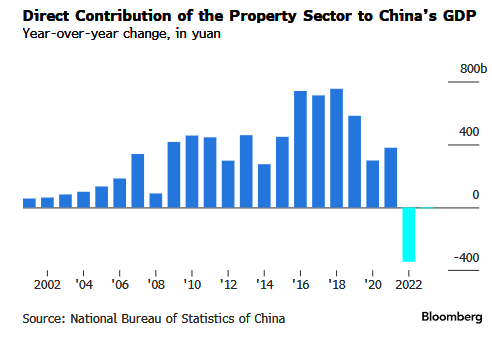
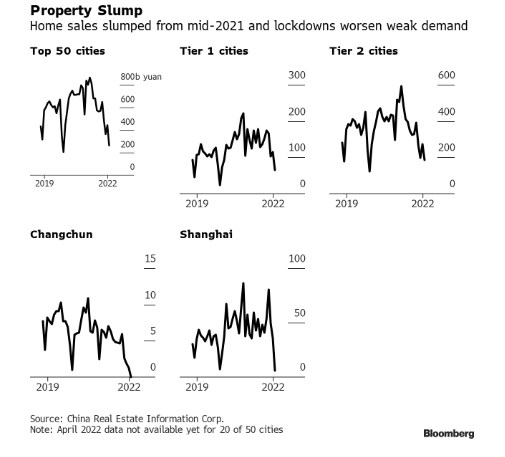
This was a very policy-heavy week to save the debt-stricken real estate market. Data showed that property investment and new home sales in April experienced larger contractions, while housing prices slid even further.
China’s ailing property sector is a drag on GDP.
Housing sales are tumbling.
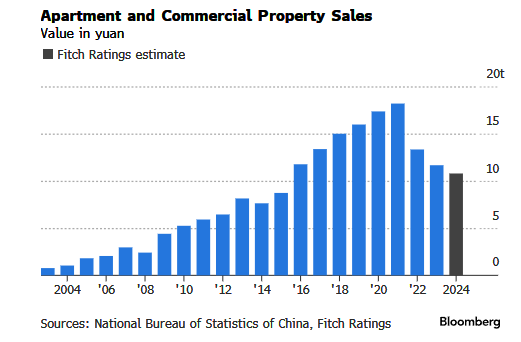
And apartment and commercial property sales are sliding.
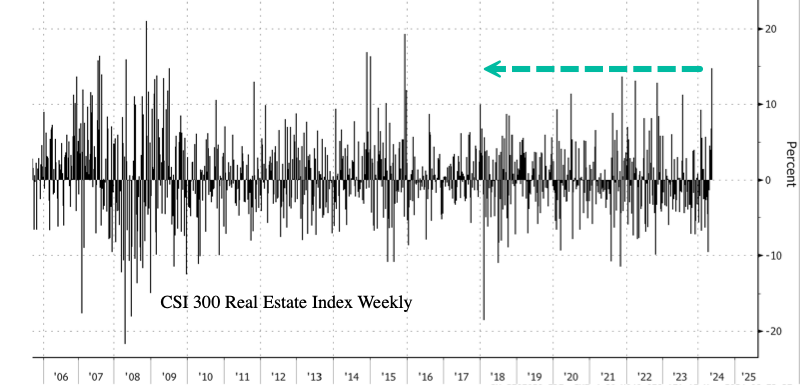
In markets, the CSI 300 Real Estate Index closed up 9%, with gains from April 24 totaling about 36%. Yet the latest gains in the property index are still 68% below the early 2018 peak.
The index’s weekly gain was the most since early December 2015.
It isn’t in a Communist countries’ DNA to let markets solve the problem … like letting prices correct no matter how painful that adjustment is. Biden and his “economic” advisor Jared Bernstein (not an economist but a public policy hack) would likely follow China’s idiotic solutions to the problem.
I debated Bernstein once at a Washington DC conference. He was arrogant but eventually confessed that he didn’t know anything about housing or mortgages. Nice economic advisor, Joe!
Housing in the US is simply unaffordable, particularly after HUD levied new regulation rising the cost of new housing up to $31,000. Wait for this to kick into the data for mortgage demand!
Mortgage applications decreased 2.3 percent from one week earlier, according to data from the Mortgage Bankers Association’s (MBA) Weekly Mortgage Applications Survey for the week ending April 26, 2024.
The Market Composite Index, a measure of mortgage loan application volume, decreased 2.3 percent on a seasonally adjusted basis from one week earlier. On an unadjusted basis, the Index decreased 1.4 percent compared with the previous week. The seasonally adjusted Purchase Index decreased 2 percent from one week earlier. The unadjusted Purchase Index decreased 1 percent compared with the previous week and was14 percent lower than the same week one year ago.
The Refinance Index decreased 3 percent from the previous week and was 1 percent lower than the same week one year ago.
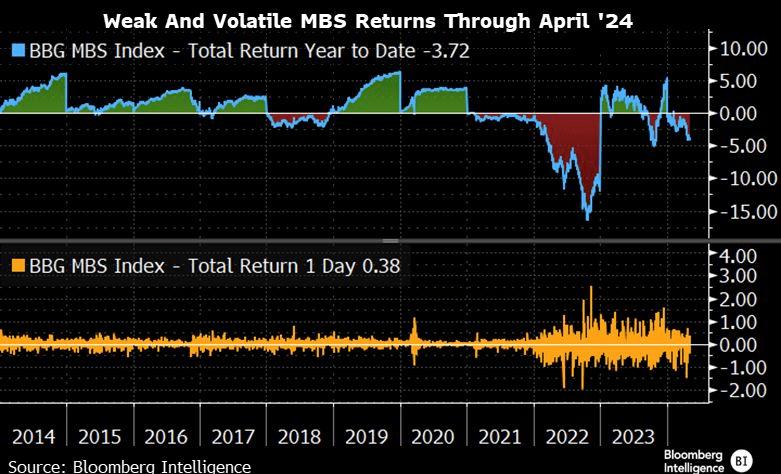
MBS returns are weak and volatile.
How is the Biden Regime making homeownership more affordable? They aren’t. The are using regulations, to drive the cost of new housing way up. New HUD energy rules will raise the cost of home construction by imposing stricter building codes. The National Association of Home Builders says the energy rules can add as much as $31,000 to the price of a new home. Payback time is 90 years (how long it will take the recoup the initial investment).
Under Biden’s “leadership” we are all addicted to gov. But at least Ukraine and Zelenskyy will be getting a guaranteed 10 years of financial support from the US … while E Palestine Ohio and Maui remain destroyed.
Janet Yellen, world class propagandist (US version of Baghdad Bob) and US Treasury Secretary under Biden, was so wrong about inflation. Instead of being “transitory”, turns out to be seemingly permanent.
Today’s Case-Shiller home price report was released for February. The National Home Price index was up 6.4% year-over-year. But look at the explosion of M2 Money and home prices. Hmm.
If we look at home prices and M2 Money on a year-over-year (YoY) basis, we can see the surge in money printing with COVID and the corresponding surge in home prices. As M2 Money growth slowed, the Case-Shiller National HPI slowed as well … until The Fed slowed the declined in M2 Money growth resulting in rising home price growth again.
So, The Fed will likely have to keep on printing. You can see Janet Yellen dancing to the thought of printing more money.
Mortgage applications increased 0.1 percent from one week earlier, according to data from the Mortgage Bankers Association’s (MBA) Weekly Mortgage Applications Survey for the week ending April 5, 2024.
The Market Composite Index, a measure of mortgage loan application volume, increased 0.1 percent on a seasonally adjusted basis from one week earlier. On an unadjusted basis, the Index increased 0.2 percent compared with the previous week. The seasonally adjusted Purchase Index decreased 5 percent from one week earlier. The unadjusted Purchase Index decreased 4 percent compared with the previous week and was 23 percent lower than the same week one year ago.
The Refinance Index increased 10 percent from the previous week and was 4 percent higher than the same week one year ago.
Joe Biden (aka, BeelzeBiden) is really a piece of … work. His policies are helping drive prices through the roof, he seeks to protect deepstate employees against removal by Trump, had a disastrous withdrawal from Afghanistan and is getting the US engaged in possible hot wars in Ukraine (against Russia), open borders allowing US crime to spike, seems to be suppoporting Hamas over our long-time ally Israel, the list goes on. Biden’s big push for electric cars is a Socialist fantasty and simply unrealistick, drives up energy costs and is EXPENSIVE. It is like Biden is the demon Beelzebub from the TV show “Supernatural.” I once referred to Washington DC as “Mordor on The Potomac.”
Throw in the Federal Reserve operating outside their mandate (excessive interference in the financial crisis of 2008, the excessive interfernce after the Covid outbreak in 2020) and the two together are destroying the US.
Look at housing prices (up 32.5% under Biden) against the purcchasing power of the US dollar (down -16.1% under Biden).
The problem has gotten so bad that Sedona, Arizona, recently set aside a parking lot exclusively for these homeless workers. The city is even installing toilets and showers for the new occupants.
Apparently, the City Council thought installing temporary utilities was cheaper than solving the area’s cost-of-living crisis.
And what a crisis it is.
The average home in the city sells for $930,000, while most of the housing available for rent is not apartments, but luxury homes targeted at wealthy people on vacation.
With such a shortage of middle-class housing and with starter homes essentially nonexistent, low- and even middle-income blue-collar workers have nowhere to go at night but their back seat.
Much like America’s Great Depression in the 1930s, this marks a serious regression in our national standard of living. But shantytowns were not prevalent in the 1920s (a decade that began with a depression) or the 1910s. Nor were they ubiquitous following the Panic of 1907, which set off one of the worst recessions in American history.
Indeed, Americans in the Great Depression faced such a cost-of-living crisis that many were forced to accept a standard of living below what their parents and even their grandparents had.
Fast-forward about 90 years, and countless families are in the same boat. Many young people today don’t think they’ll ever be able to achieve the American dream of homeownership that their parents and grandparents achieved. The worst inflation in 40 years, rising interest rates, and a collapse of real (inflation-adjusted) earnings mean a huge step backward financially.
That inflation has pushed up rents so much that young Americans are moving back in with their parents at rates not seen since the Great Depression because they can’t make it on their own. Sometimes, they can’t even make it with multiple roommates.
But many people cannot move back in with family, so the car it is.
The housing problem is not limited to wealthy towns in Arizona, however. It is systemic. The monthly mortgage payment on a median-price home has doubled since January 2021, and rents are at record highs. Like the Great Depression, this disaster stems from impolitic public policy.
For the past several years, the government has spent, borrowed, and created trillions of dollars it didn’t have. The predictable result of this profligacy was runaway inflation, followed by equally foreseeable interest rate increases.
The deadly combination of high prices and high interest rates has frozen the housing market and reduced homeownership affordability metrics to near-record lows. In several major metropolitan areas, it takes more than 100 percent of the median household after-tax income to afford a median-price home.
Since rents and virtually all other prices have risen so much faster than incomes over the past three years, even renting is unaffordable today, so many people have to go into debt to keep a roof over their heads. And for some, that’s a car roof.
This is the kind of story you might expect from a Third World country or somewhere behind the Iron Curtain during the Cold War, not the largest economy in the world—at least not outside of a depression like the one in the 1930s.
Hoover certainly deserved some blame for the Great Depression, but so did the progressives in Congress, who came from both parties and repeatedly voted to meddle in the economy instead of allowing it to recover from the initial downturn.
Similarly, President Joe Biden deserves blame for constantly advocating runaway government spending. (Runaway Joe??)
But today’s multitrillion-dollar deficits are also made possible by the big spenders in Congress, who come from both parties.
If this bipartisan prodigality of Washington continues, Bidenvilles will only become more widespread as the housing affordability crisis worsens.
Biden’s official White House portrait.
Washington DC under Biden and Schumer, Pelosi, etc.
Like last month, today’s jobs report for March is better than Februrary’s miracle report, but has some glaring bad news that the Administration and slobbering media will ignore. Now you know why I no longer appear on CNBC, CNN or Fox Business anymore.
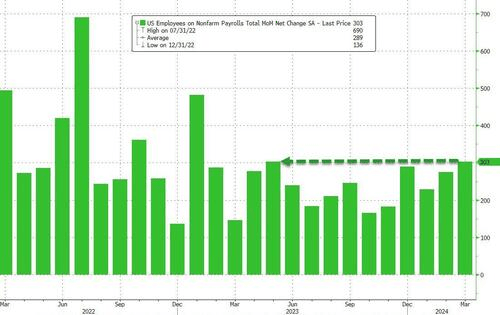
Let’s start with the good news! The BLS reported that in March, the US added a whopping 303K jobs, tied for the highest since Jan 2023!
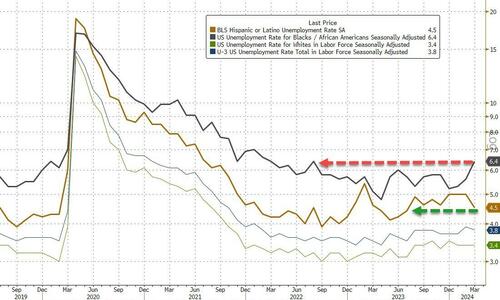
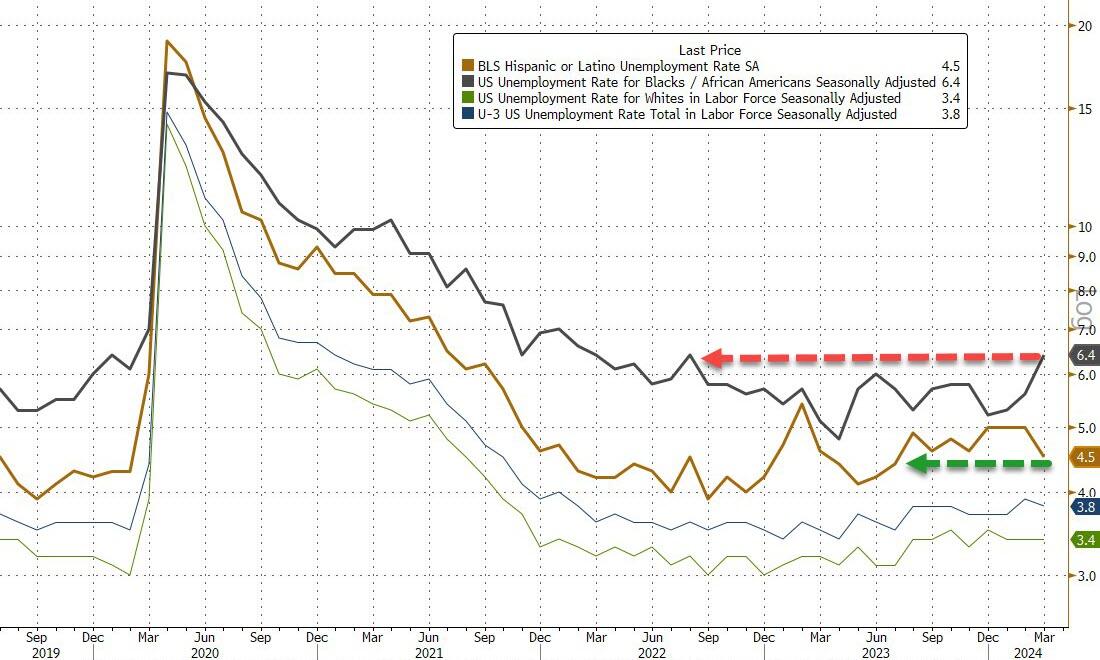
Turning our attention to the unemployment rate, it unexpectedly dipped again, dropping to 3.8%, from 3.9%, in line with estimates, as the number of unemployed workers dipped modestly from 6.458 million to 6.429 million while the number of employed workers rose by almost half a million workers; the unemployment rate for Blacks (6.4 percent) increased in March to the highest level in almost two years, while the rates for Asians (2.5 percent) and Hispanics (4.5 percent) decreased. The jobless rates for adult men (3.3 percent), adult women (3.6 percent), teenagers (12.6 percent), and Whites (3.4 percent) showed little or no change over the month.
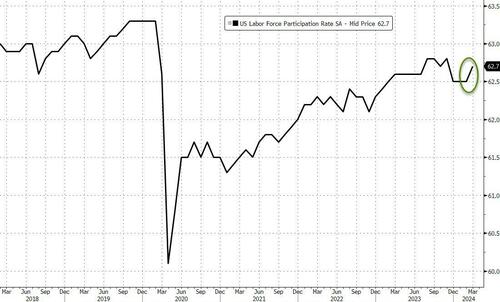
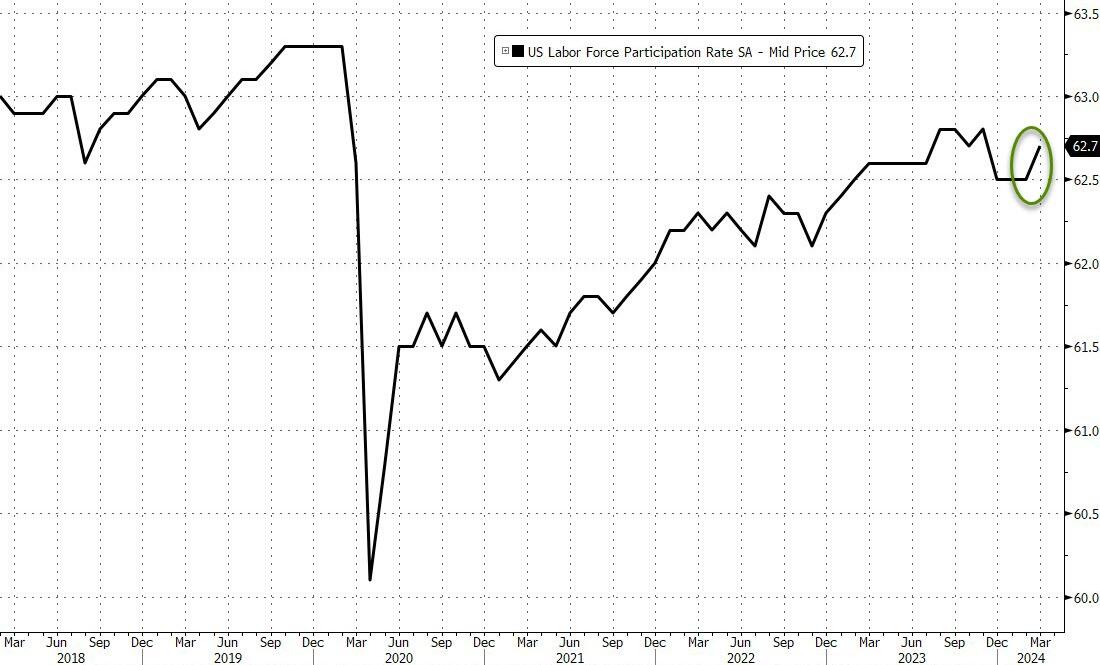
In contrast, the participation rate rose from 62.5% to 62.7%, above the 62.6% expected, as the overall civilian labor force increased slightly less than the number of employed people.
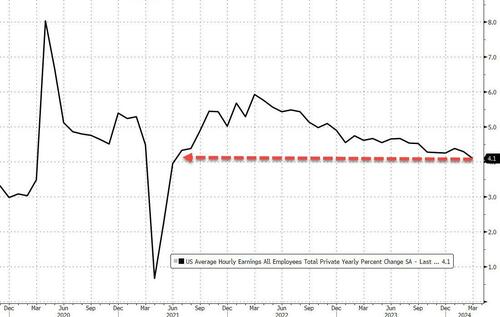
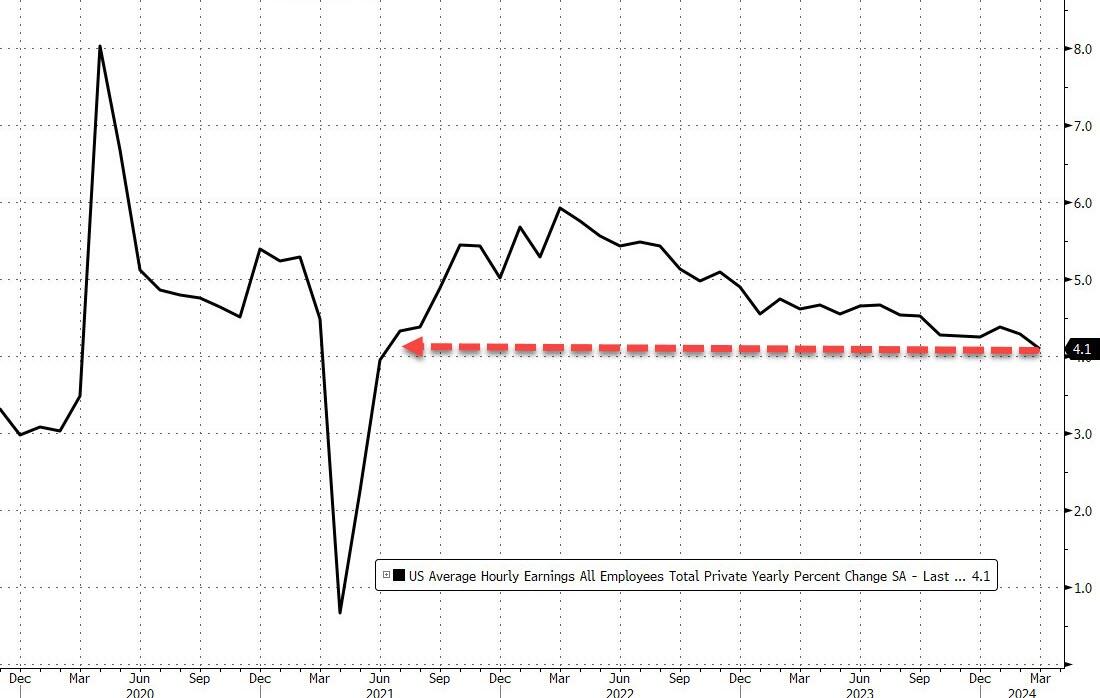
Now for the not-so-good news. The average hourly earnings came in as expected, rising 0.3% MoM, up from last month’s upward revised 0.2% sequential increase (revised from 0.1%), On an annual basis, the hourly earnings rose 4.1%, as expected, and down from 4.3%. This was the lowest print in almost three years: the last time wages rose by this much was the summer of 2021.
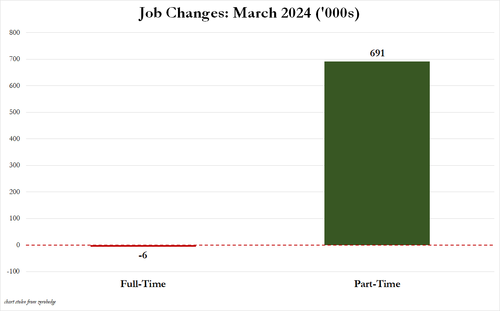
Now for the bad news.
For those wondering if the jobs were all part-time, the answer is a resounding yes: in March, full-time jobs dropped by 6,000 as Part-time jobs soared by 691,000.
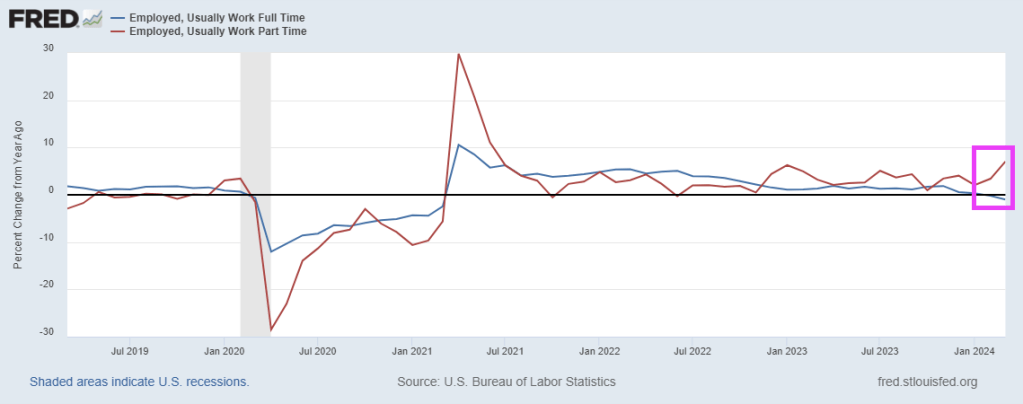
On a year-over-year (YoY) basis, full-time jobs were down -1.0% while part-time jobs were up 7.1%
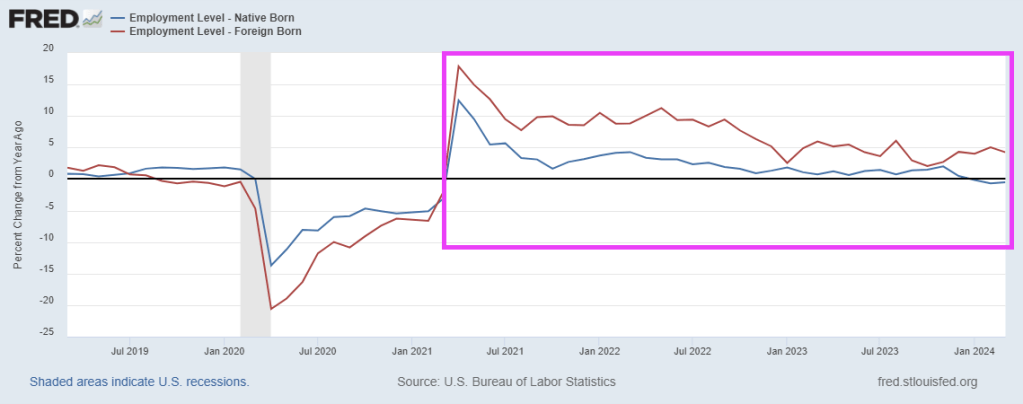
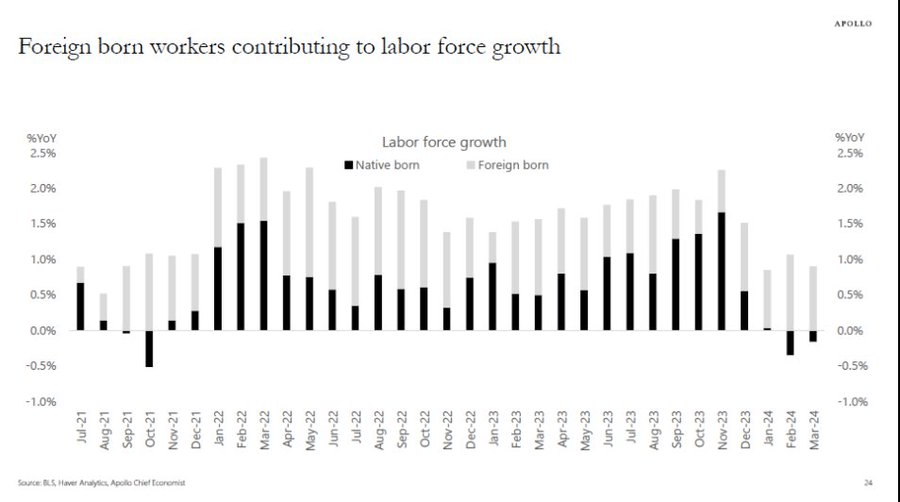
Native-born versus foreign born? On a YoY basis, native-born employment was down -0.5% while foreign-born employment increased by 4.2%.
Not only is Biden importing Democrat voters (since 70% of Americans HATE Biden’s policies), they are also displacing native-born Americans in the labor force.
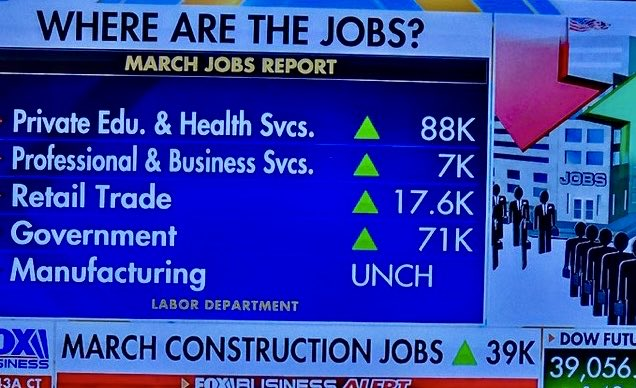
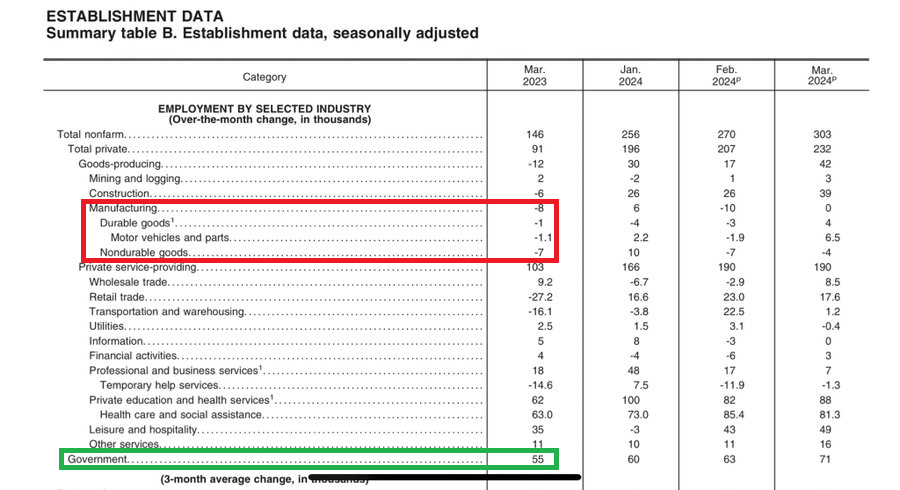
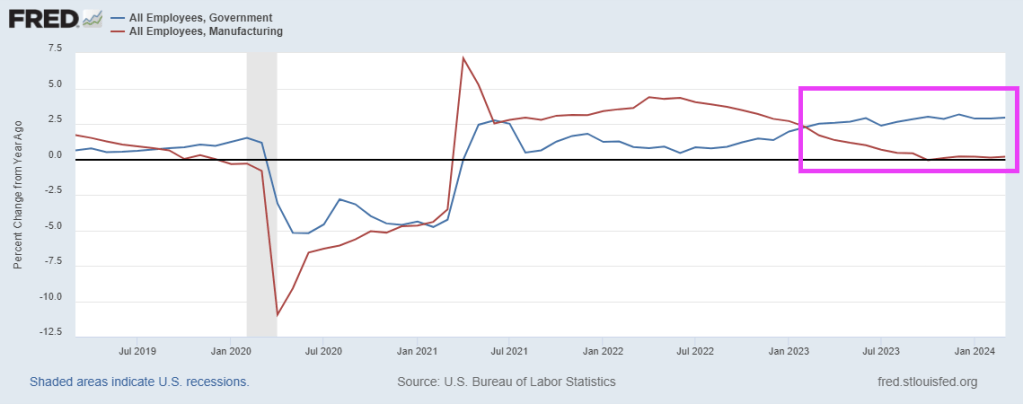
Manufacturing jobs added were ZERO. So, much for all of Biden’s claims. But NON-PRODUCTIVE government jobs were up 71,000. So our manufacturing jobs are dead while non-productive government jobs are growing like crazy.
Under Biden, the Administrative state is growing faster than manufacturing since Feb 2023. The Biden Administration implements new rules to prevent Trump’s ability to purge deep state employees if re-elected in 2024.
How will The Fed respond? Likely will lead to limited rate cuts.


You must be logged in to post a comment.