Bank of Japan Stops Printing Money, Will The Fed Follow? (US Misery Index Above 10%, Housing Misery Rate At All-time High)

My Kuroda!

金融政策に限界があるとは考えておりません 
(I do not believe that there is a limit to the effect of monetary policy.)

Haruhiko Kuroda, Bank of Japan, 13 April 2016

The Bank of Japan is one of the top three Quantitative Easing (QE) Monsters in terms of the absolute amount of assets it purchased. The Fed and the ECB round out the trio. The BoJ started QE over 20 years ago, and went hog wild under Abenomics, which became the economic religion of Japan in 2013. But the era of Prime Minister Shinzo Abe ended in September 2020, and Abenomics is now finished.

What’s left of it is that the BoJ (and Bank of Japan Governor Haruhiko Kuroda) now holds about half of the huge pile of the central government’s debt. With their target rate at -0.10% and a gargantuan balance sheet, what could go wrong?

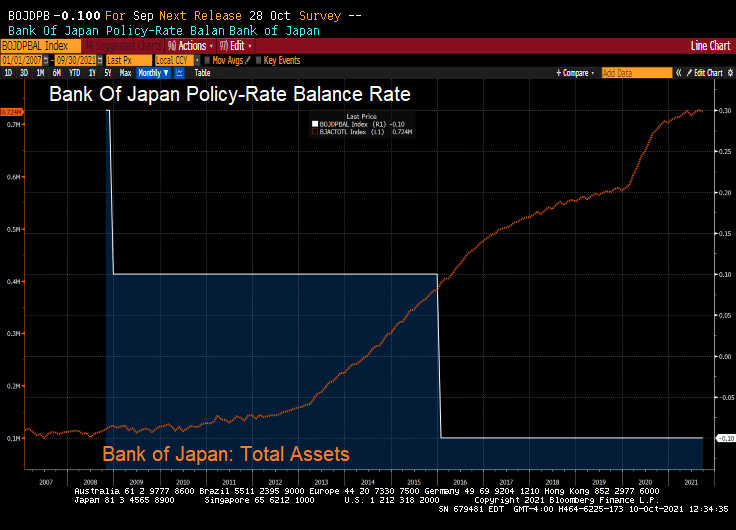
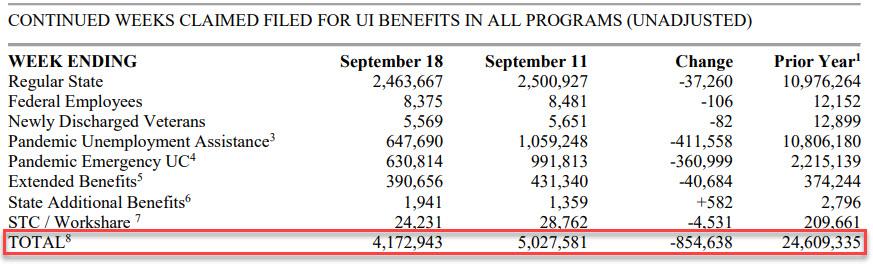
But BOJ’s QE has ended. The BoJ’s overall assets stopped growing, and its holdings of government bonds have started to decline.

As of the BoJ’s balance sheet dated September 30, released on Thursday, total assets declined to a still monstrous ¥724 trillion ($6.4 trillion), below where it had been in May 2021.

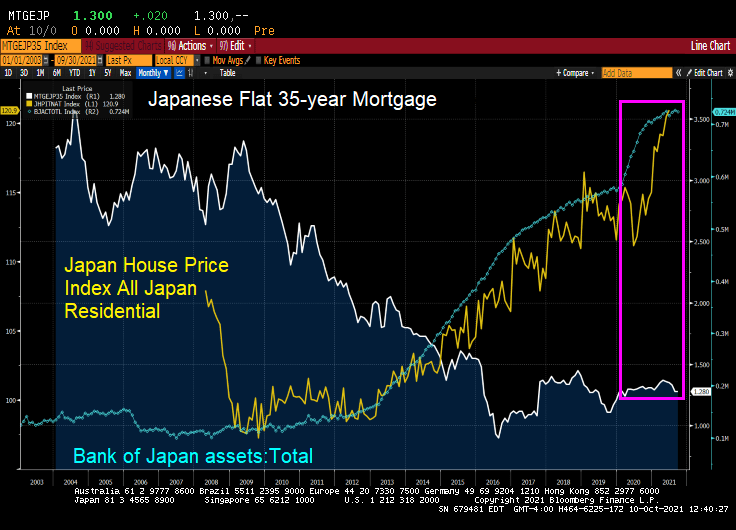
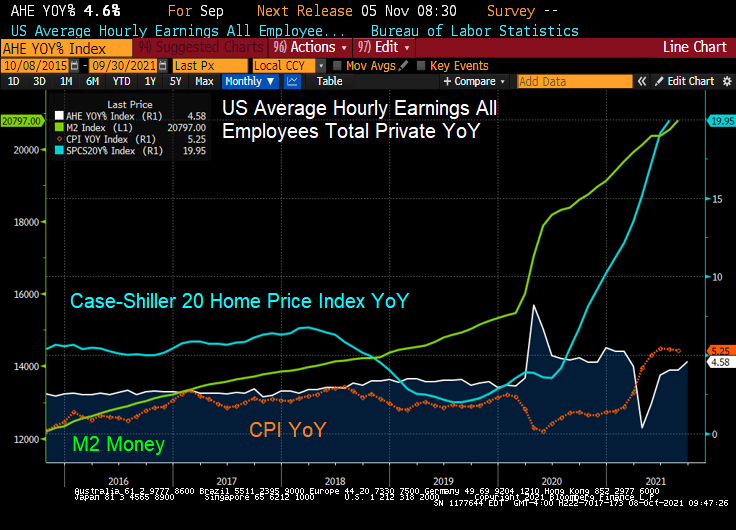
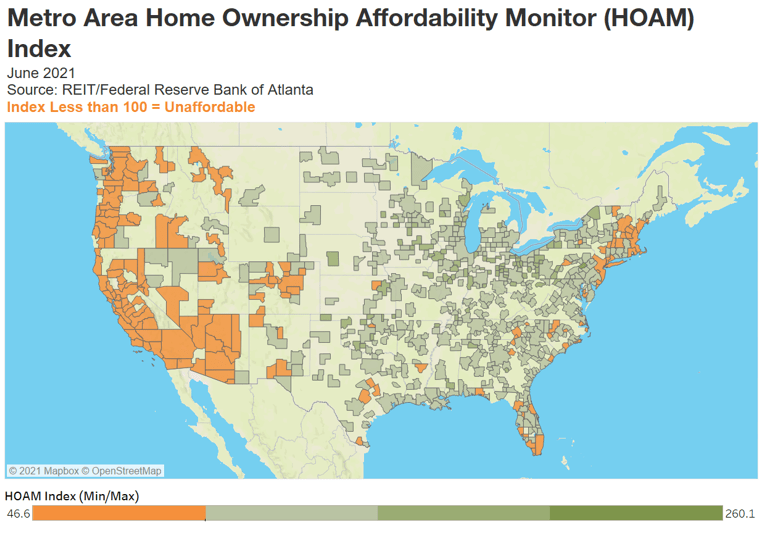
But look at Japanese home prices with the growth of the BOJ’s balance sheet and general decline in mortgage rates. Like the USA, there was a balance sheet spike associated with Covid and a resulting spike in home prices.

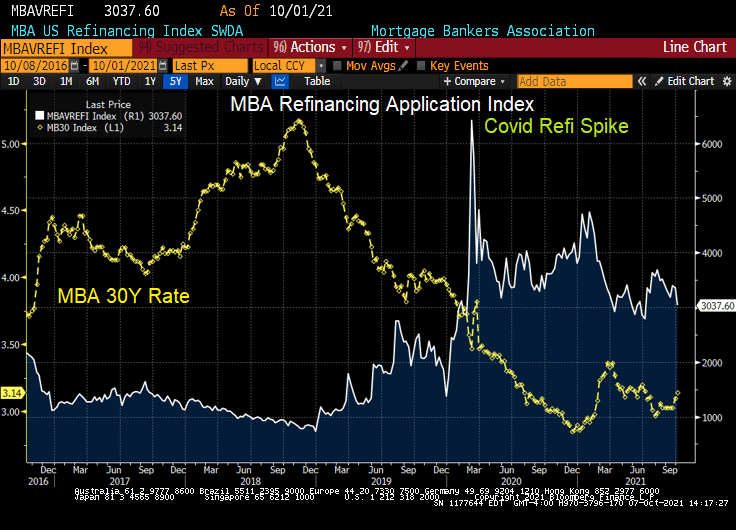
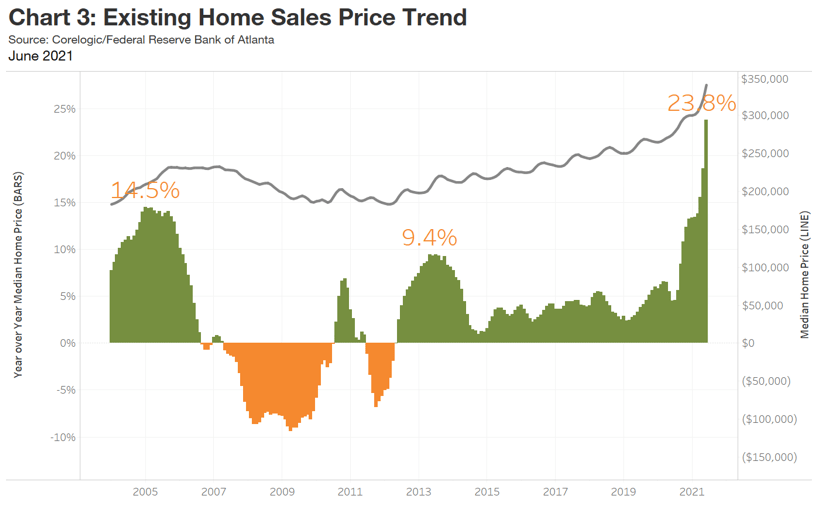
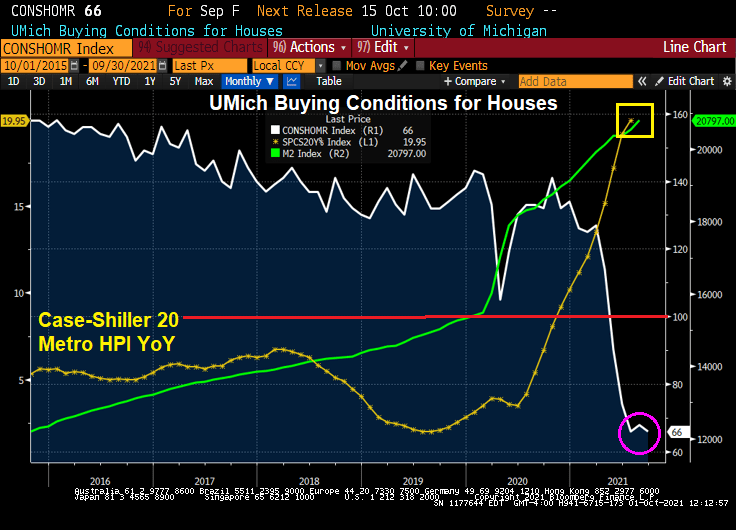
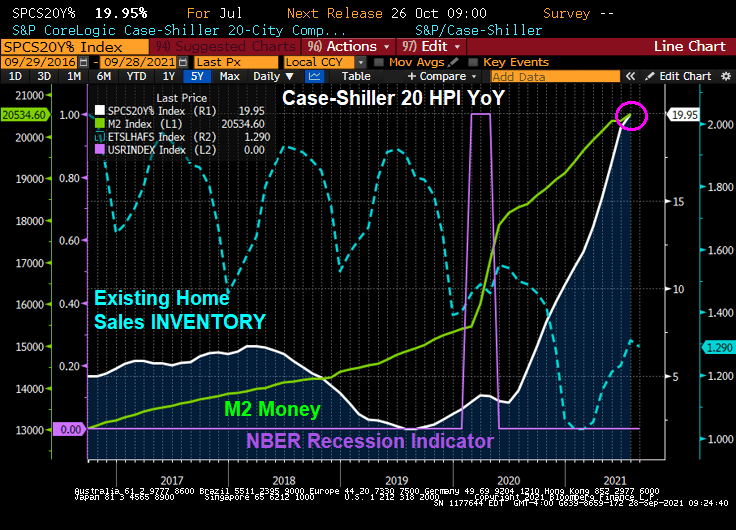
The USA? We also saw a surge in home prices following The Fed’s monetary “stimulypto.”

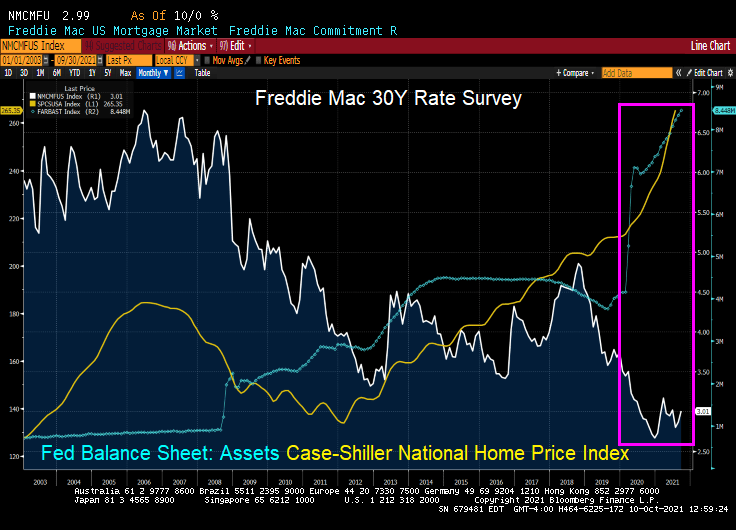
But will The Fed follow BOJ’s lead and stop asset purchases? Not yet, anyway. It seems that The Fed can’t turn market forces loose and let interest rates rise.

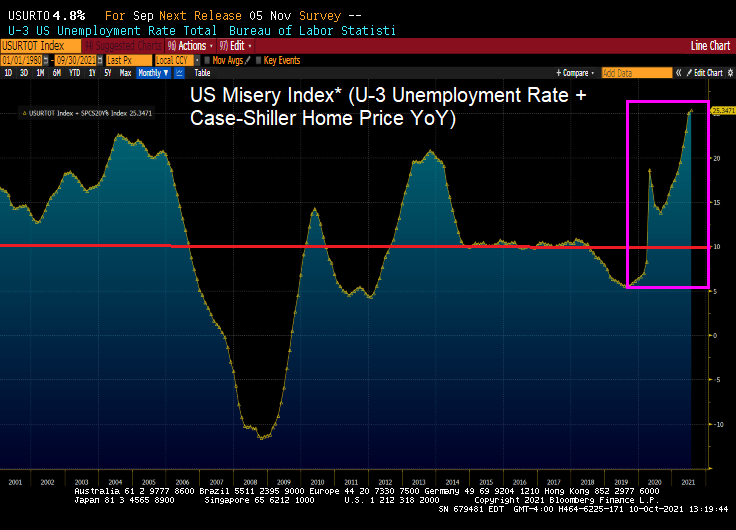
Bear in my that the US Misery Index is above 10% (U-3 unemployment + inflation).

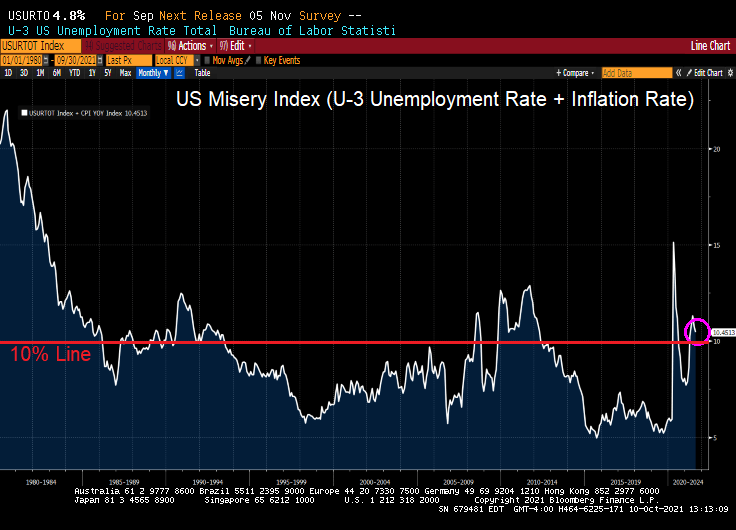
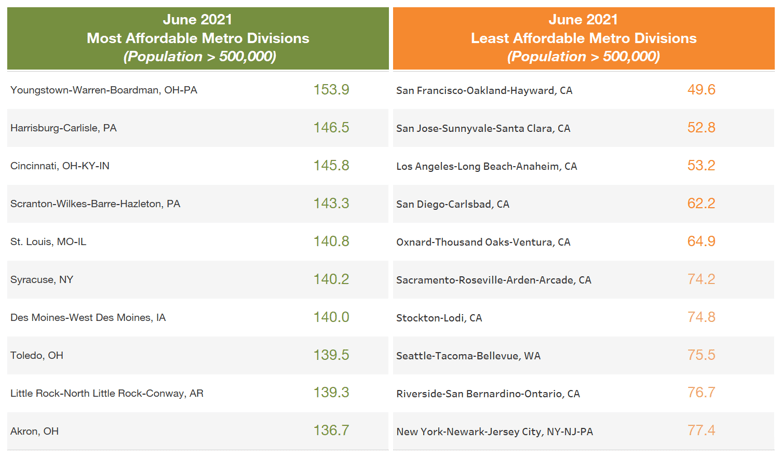
And if I define the US Misery Index as U-3 unemployment + home price growth, we can see we are at record misery rates. Miserable for households that don’t own a home or are trying to move to a higher housing price area).

What I like about The Fed’s monetary policies?? Nada.

Just 194K Jobs Added In September Versus 500K Expected, Unemployment Rate Falls, Wages Rise (Mighty Biden Strikes Out)


Like the poem, Casey At The Bat, the US economy struck out with a shockingly bad jobs report for September.

Oh, somewhere in this favored land the sun is shining bright;
The band is playing somewhere, and somewhere hearts are light,
And somewhere men are laughing, and somewhere children shout;
But there is no joy in Mudville USA—mighty Casey Biden has struck out.

The U.S. economy added fewer jobs than forecast for a second straight month in September. Nonfarm payrolls increased by just 194,000 last month after an upwardly revised 366,000 gain in August, Labor Department figures showed Friday. 500K was expected.

The U-3 unemployment rate declined to 4.8% (meaning that the labor force shrank due to people dropping out of the labor force). In fact, 338,000 people dropped out of the labor force.

Average hourly earnings YoY rose to 4.6%. While that is an improvement, but it is lower than the inflation rate of 5.25% YoY and house price inflation of 20% YoY.

This miserable jobs report is a victory for Fed doves that don’t want to raise rates or slow down the balance sheet growth.

Where were the jobs created? Leisure and hospitality, as usual, leads in job gains.

Mighty Biden’s economic policies have struck out. Good night, Irene.

Alarm! Big Short Resurfaces in U.S. Bonds, Wary of ‘Convexity Trigger’

Alarm!

It was great to be a “Master of the Universe” (Treasury and MBS trader) since October 1981 when the US 10Y Treasury yield peaked at 15.84% and mortgage rates peaked at 18.63%. Treasury and mortgage rates have generally fallen ever since. But what happens if Treasury and mortgage rates rise?

Bond investors are piling back into short positions, motivated not only by the specter of inflation but also by the risk that yields are approaching levels that will unleash a wave of new selling by convexity hedgers. 

That level is around 1.60% in the U.S. 10-year Treasury yield, less than 10 basis points from its current mark, according to Brean Capital’s head of fixed income strategy, Scott Buchta. It’s the mid-point of “a key threshold” between 1.40% to 1.80%, an area “most critical from a convexity hedging point of view.”

Convexity hedging involves shedding U.S. interest-rate risk to protect the value of mortgage-backed securities as yields rise, slowing expected prepayment rates.

It’s already begun to pick up as yields stretched past the 1.40% level. Another wave is expected at around 1.6% — a point of “maximum negative convexity” in agency MBS, “where 25bp rallies and sell-offs should have an equal effect on convexity-related buying and selling,” Buchta says. 

Signs that short positions are accumulating include Societe Generale’s “Trend Indicator.” Among its 10 newest trades are short positions in Japanese 10-year debt, German 5-year debt futures, U.K. 10-year gilts, U.K. short sterling and U.S. 2- and 5-year notes. Meanwhile, CFTC positioning data for U.S. Treasury futures show asset managers flipped to net short in 10-year note contracts in the process of dumping the equivalent of $23 million per basis point of cash Treasuries over the past week. Hedge-fund shorts also remain elevated in the long-end of the curve, as measured by net positions in Bond and Ultra Bond futures. 

“Bond-bearish impulses remain in place,” says Citigroup Inc. strategist Bill O’Donnell in a note, citing tactical and medium-term set-ups. Traders should be aware of short-covering rallies in the meantime, however, he says. 

“Potentially extreme short-term positioning and sentiment set-ups could easily allow for a counter-trend correction under the right conditions,” he said.

U.S. 10-year yields topped at 1.57% this week, the cheapest level since June, spurring the breakeven inflation rate for 10-year TIPS to 2.51%, the highest since May. Friday’s September jobs report could add fuel to this inflationary fire, rewarding bond shorts. 

Here is a chart of the rising 10Y Treasury yield against The Fed’s 5Y forward breakeven rate.

Here is a Fannie Mae 3% coupon MBS. Note the rise in Modified Duration with an increase in interest rates.

Convexity for the FNMA 3% MBS?

There is something on the wing. Some-thing.

Jobless Claims Fall To 4.2 Million, Down 20 Million From A Year Ago, As Pandemic Benefits End

Initial jobless claims dropped below their recent range last week, falling to the second lowest level since the COVID-lockdowns crushed the economy. Only 326k Americans filed for jobless benefits for the first time last week, down from 364k last week and below the 348k expectation.

The massive Covid stimulus for employment has worn out. Note the decline in Pandemic Unemployment Insurance and Pandemic Emergency Claims. The thrill is gone … of pandemic unemployment benefits.

Continuing claims also declined from the previous week, again largely from Pandemic Unemployment Assistance and Pandemic Emergency Claims programs ending.

On a related note, Challenger job cuts were down -84.9% YoY. But for September, there was a surge in low-paying retail jobs and transportation jobs as Panademic stimulus ran out and governments have pretty much stopped their destructive government shutdowns of economies.

So this is where all the Pandemic claimants have gone?


Bizarro World! 1-month T-bill Yield Lower Than 1-year T-bill Yield (U.S. Faces A Recession If Congress Doesn’t Address The Debt Limit Within 2 Weeks, Yellin’ Yellen says)

Treasury Secretary Janet “Go big or go home” Yellen is beating the hysteria drum by saying that the US faces a recession if Congress doesn’t increase the debt ceiling.

Well, Janet, we are headed there anyway with GDP crashing to a measly 1.33%.

The fear of not approving a debt ceiling increase (laughable since Democrats can do it on their own) has caused there to be a “little dipper” in the US Treasury actives curve. Meaning that the 1-month T-bill yield is higher than the 1-year T-bill yield.

How bizarre is this getting?

US Real GDP Plummets To 1.33% As Fed Continues To Help Inflate Prices (Baltic Dry Shipping Price Index Soars!)

The Atlanta Fed’s real-time GDP tracker fell … again … to 1.33% as The Federal Reserve continues its bizarre monetary stimulus.

The culprits? Declining auto sales, manufacturing, etc.

I have discussed soaring prices since Biden’s election (food, energy, housing, rent, etc). But another soaring price component is shipping costs. Up 315% since mid-February.

While Trump’s slogan was “Make American Great Again”, Biden and The Fed’s slogan should be “Make America Far More Expensive For The Middle Class.” But that won’t fit on a bumper sticker.

And Biden/Democrats now want to RAISE taxes!

Median-Income Buyers Priced Out Of Housing Market With Fed Stimulus (Why Won’t The Fed Stop?)

The Atlanta Fed has interesting research paper on the housing market.

Key points

  • The national HOAM index stood at 92.2 in June, its lowest level since 2008.
  • National housing affordability fell 11.9 percent in June, the sharpest drop since 2014.
  • Home sale prices were up 23.8 percent over the past year.
  • On average, a median-income household would need to spend 32.6 percent of its annual earnings to own a median-priced home.
  • Although demand for housing remains strong, steadily declining affordability is beginning to affect buying decisions.

The latest reading of an Atlanta Fed measure and US housing trends show home ownership is becoming out of reach for many buyers and resistance to higher prices is building. More than 80 percent of US metro areas had a drop in affordability.

Where is housing most and least affordable?

ddd

Of course, the one chart that The Fed never includes is home price growth and Fed monetary policy.

So, if The Fed is so concerned with median-income households being priced out of housing markets, why are the still sticking with their unorthodox monetary policies?

Consumer Sentiment For Housing Falls Due To Skyrocketing Home Prices (Consumers Get Powell’d!)

I have a new term for consumers that get beaten-up by The Fed’s massive distortion of markets. I call this being “Powell’d”.

The latest example of consumers getting Powell’d is in the University of Michigan consumer survey. Buying conditions for housing just fell to the lowest level since 1982.

Foul Powell on the prowl.

Dracula’s enemy Harker says that he sees rate hike in late 2022 or early 2023.

“I am in the camp that believes it will soon be time to begin slowly and methodically — frankly, boringly — tapering our $120 billion in monthly purchases of Treasury bills and mortgage-backed securities.”

Here is a photo of Harker with Fed Chair Powell.

US GDP Price Index Highest Since 1981 As Q2 GDP Revised To 6.7% (Thanks For The Stimulus!)

Thanks for the stimulus! Or thanks for the Covid virus that enabled The Fed and DC to go crazy with low rates and spending.

While US GDP printed at a revised 6.7% QoQ (annualized), it is the GDP PRICE Index that bears looking at. It rose 6.1%, the fastest rate since 1981.

At least GDP was revised upwards to 6.7% QoQ, thanks to unpredented monetary and fiscal stimulus.

Stimulypto! U.S. Rents Are Increasing at ‘Shocking’ Rates of More Than 11.5% (Newly-signed Leases Rose 17%)

So much for the transitory inflation that The Federal Reserve keeps spouting on about.

(Bloomberg) — The pace of rent increases is heating up in the U.S.

Rent data for the past two months show no sign yet of the usual seasonal dip at this time of year, following peaks early in the summer, when many lease renewals come due.

A Zillow Group Inc. index based on the mean of listed rents rose 11.5% in August from a year earlier, with some cities in Florida, Georgia and Washington state seeing increases of more than 25%. 

Since the start of the pandemic, the median rent for a two-bedroom apartment has soared 13.1% to $1,663, Zumper data show

But rent on newly-signed leases rose 17% from the previous tenant’s lease.

For the New York market, landlords are raising rent prices as much as 70% now that people are flooding back into the city as offices and entertainment venues open up. In July, the median asking rent in New York City surged to $3,000, compared with the pandemic low of $2,750 in January 2021, data from StreetEasy showed.

Of course, rent surge is not surprising given that home prices have surged since Covid given limited inventory and massive Fed stimulus.

Perhaps if The Fed and Federales (Federal government) start reducing their apocalyptic-level stimulus, THEN we will see inflation as transitory.