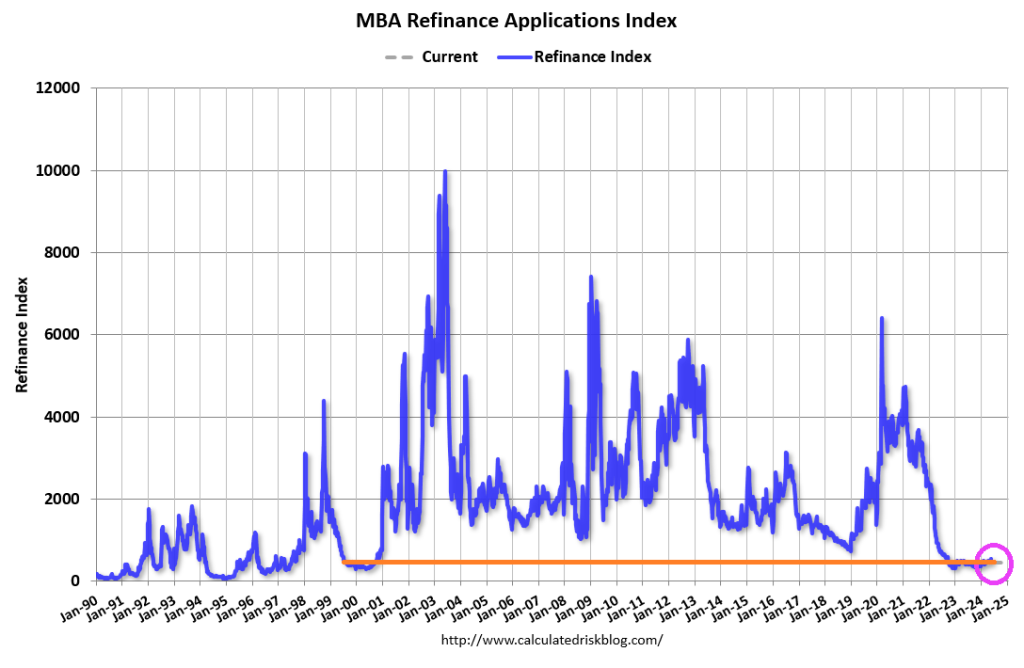
Well, it was the first week of June. Mortgage applications usually peak in May, so we are on the historic “dark side of the moon” for mortgage demand.
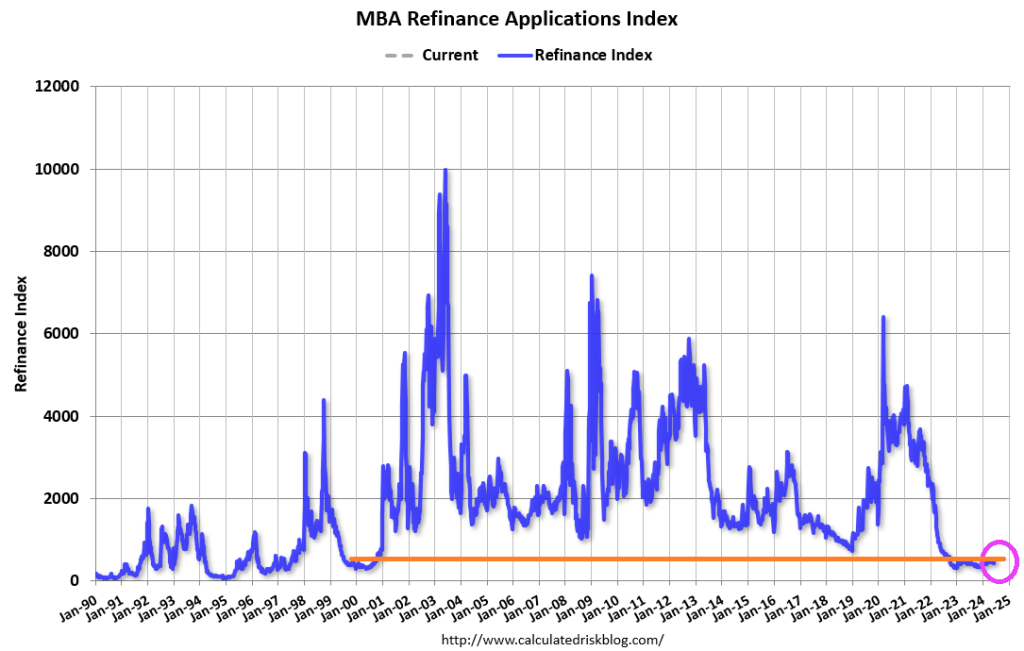
Mortgage applications increased 15.6 percent from one week earlier, according to data from the Mortgage Bankers Association’s (MBA) Weekly Applications Survey for the week ending June 7, 2024.
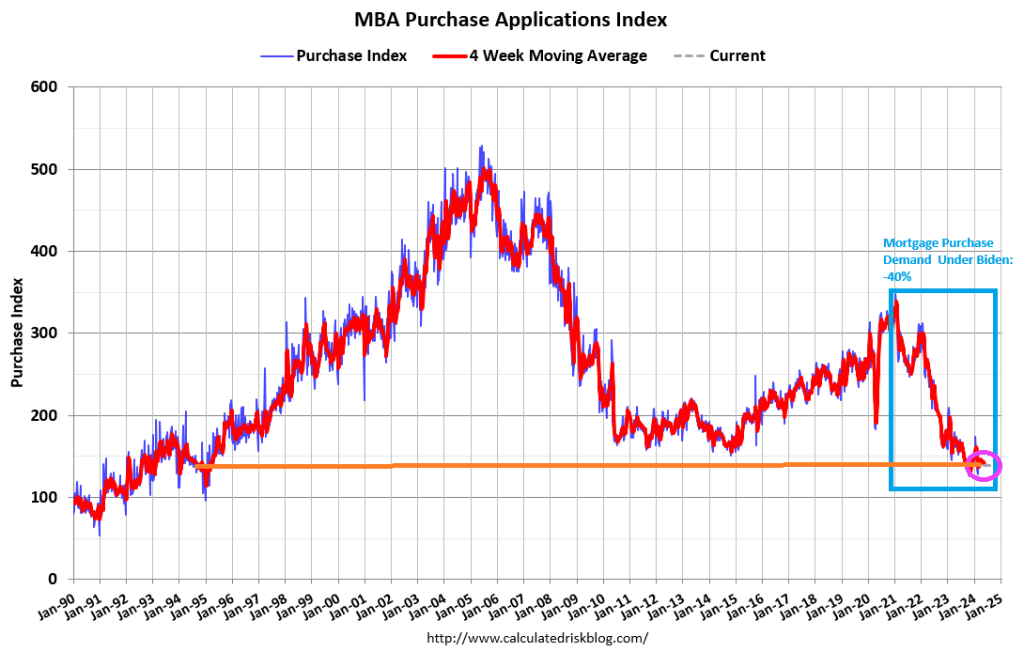
The Market Composite Index, a measure of mortgage loan application volume, increased 15.6 percent on a seasonally adjusted basis from one week earlier. On an unadjusted basis, the Index increased 26 percent compared with the previous week. The seasonally adjusted Purchase Index increased 9 percent from one week earlier. The unadjusted Purchase Index increased 19 percent compared with the previous week and was12 percent lower than the same week one year ago.
Beware of getting too excited about the19% WoW increase. It is 19% off an extremely low number.
The Refinance Index increased 28 percent from the previous week and was 28 percent higher than the same week one year ago.
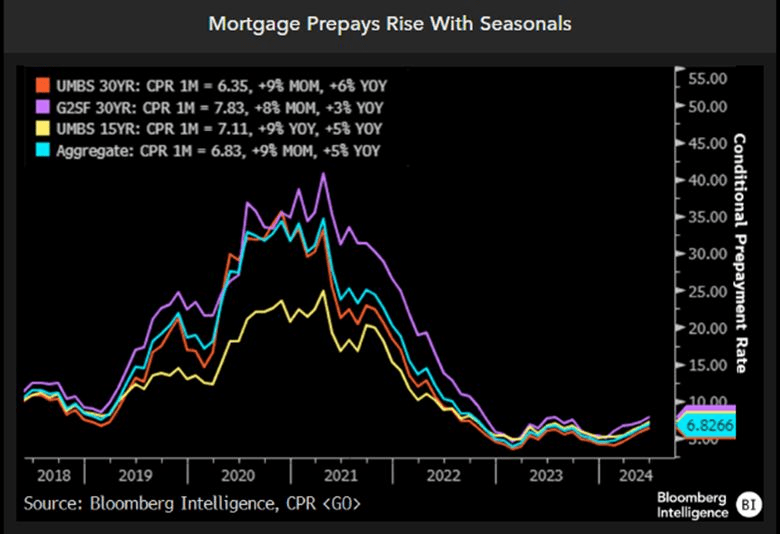
This charts sums up the seasonal component to prepays.
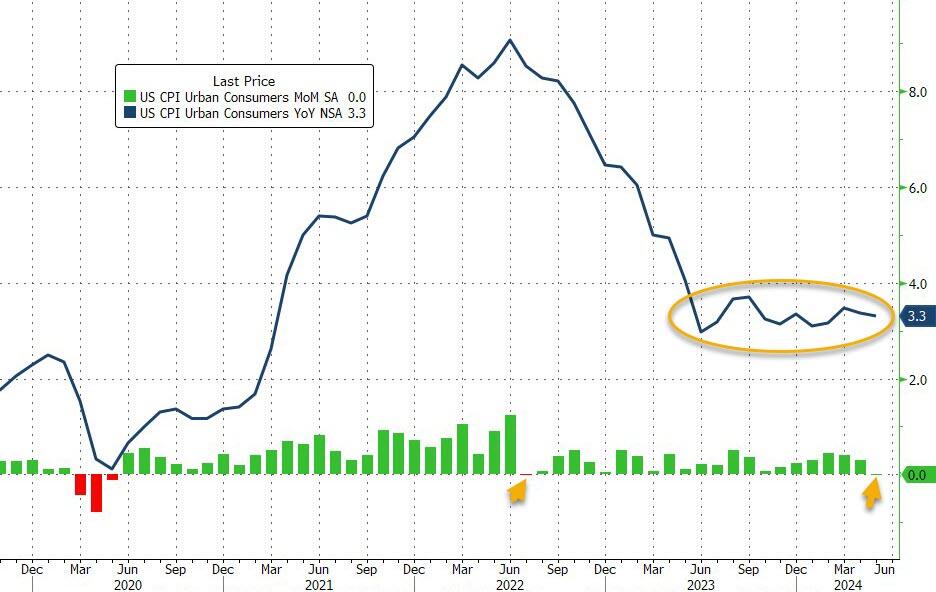
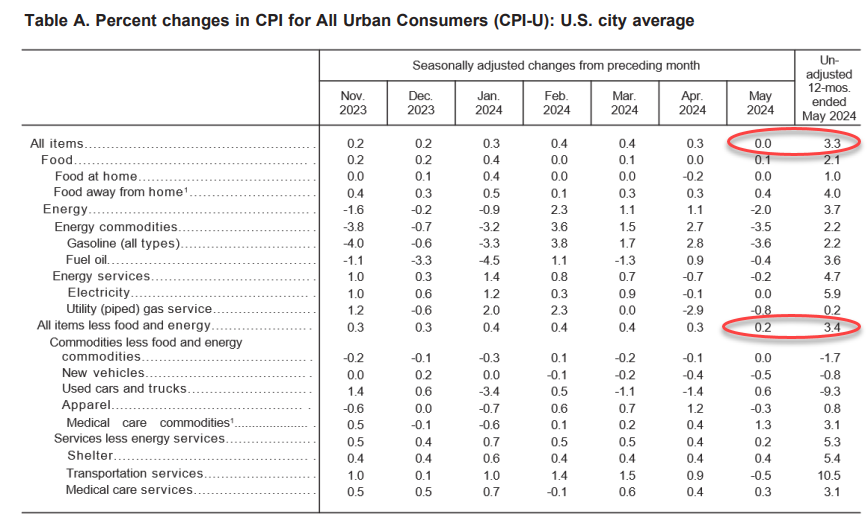
Energy was the biggest drag on the headline CPI MoM…(Gasoline prices tumbled 3.6% in May from April, one key reason why the headline CPI was flat on the month. )
Source: Bloomberg
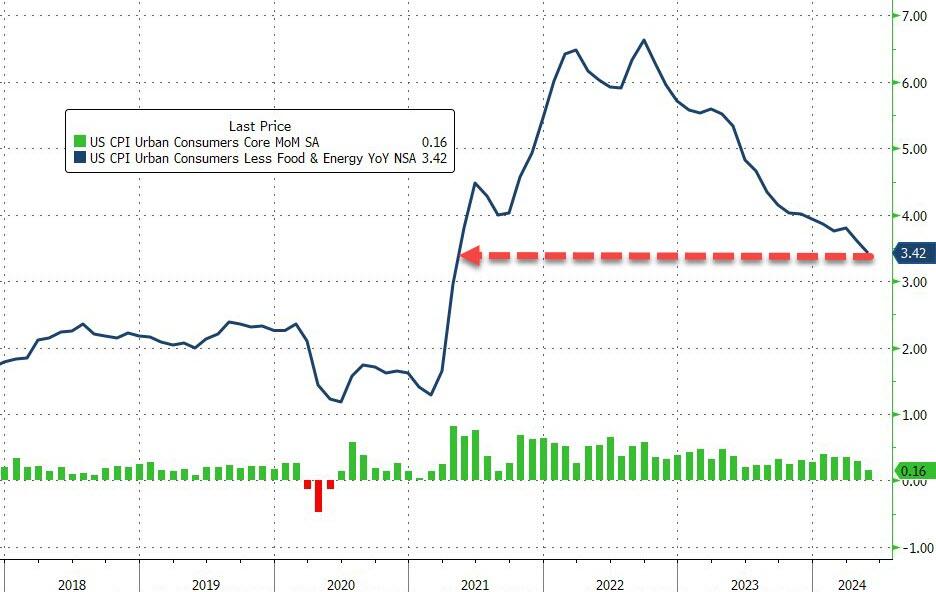
Core CPI rose 0.2% MoM (below the 0.3% exp) pulling the YoY change down to 3.4% (from 3.6% and below the 3.5% exp). That is the lowest Core CPI YoY since April 2021…
Source: Bloomberg
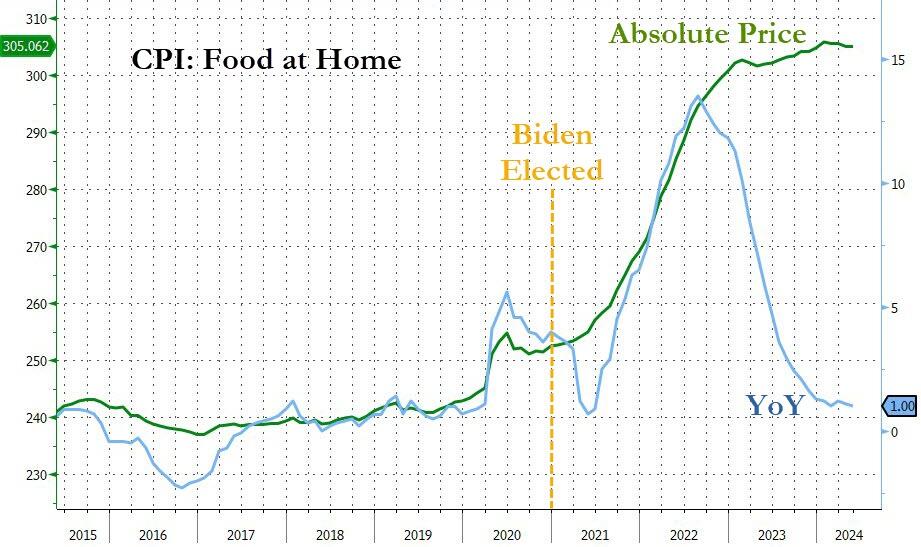
Core CPI has not had a down-month since President Biden was elected.
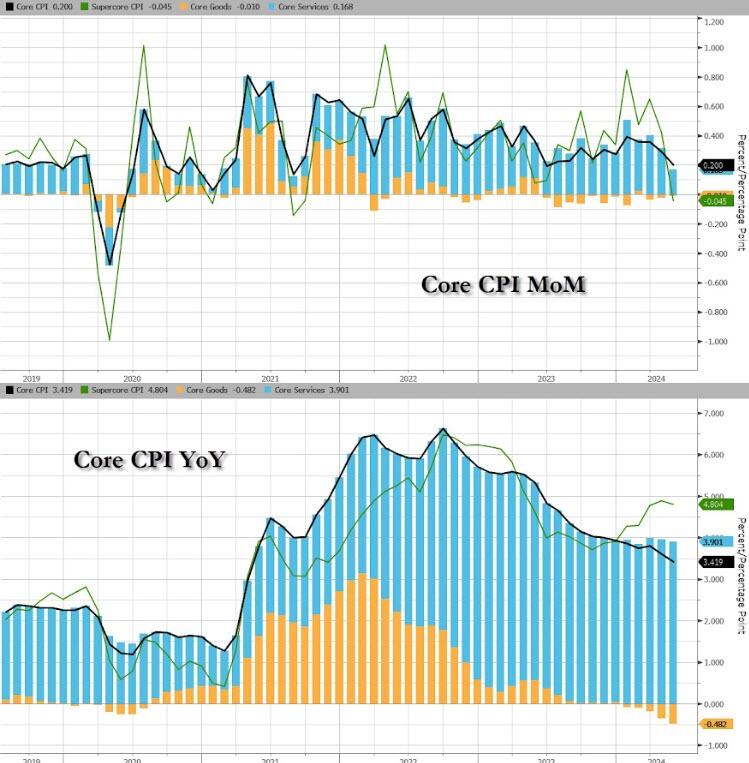
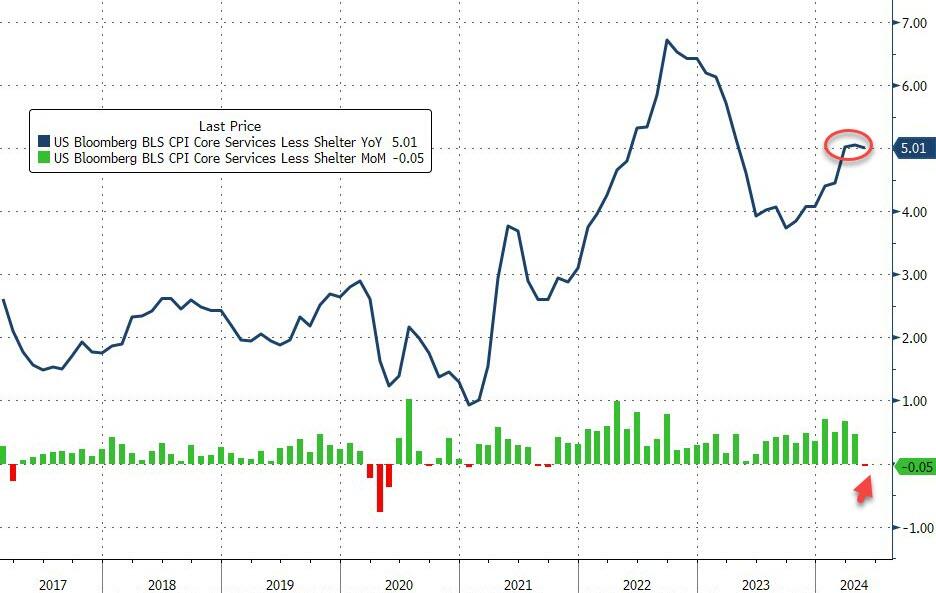
Core Services inflation slowed notably MoM…
Source: Bloomberg
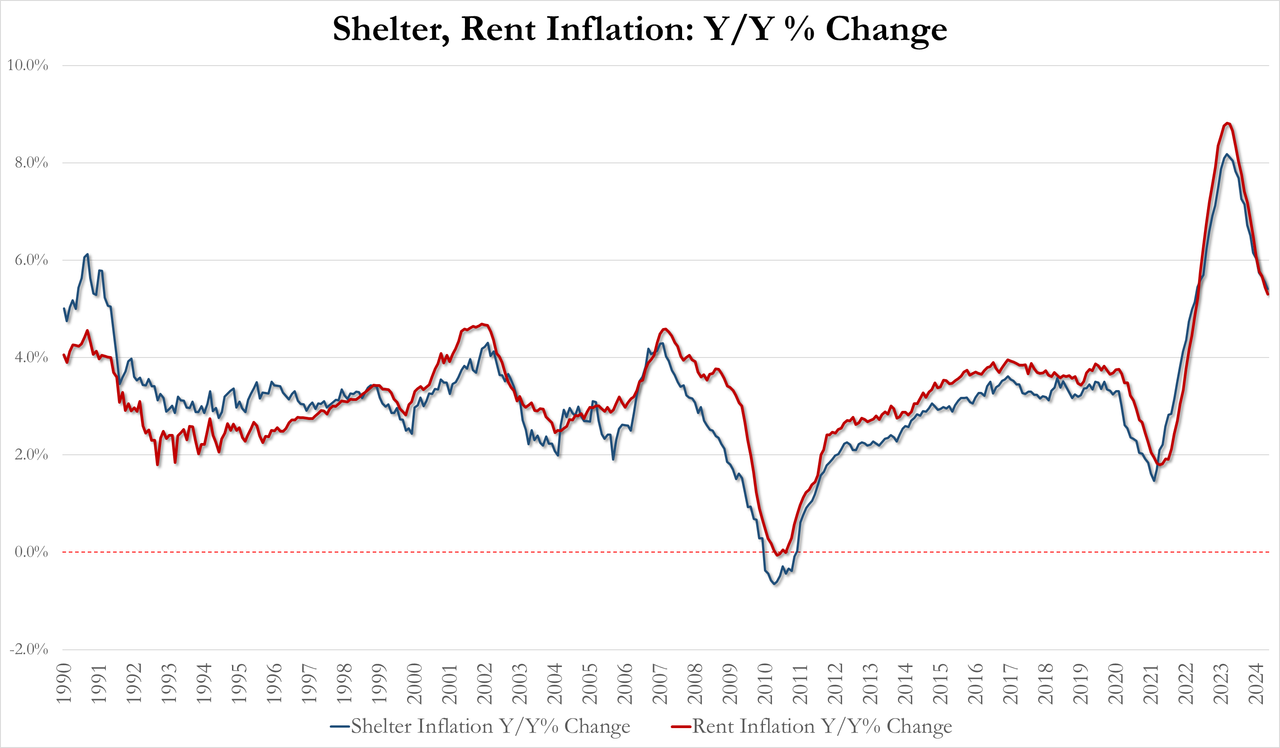
The shelter index increased 0.4 percent in May and was the largest factor in the monthly increase in the index for all items less food and energy.
May Shelter inflation 5.41% YoY, down from 5.55% in April and lowest since April 2022
May Rent inflation 5.30% YoY, down from 5.44% and lowest since May 2022
For context on how important housing costs are to US inflation data, the shelter index rose 5.4% over the last year, making up over two thirds of the total 12-month increase in the all items less food and energy index.
Source: Bloomberg
It does make one wonder were exactly the BLS is getting their BS OER data from…
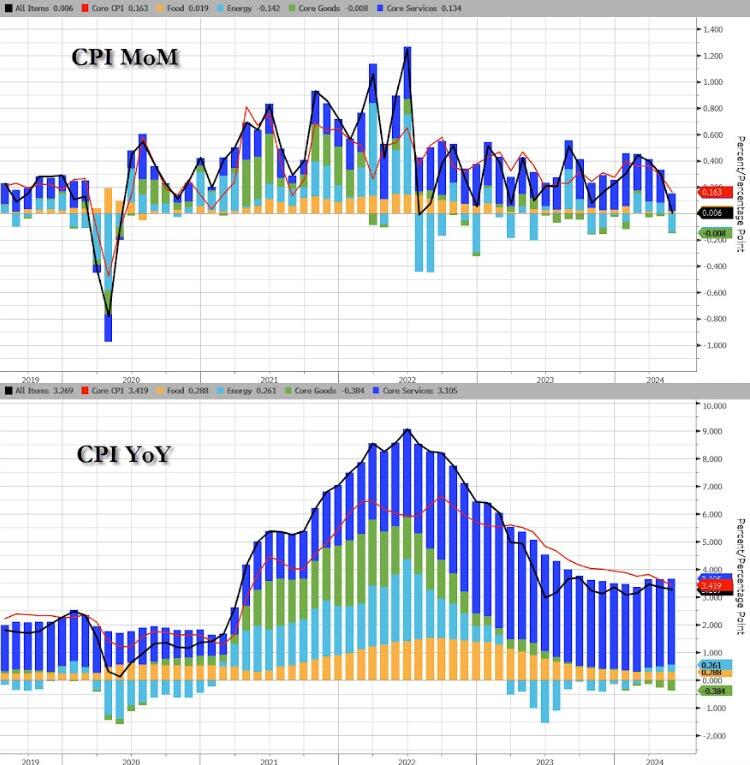
The full breakdown…
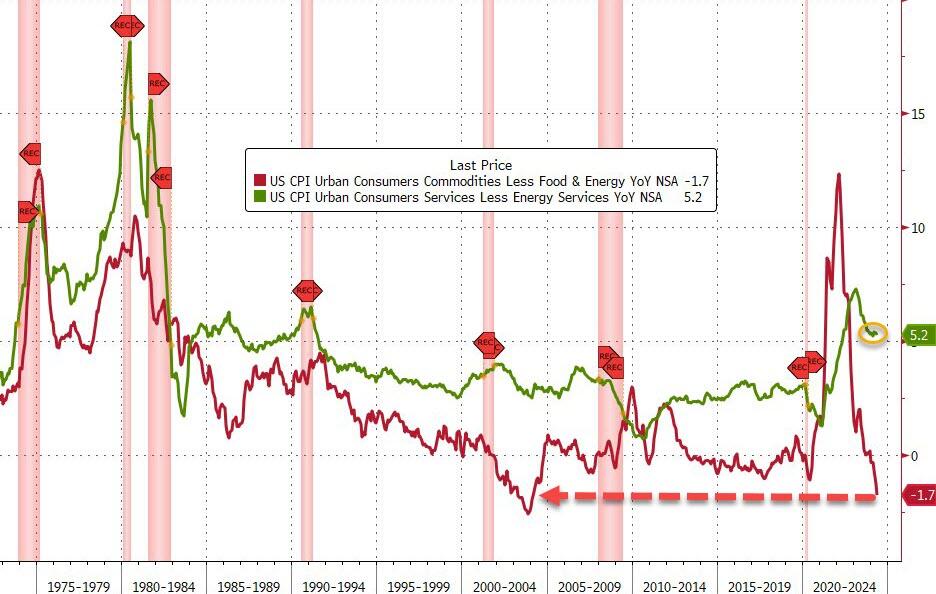
Services INflation remains awkwardly stuck above 5% while Goods DEflation is at its weakest since January 2004…
Source: Bloomberg
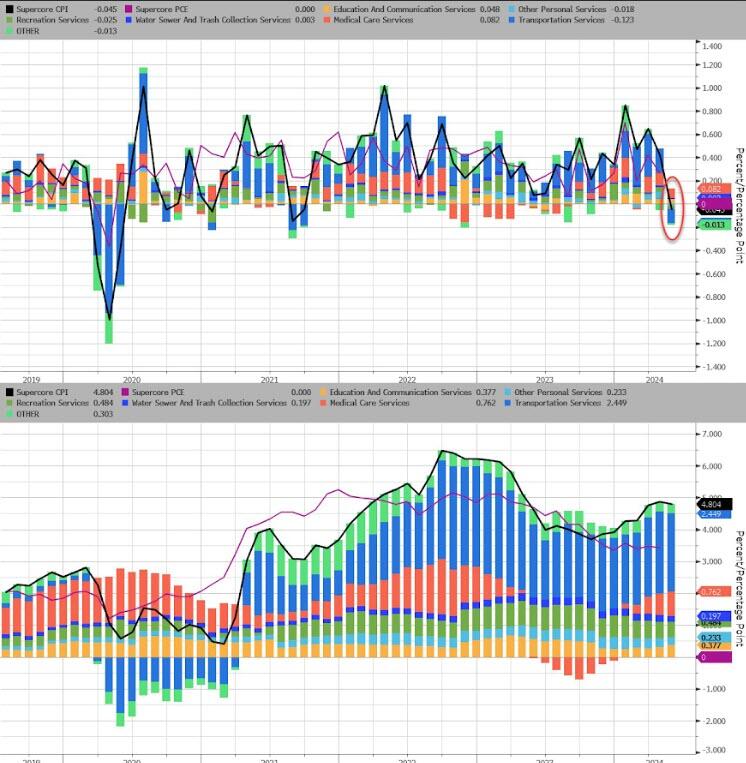
SuperCore CPI fell 0.05% MoM – its first drop since Sept 2021, but that left the YoY level still above 5.0%…
Source: Bloomberg
Transportation Services costs tumbled MoM to drag SuperCore lower MoM…
Source: Bloomberg
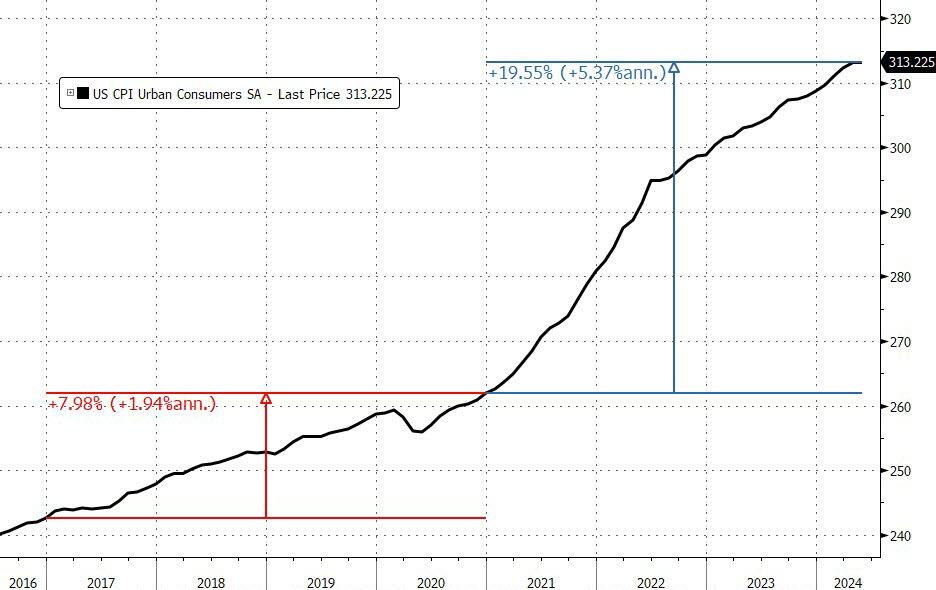
We note that consumer prices have not fallen in a single month since President Biden’s term began (July 2022 and May 2024 was the closest with ‘unchanged’), which leaves overall prices up over 19.5% since Bidenomics was unleashed (compares with +8% during Trump’s term).
And prices have never been more expensive…
That is an average of 5.4% per annum (almost triple the 1.9% average per annum rise in price during President Trump’s term).
Source: Bloomberg
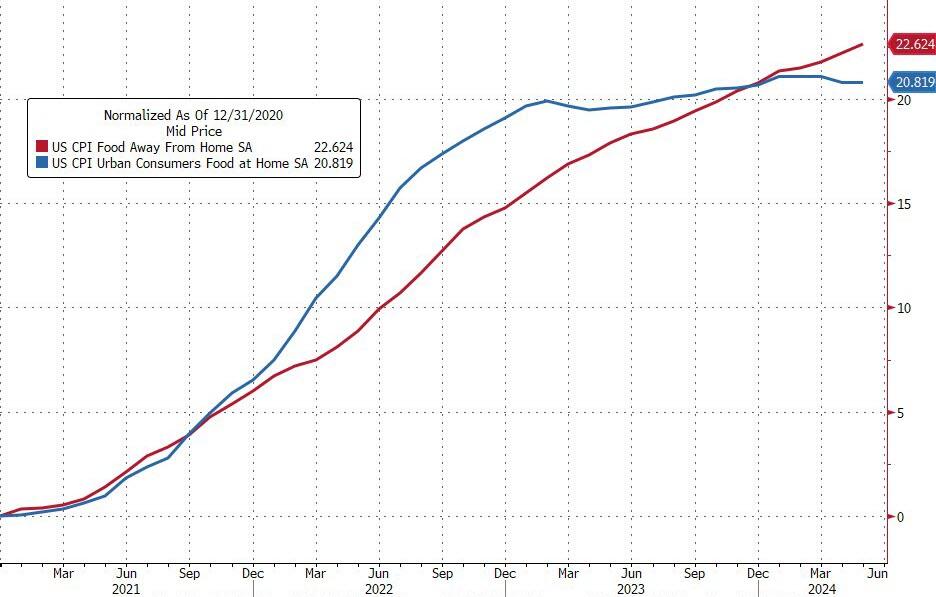
Since President Biden was elected, food prices at home are up around 21% and food prices away from home are up almost 23%…
And while the Biden administration will continue to gaslight voters with comments like “inflation is tumbling”… every man, woman, and child who actually buys food knows prices have NEVER been higher…
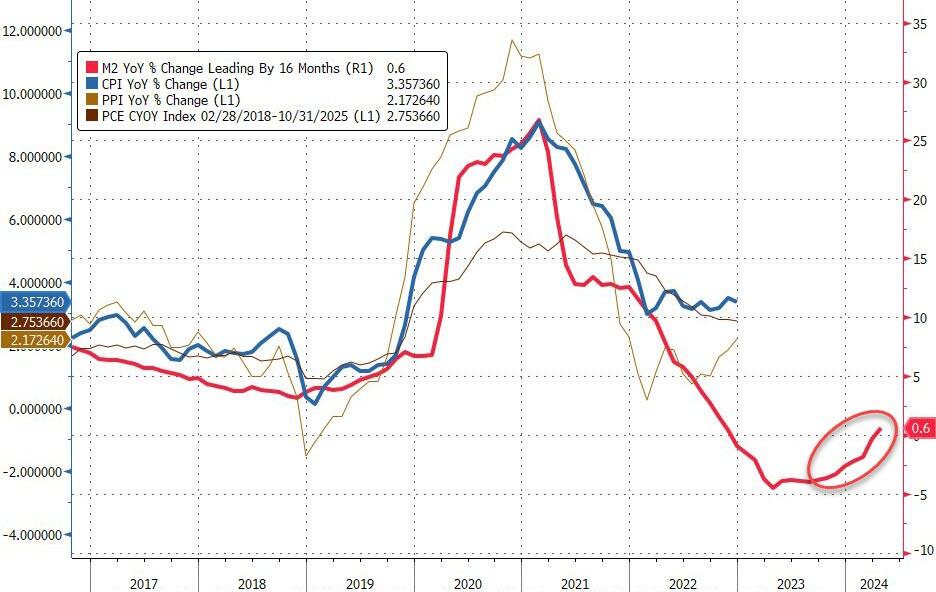
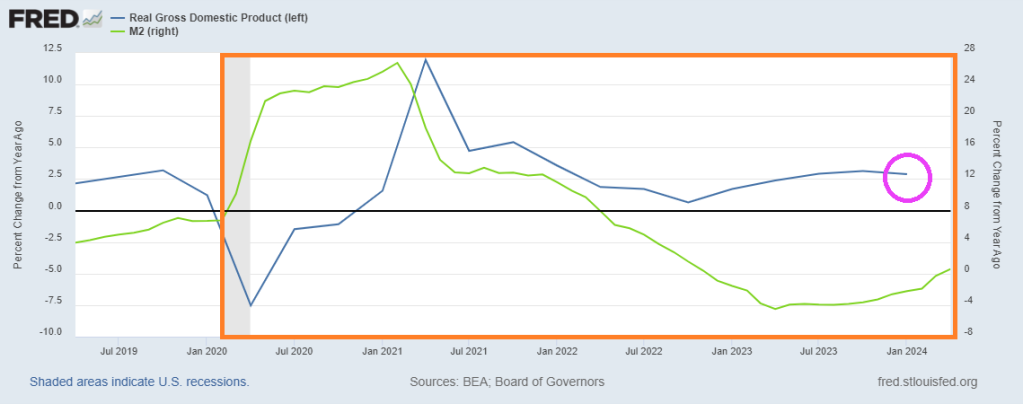
Finally, while the ‘flations’ have broadly tracked M2 lower, we note that M2 YoY is now starting to turn back higher once again…
Source: Bloomberg
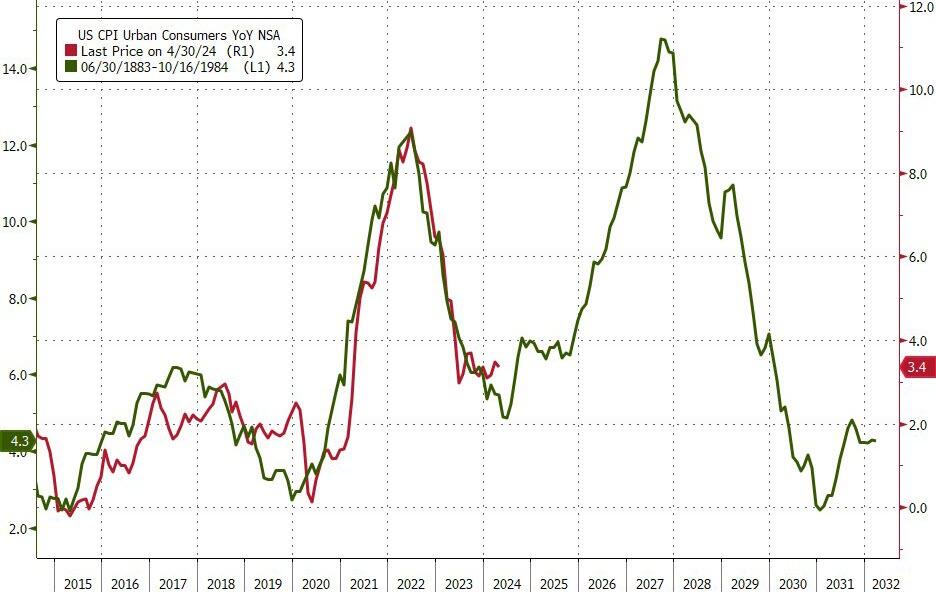
Will the next President and Fed head face a 70s redux?
Source: Bloomberg
And is this guaranteed if Powell decides “insurance” cuts are required (for Biden?)
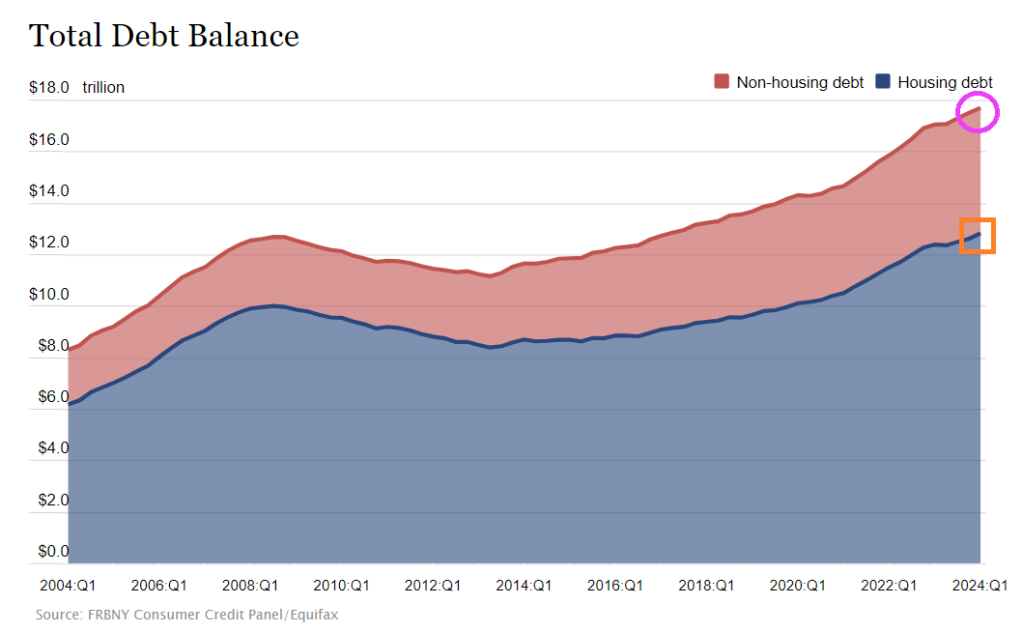
Too much debt should be the theme song for the US! Both for consumers and the Feral government (not a typo!)
Consumer credit increased by +$6.403 billion in April, much softer than consensus estimate of +$10 billion … more notable, however, was March data, given initial read of +$6.274 billion was revised down to -$1.099 billion.
Not to mention $13 trillion in mortgage debt (1-4 unit housing), but at least that is backed by property. Unlike The Feral government who borrows/prints with only a promise.
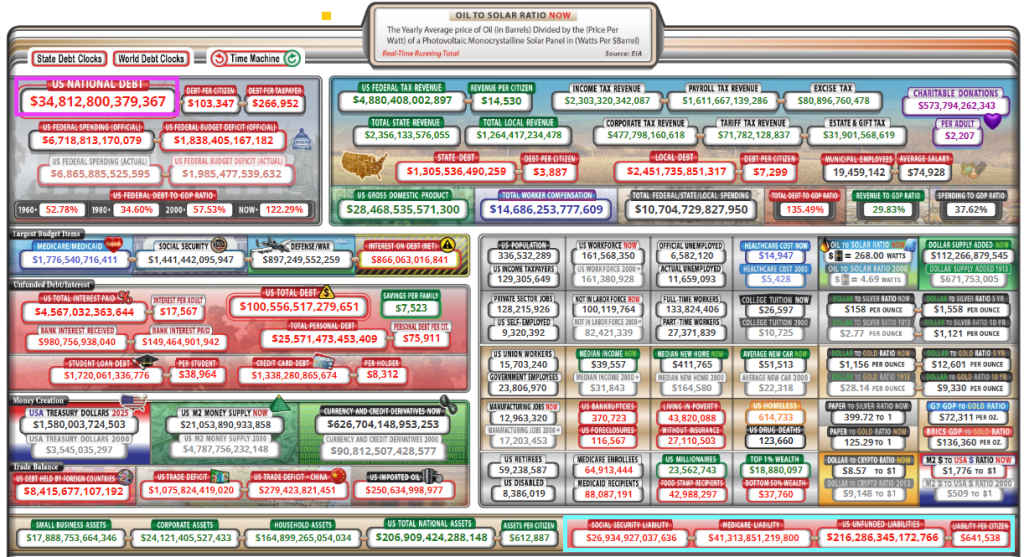
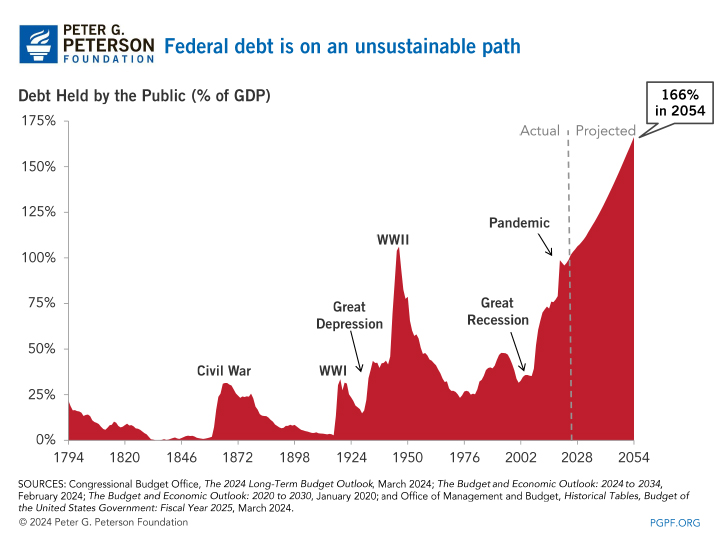
And growing awfully fast. Note that since the “pandamic”, debt as % of GDP has exceeded 100% and is projected to hit 166% by 2054. But look at the UNFUNDED LIABILITIES the need to be paid ($216+ TRILLION ($641.5k per citizen!). Pretty soon, we (the 99%) will be back on the chain gang paying for endless wars and government corruption. I wish Biden, Schumer, McConnell and other swamp creatures would consider all the spending the government is on the hook for rather than focus on spending that will help them get elected perpetually. There is no middle of the road anymore. The US is broke and has too much debt.
Of course, President Biden wants endless spending on wars (Ukraine, Israel, etc) and now wants an unlimited check to pay for the next pandemics. The Pretenders’ song “My City Was Gone” seems to be appropriate for the US as “My County Is Gone.”
Of course, some “economists” claim that the US can borrow/print unlimited amounts of money … until they can’t.
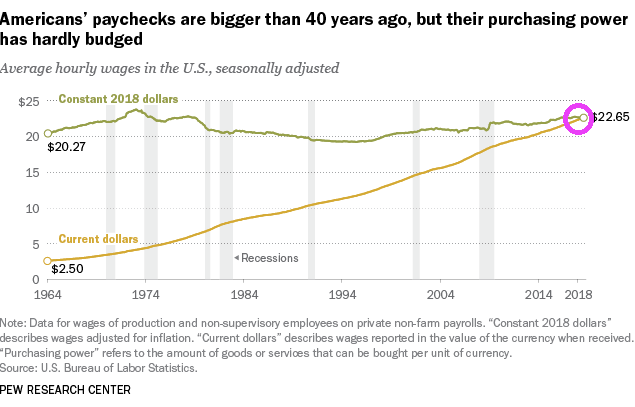
To begin with, America’s paychecks are bigger than 40 years ago, but purchasing power of those larger paychecks is about the sames as it was 40 years ago. Great job Washington DC!!! … NOT!!!!
Meanwhile, credit card delinquencies are at the highest level since 1991.
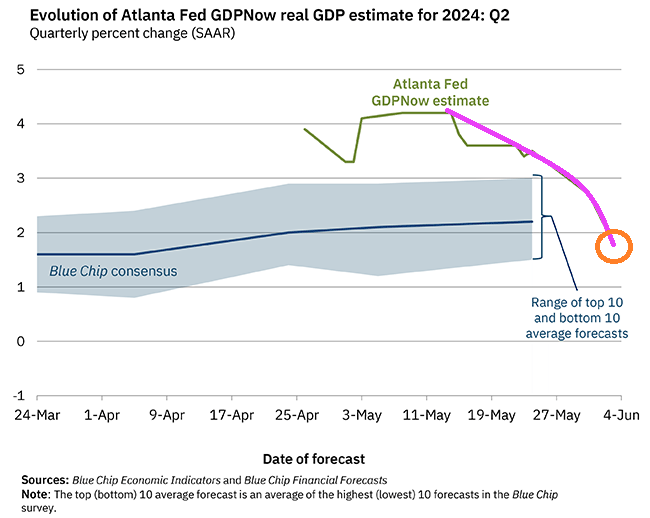
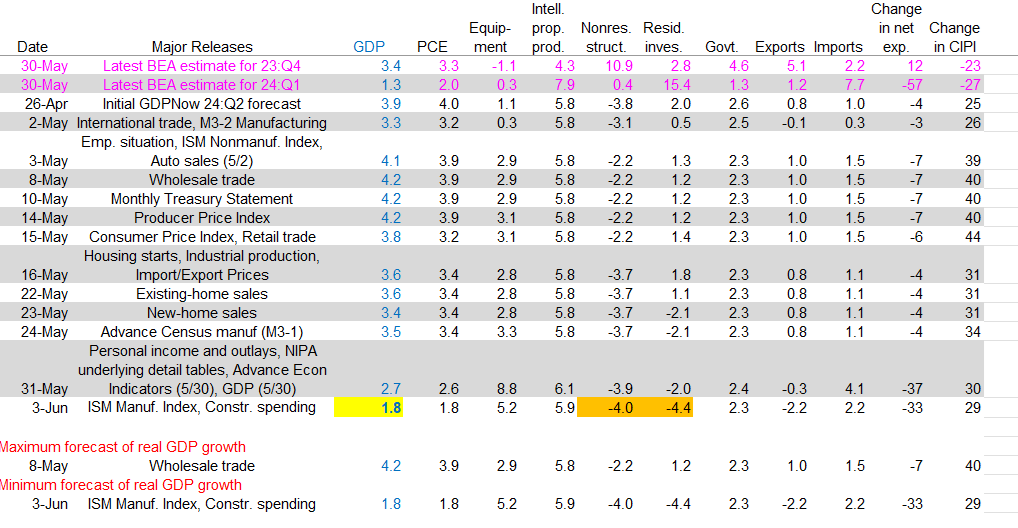
The GDPNow model estimate for real GDP growth (seasonally adjusted annual rate) in the second quarter of 2024 is 1.8 percent on June 3, down from 2.7 percent on May 31. After recent releases from the US Census Bureau and the Institute for Supply Management, the nowcasts for annualized second-quarter real personal consumption expenditures growth and real private fixed investment growth declined from 2.6 percent and 3.1 percent, respectively, to 1.8 percent and 1.5 percent.
fff
Since I used The Animal’s version of the John Lee Hooker great tune “Boom Boom,” I will use another Animals tune for Joe Biden’s penchant for sniffing little girls. “Baby Let Me Take You Home.”
The Animals band. Not to be confused with the animals in the Biden Administration and Congress.
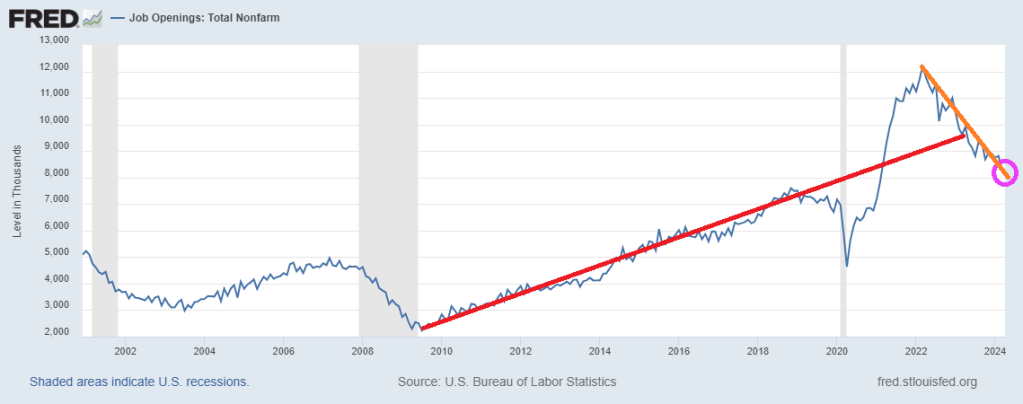
Job openings in April 2024 dipped to 8,059. Notice the trend (orange line) is below the trend set prior to Covid (red line).
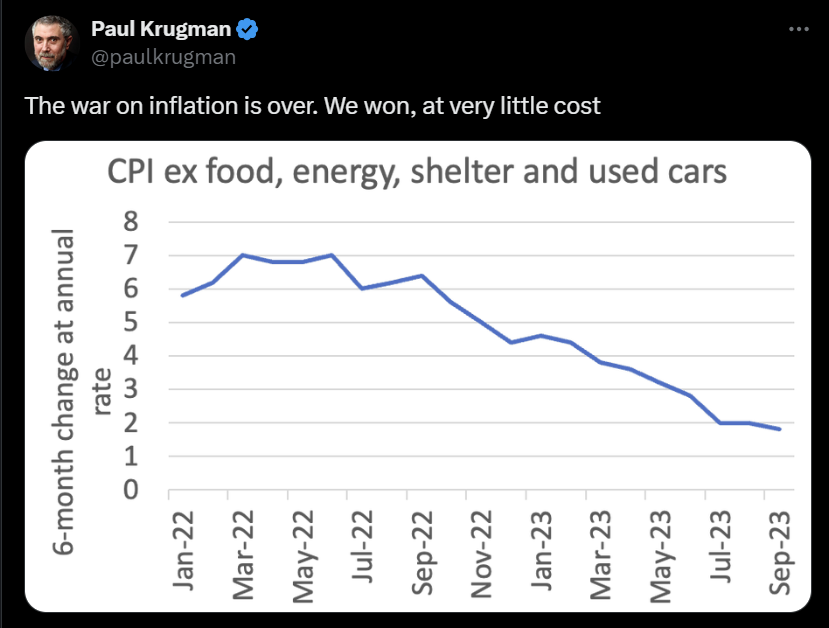
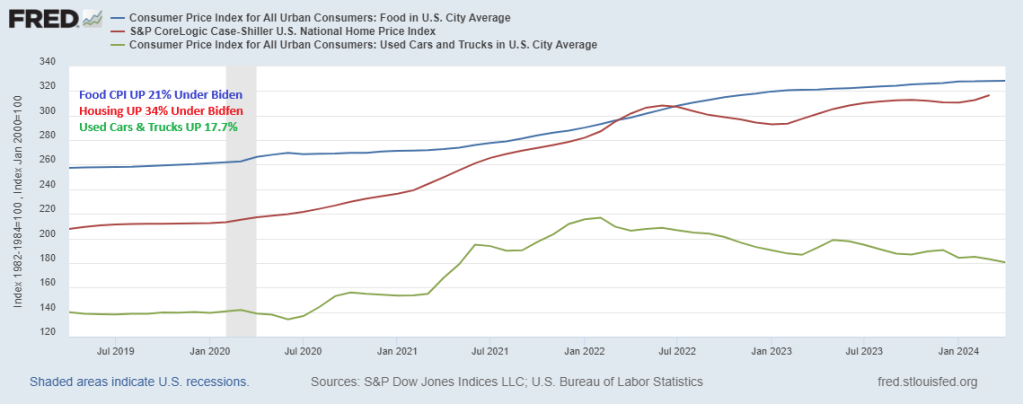
Back in 2023, Socialist Paul Krugman declared that “the war on inflation is over!!! “We” won, at very little cost.” I love when elitists claim “We won!” since clearly 99% of Americans lost since food, housing and car prices up are double digits under Biden.
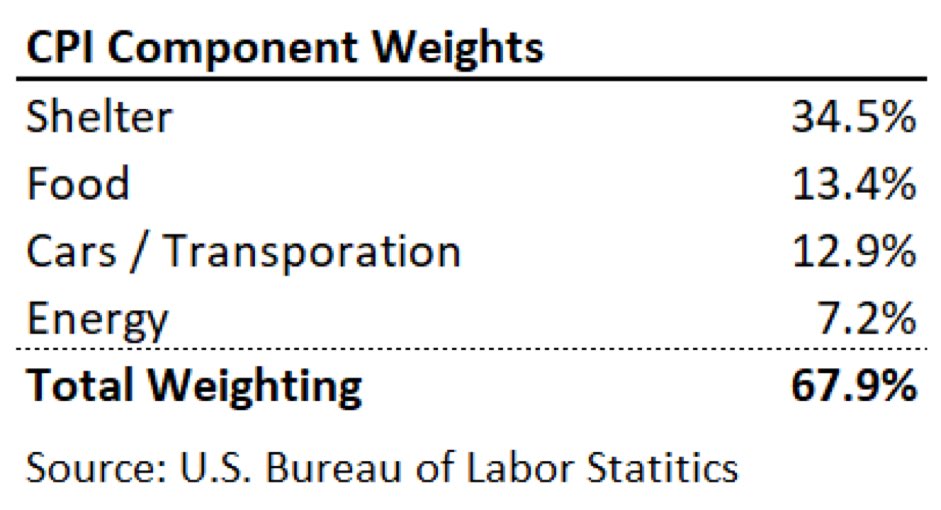
The problem is that food, energy, shelter, and used cars/trucks are a huge part of Americans consumption basket.
Under Biden, food CPI is up 23%. Home prices are up 34% and used cars/truck prices are up 17.7%.
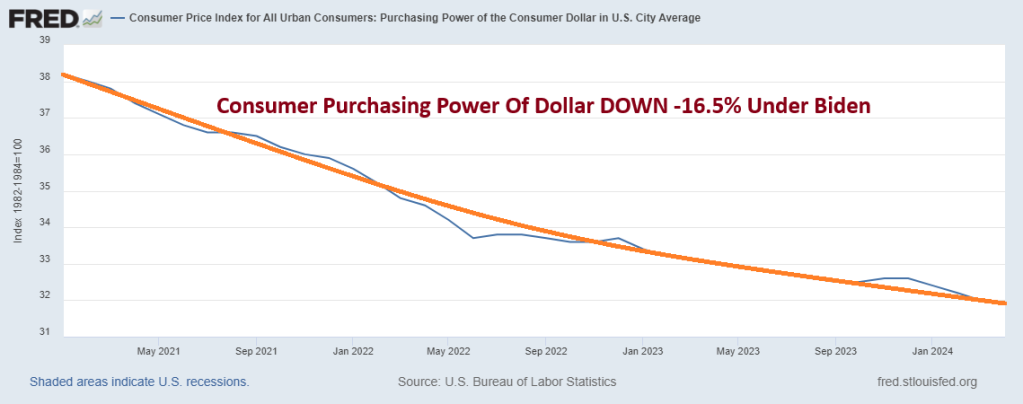
A note to Paul Krugman, YOU may have won, but the rest of Americans lost. Consumer purchasing power of the US Dollar is DOWN 16.5% Under Biden.
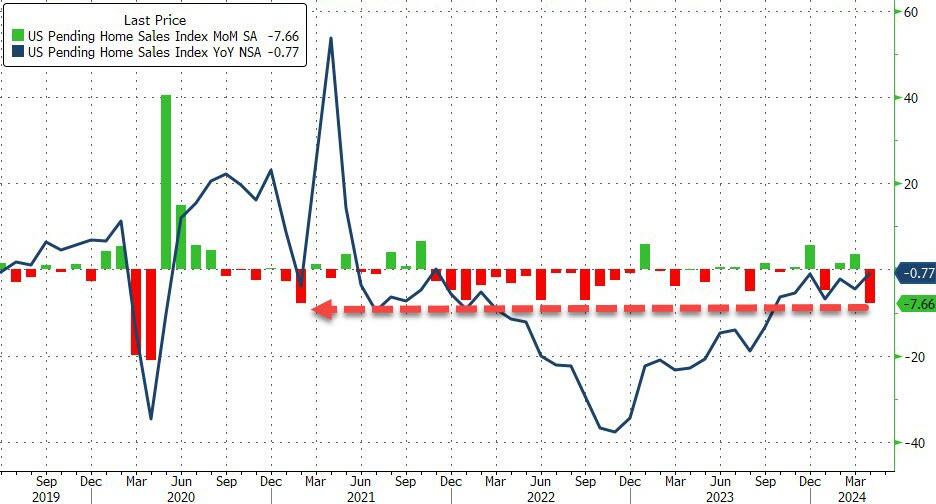
After an unexpected jump in March, pending home sales were expected to drop 1.0% MoM in April as mortgage rates pushed back above 7.00% and stayed there.
Well, the analysts had the direction right but magnitude was way off as pending home sales plunged 7.7% MoM – the biggest drop since Feb 2021 (and below the lowest estimate), leaving sales down 0.7% YoY…
Source: Bloomberg
This is the 29th straight month of YoY declines for non-seasonally-adjusted pending home sales.
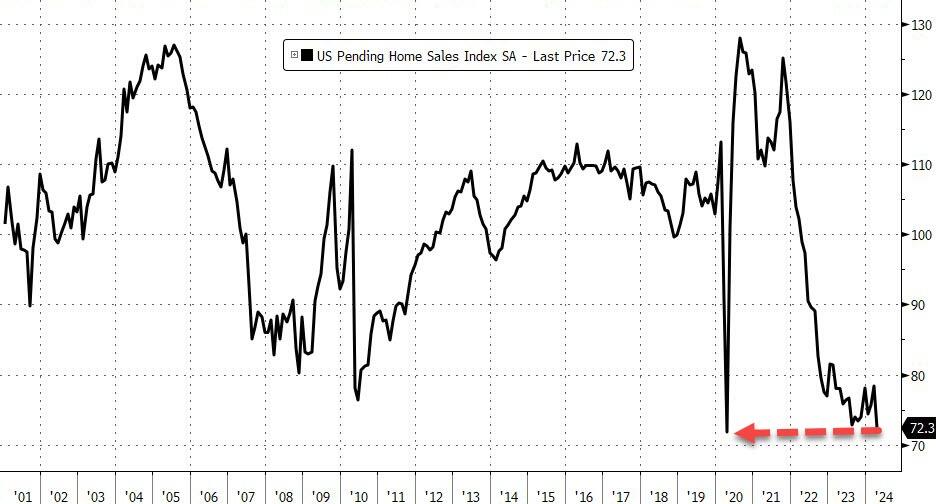
This MoM decline pushed the Pending Home Sales Index back to record lows…
Source: Bloomberg
The Midwest saw the biggest drop in pending sales, down 9.5% in April, followed by declines of 8.5% and 7.6% in the West and South, respectively. Contract signings in the Northeast fell 3.5%.
“The impact of escalating interest rates throughout April dampened home buying, even with more inventory in the market,” NAR Chief Economist Lawrence Yun said in a statement.
“But the Federal Reserve’s anticipated rate cut later this year should lead to better conditions, with improved affordability and more supply.”
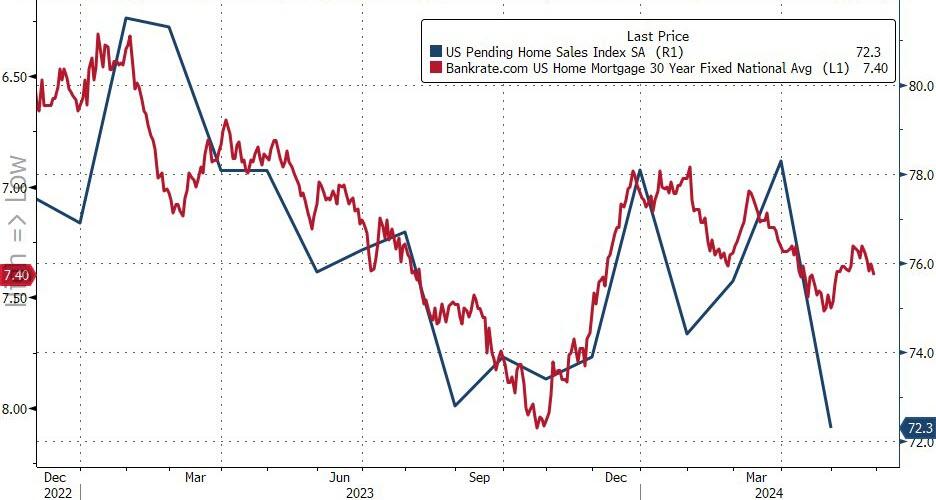
All driven by affordability crisis as mortgage rates surged back above 7.00%…
Source: Bloomberg
“The prospect of measurable home price declines appears minimal,” Yun said.
“The few markets experiencing price declines will be viewed as second-chance opportunities for buyers to enter the market if those regions continue to add jobs.”
As a reminder, the pending-sales report tends to be a leading indicator of sales of previously owned homes, because houses typically go under contract a month or two before they’re sold.
What I like about Biden’s economy … nothing. Most of Biden’s economic growth came from Trump’s spending and Fed monetary policy from the Covid shutdown of 2020.
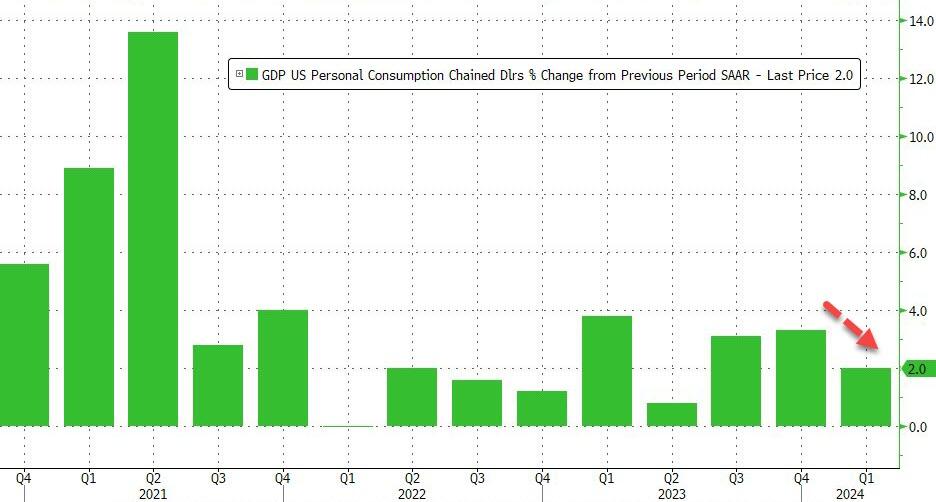
The sharp downward revision primarily reflected a downward revision to consumer spending, which rose 2.0% annualized, down from 2.5% in the first GDP report and below the 2.2% estimate.
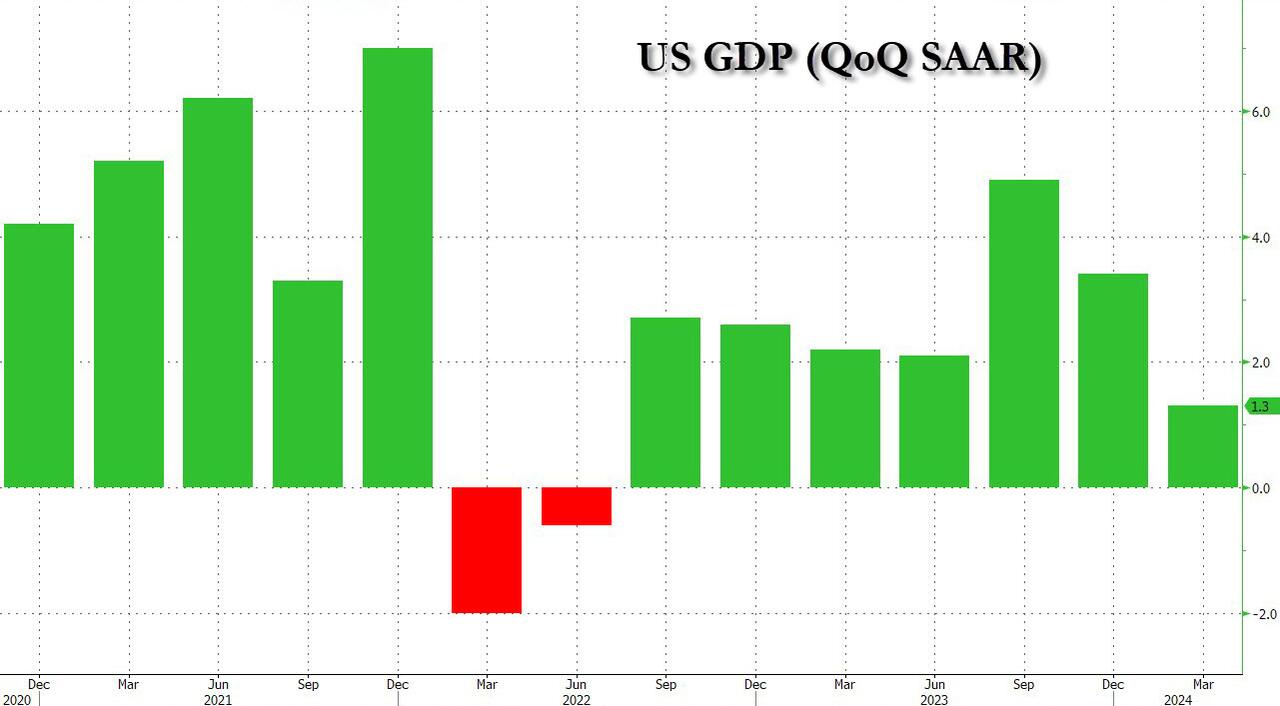
Drilling down into the number, the 1.3% increase reflected increases in consumer spending (below previous forecasts) and housing investment that were partly offset by a decrease in inventory investment. Imports, which are a subtraction in the calculation of GDP, increased.
The increase in consumer spending reflected an increase in services that was partly offset by a decrease in goods. Within services, the leading contributors to the increase were health care as well as financial services and insurance. Within goods, the leading contributors to the decrease were motor vehicles and parts as well as gasoline and other energy goods.
The increase in housing investment was led by brokers’ commissions and other ownership transfer costs as well as new single-family housing construction.
The decrease in inventory investment was led by decreases in wholesale trade and manufacturing
In terms of bottom-line contributions, we find the following:
Personal consumption accounted for 1.34% (down from 1.68%), or more than the entire GDP print.
Fixed Investment added 1.02%, up from 0.91% in the first estimate.
The change in private inventories subtracted -0.45%, a deterioration from the -0.35% estimated previously.
Net trade (exports less imports), subtracted -0.89% from the bottom line print, comparable to the -0.86% detraction in the first estimate.
Finally, government added just 0.23%, up from 0.21% initially estimated, yet still the lowest contribution since Q2 2022.
Home buyers will be able to buy a home without putting any money down under a new program launched by United Wholesale Mortgage, one of the largest U.S. mortgage lenders.
The Pontiac, Mich.-based company’s new program will be available to first-time home buyers and people earning at or below 80% of an area’s median income, the company said in a press release.
UWM (UWMC) will give eligible buyers a second-lien loan of up to $15,000, in the form of down-payment assistance, for 3% of the home’s purchase price. The loan will not accrue interest or require a monthly payment.
“Homeownership is something we’re very passionate about,” Melinda Wilner, chief operating officer at UWM, told MarketWatch.
The company had previously allowed buyers to put down as little as 1% on their homes, but it wanted to go further to help home buyers, she said. The lender is anticipating a higher volume of borrowers with its new zero-down program, Wilner added.
Poor underwriting practices were a key driver of the subprime-mortgage crisis in the U.S., the International Monetary Fund wrote in 2008. But unlike the low- and no-down-payment loans that proliferated during that time – when lenders made loans to people who eventually were unable to pay them and lost their homes – UWM’s program is different, Wilner said.
“The aspect of this program that makes me nervous is the silent second mortgage,” Anneliese Lederer, senior policy counsel at the nonprofit Center for Responsible Lending, told MarketWatch in an interview. “It’s great that there’s no interest on it, but it’s a balloon payment, and borrowers need to understand what a balloon payment is.”
A balloon payment refers to a bigger-than-usual one-time payment that is required by the lender at the end of the loan term, according to the Consumer Financial Protection Bureau.
On its website, UWM states in the fine print at the bottom of the page that the second loan “has no minimum monthly payment requirements, a term of 360 months and is fully due as a balloon payment upon the occurrence of either a refinance of the [first mortgage], [or] payoff of the [first mortgage] or the final payment.”
Not Like 2008?!
Housing prices are stretched
The economy is slowing
The lender has no cushion against falling home prices
There are indications of steeply falling homes in many markets.
OK, we don’t have massive liar loans like we did in 2008. But mortgage affordability is the lowest ever, and unemployment is starting to tick up.
Anything to Keep the Bubble Going
To top it off, these mortgages are explicitly for people who make 80% or less of an area’s median income.
How dumb is that? In general, such borrowers have no down payment, if any savings at all, and many are already likely on the edge.
It would make more sense giving these mortgages to those who make 120% or more of an area’s median income, provided they also have little debt, and just lack the down payment.
President Joe Biden called on Congress to provide up to $25,000 in down-payment assistance to first-generation home buyers in his State of the Union Address.
These vote buying proposals to keep the economy humming long enough to win an election are always at the expense of those who fall for the scheme.
The loss of a job or any unexpected debt will throw these buyers right over the cliff.
The Commerce Department revised March durable goods orders from +2.6 percent to +0.8 percent. Now it reports a 0.7 percent gain vs an expectation of -0.5 percent.
Existing-home sales fell 1.9 percent in April and are also down 1.9 percent from a year ago. Sales have not gone anywhere for 17 months.
Key Highlights
Existing-home sales faded 1.9% in April to a seasonally adjusted annual rate of 4.14 million. Sales also dipped 1.9% from one year ago.
The median existing-home sales price rose 4.8% from March 2023 to $393,500 – the ninth consecutive month of year-over-year price gains and the highest price ever for the month of March.
The inventory of unsold existing homes climbed 9% from one month ago to 1.21 million at the end of April, or the equivalent of 3.5 months’ supply at the current monthly sales pace.
Big Negative Revisions to BLS Monthly Jobs in 2023
On April 24 the BLS released a little-read jobs report that shows reported jobs in 2023 may be wildly overstated.
Business Employment Dynamics (BED) data and and Monthly Job Data both from the BLS, chart by Mish
The BED report is based on records on 9.1 million private sector establishments. Current Employment Statistics (CES) is the monthly jobs report based on 670,000 establishments.
Obviously, the BED report is more timely, but it lags. CES provides an opportunity for economists (and the president) go gaga over numbers likely to be wildly wrong.
CES Overstatement
2023 Q2 CES Overstatement: 489,000 Jobs
2023 Q3 CES Overstatement: 832,000 Jobs
Q2+Q3 Overstatement: 1.321 Million Jobs
Thus, the BLS says that the BLS monthly job reports for 2023 Q2 and Q3 are overstated by a total of 1.321 million jobs.
Zero Percent Down Synopsis
An economic slowdown is underway (see five previous links).
Jobs are overstated by 1.3 million, discretionary spending is faltering, and UWM (UWMC) is offering zero percent down mortgages to buyers most likely to get in trouble if anything goes wrong.
The Case-Shiller national home price index hit a new high in February. That’s the latest data. Economists don’t count this as inflation.
Other than the late stages of the 2008 housing bubble, there has been no worse time in history to offer zero percent down mortgages.
My own personal comments: Will UWM be retaining these loans on their balanace sheet? Or simply resellling them to Fannie Mae, Freddie Mac? Likely the latter.
The Market Composite Index, a measure of mortgage loan application volume, decreased 5.7 percent on a seasonally adjusted basis from one week earlier. On an unadjusted basis, the Index decreased 6.3 percent compared with the previous week. The seasonally adjusted Purchase Index decreased 1 percent from one week earlier. The unadjusted Purchase Index decreased 3 percent compared with the previous week and was 10 percent lower than the same week one year ago. And -40% under Biden.
The Refinance Index decreased 14 percent from the previous week and was 12 percent higher than the same week one year ago.
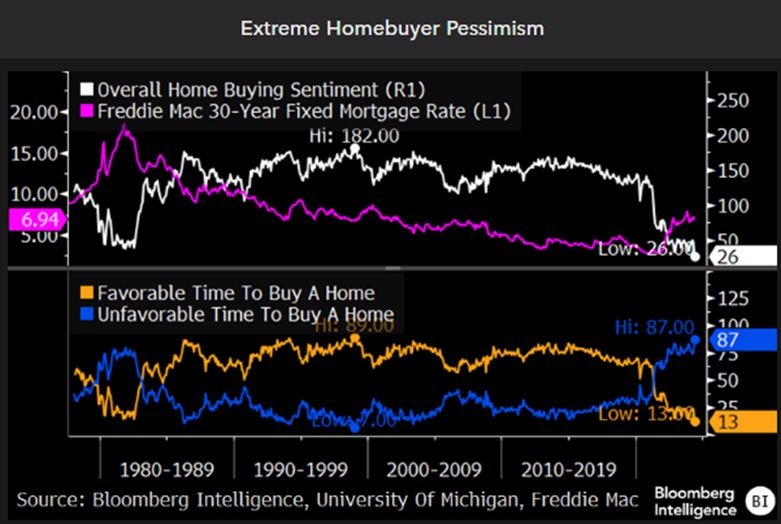
It is still an unfavorable time to buy a home!
From the film “Ronin” that sums up actor Robert DeNiro in one sentence.
Spence (Sean Bean): “You know, you think too hard.” Sam (Robert DeNiro): “Nobody ever told me that before.”
How would DeNiro consider the 40% drop in mortgage purchase demand under Biden?


You must be logged in to post a comment.