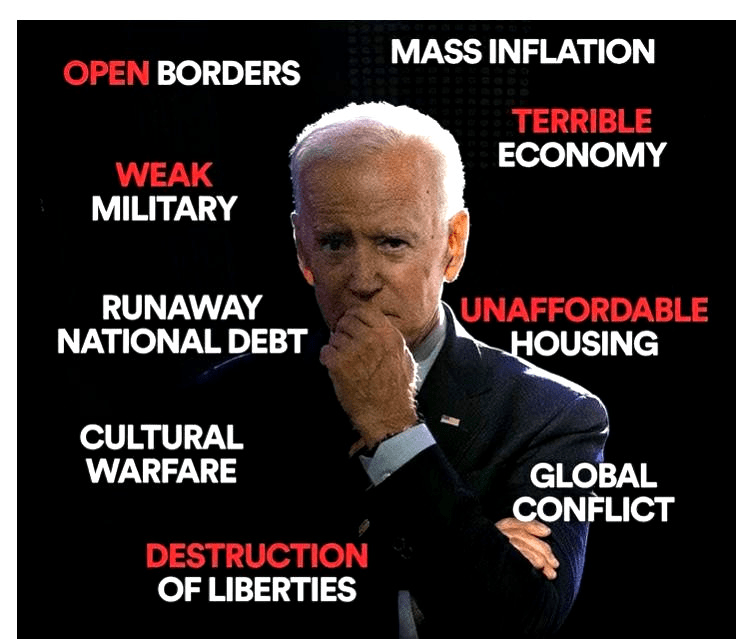
Biden is lucky in that many portray him as a senile, dumb US Senator who happens to be President. Perhaps Biden is actually insidious allowing for open borders in the hopes of crashing the US economy by overloading the welfare system and driving national debt through the roof?
Biden, like Clinton and Obama before him, has been a Cloward-Piven discipile. Who are Cloward and Piven you ask? Two sociologists at Columbia University. (Cloward pass away in 2001, while Piven is still living). Here are Cloward and Piven attending the Voter Registration (aka, Motor Voter Law) Act signing by President “Willie Slick” Clinton.
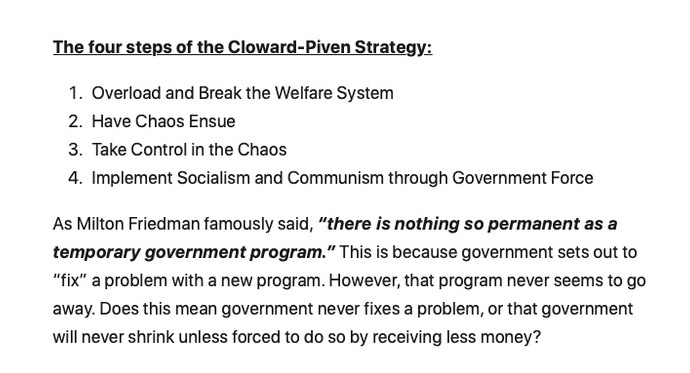
The Cloward-Piven strategy is to overload the welfare system to the point of chaos, take control and implement Marxism through government force. To that extent, Biden and his incoherent sidekick, Kamala Harris, have been wildly successful. Sociology and Political Science are two of the most worthless college degrees (with Management in the Business School being a close third). Taking advice from Sociologists or Political Science majors or faculty is insane.
Biden should be familiar to Latin American, African and Chinese immigrants who are used to Marxist dictators who try to have their political opponents taken of the ballots and prosecucted.
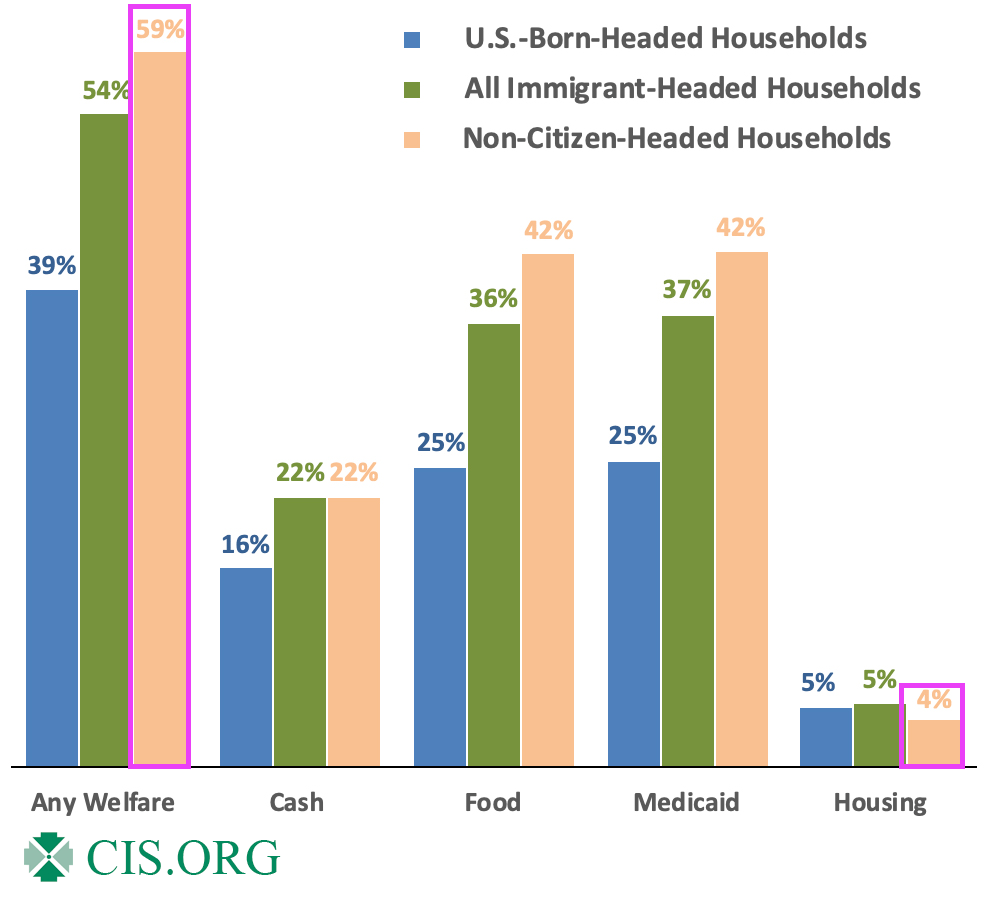
Yes, the US welfare rolls are overflowing with illegal immigrants and unfunded liabilities are out of control. Perhaps Biden and Harris should be replaced with Cloward and Piven (even though Cloward is dead). But Newsom, Hillary Clinton and Michelle Obama share the idiocy of the Columbia sociology faculty members. Hillary even teaches a course at Columbia!
What about compassion for immigrants? Great! Let’s close the borders and return to LEGAL immigration to halt human trafficking, Fentanyl imports, and cartels controlling the border. But Cloward-Piven’s strategy is best accomplished with open borders and weak-willed politicians.
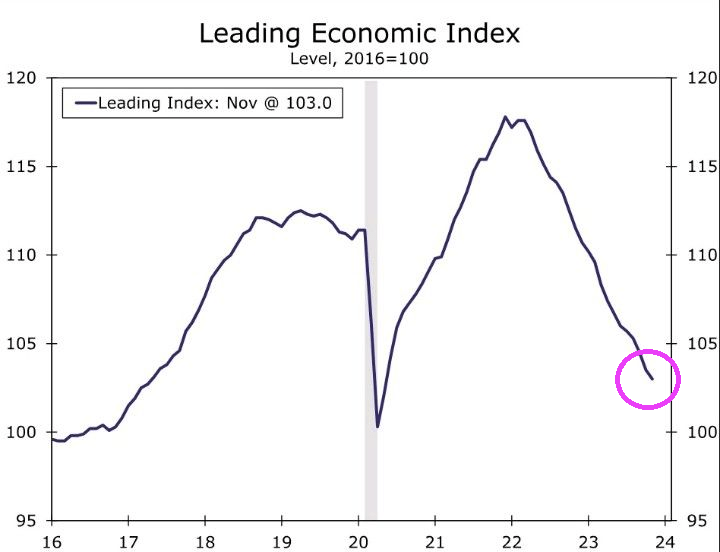
The Conference Board Leading Economic Index® (LEI) for the U.S. declined by 0.5 percent in November 2023 to 103.0 (2016=100), following a (downwardly revised) decline of 1.0 percent in October. The LEI contracted by 3.5 percent over the six-month period between May and November 2023, a smaller decrease than its 4.3 percent contraction over the previous six months (November 2022 to May 2023).
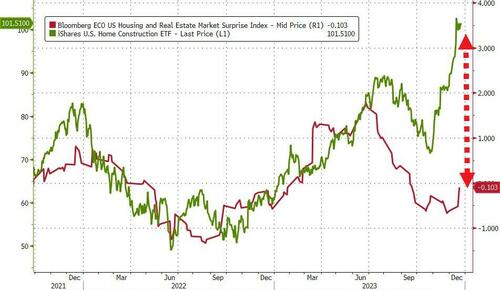
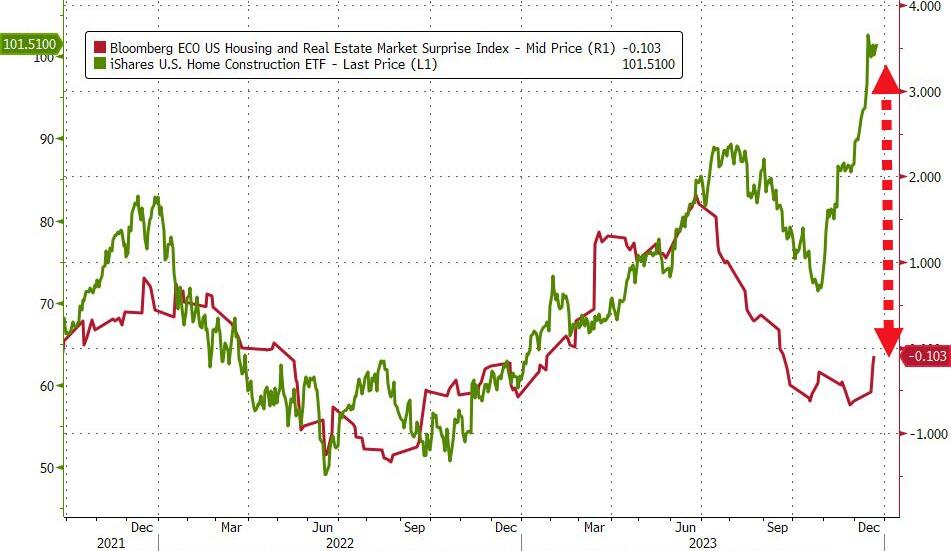
Of course, investors don’t care about actual fundamentals, rates are down so ‘buy buy buy’ the builders…
Source: Bloomberg
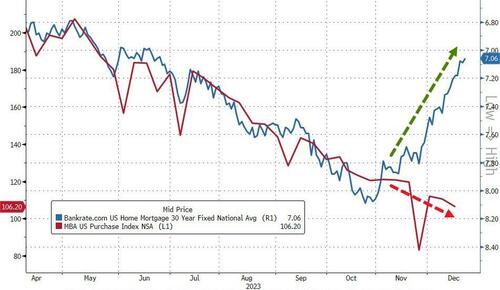
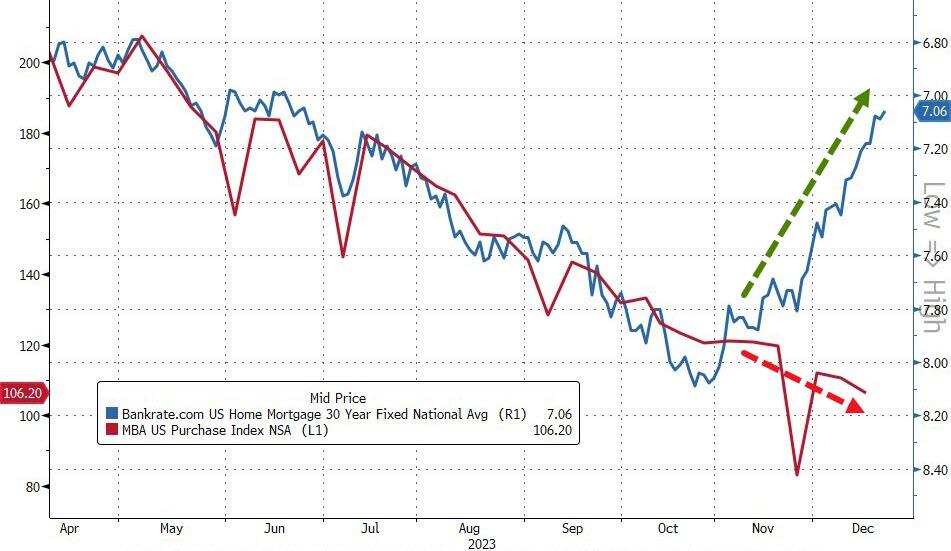
Trouble is, even as mortgage rates have plunged recently, applications for home purchases has continued to decline…
Source: Bloomberg
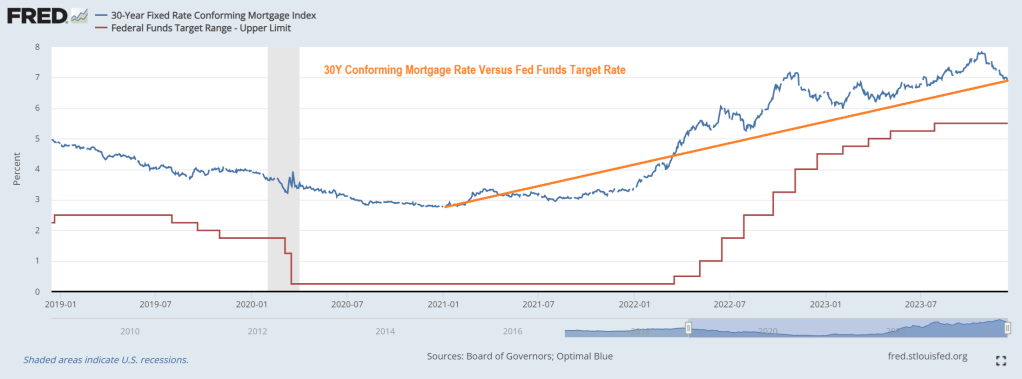
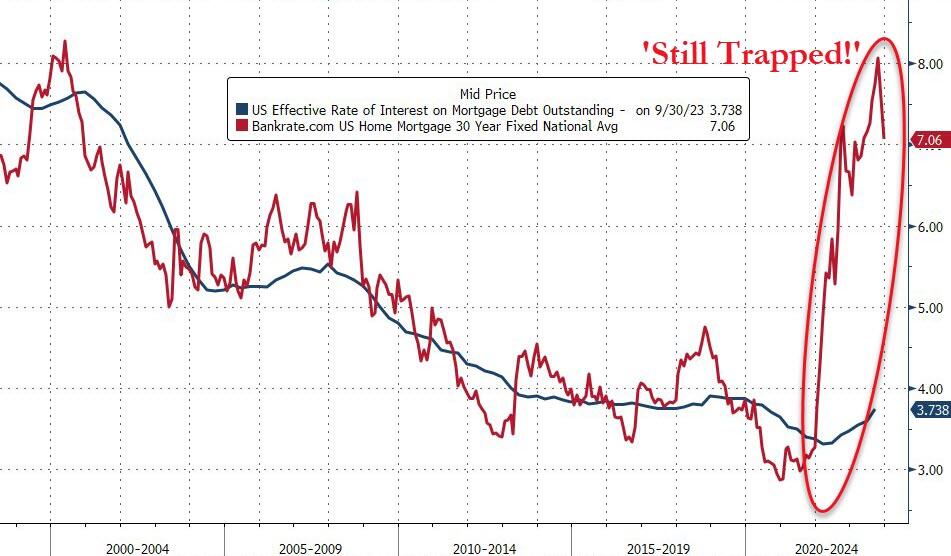
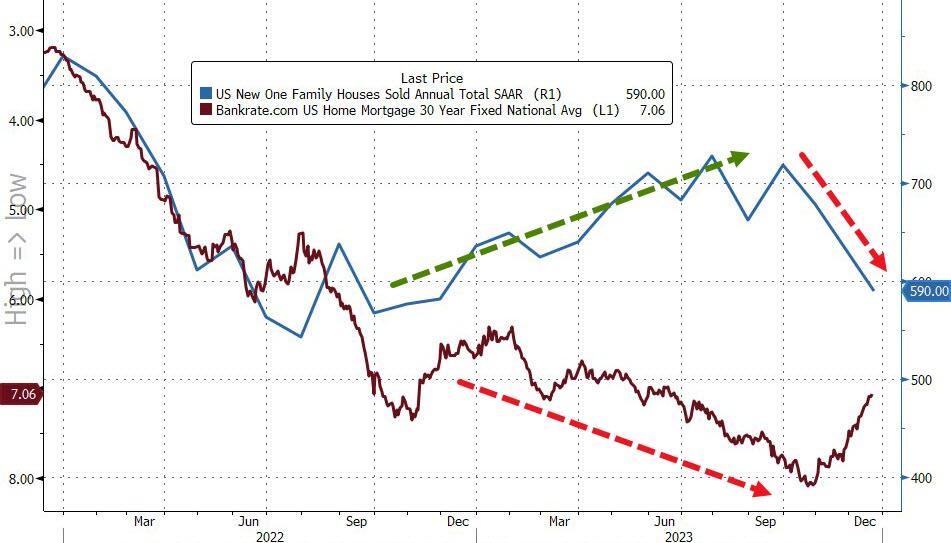
And while mortgage rates have declined (rapidly), they remain massively high relative to the effective mortgage rate for all Americans. That difference is the ‘subsidy‘ that homebuilders have to fill to enable buyers – and it’s still yuuuge!
Source: Bloomberg
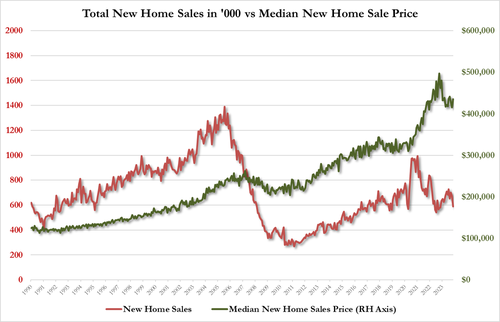
So, just how many new homes were sold in November?
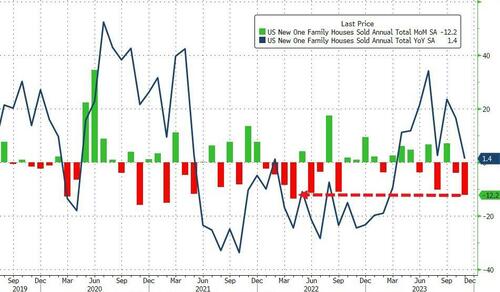
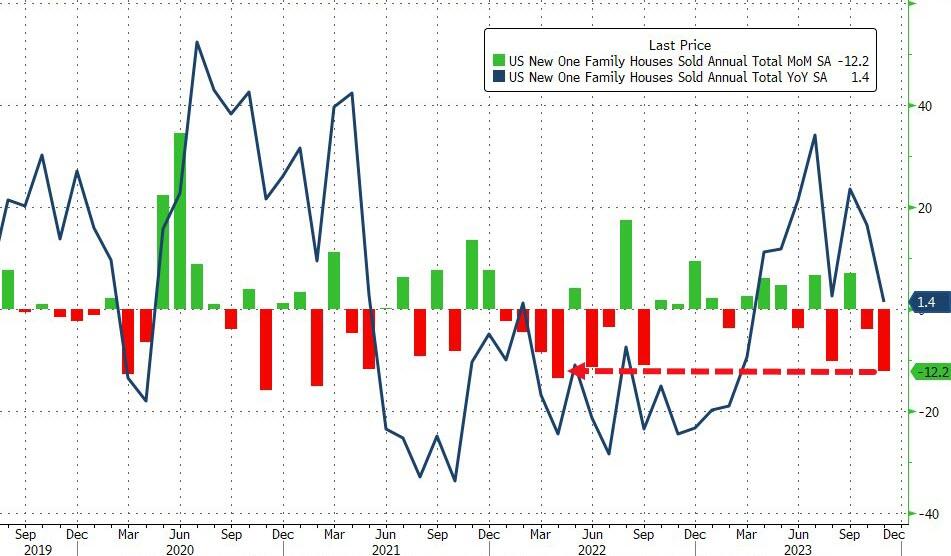
The last few months have been very choppy for new home sales but November clarified that homebuilders just hit a wall on their subsidization!
New home sales crashed 12.2% MoM – the biggest MoM drop since April 2022. That dragged the YoY change to just 1.4%…
Source: Bloomberg
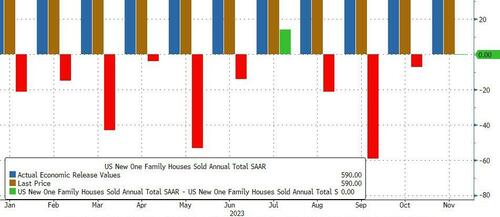
9 of the last 10 months have seen downward revisions to the new home sales SAAR!
Source: Bloomberg
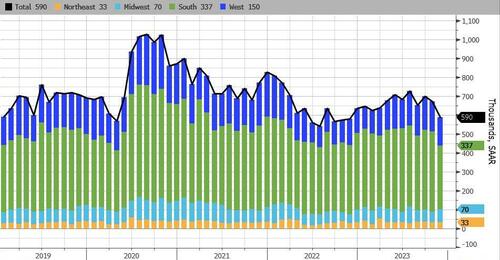
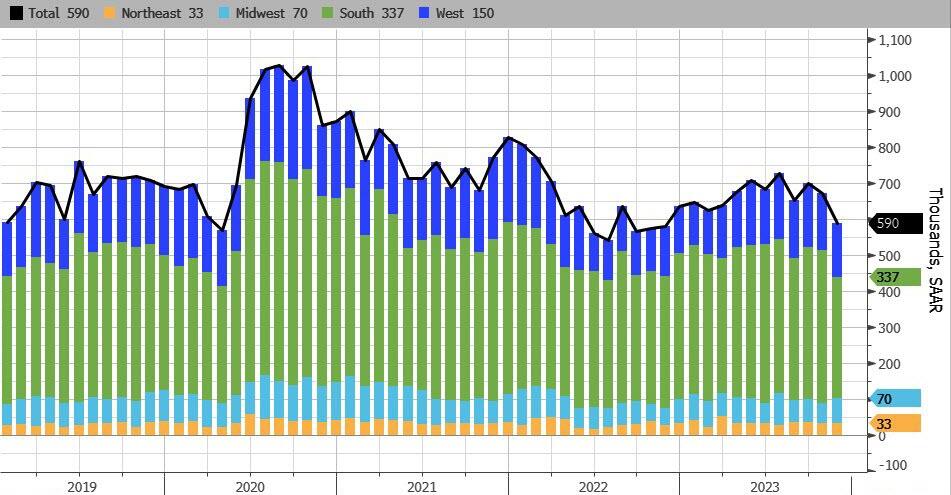
New home sales fell in the South by the most, followed by the West. The Northeast and Midwest saw increased sales…
Source: Bloomberg
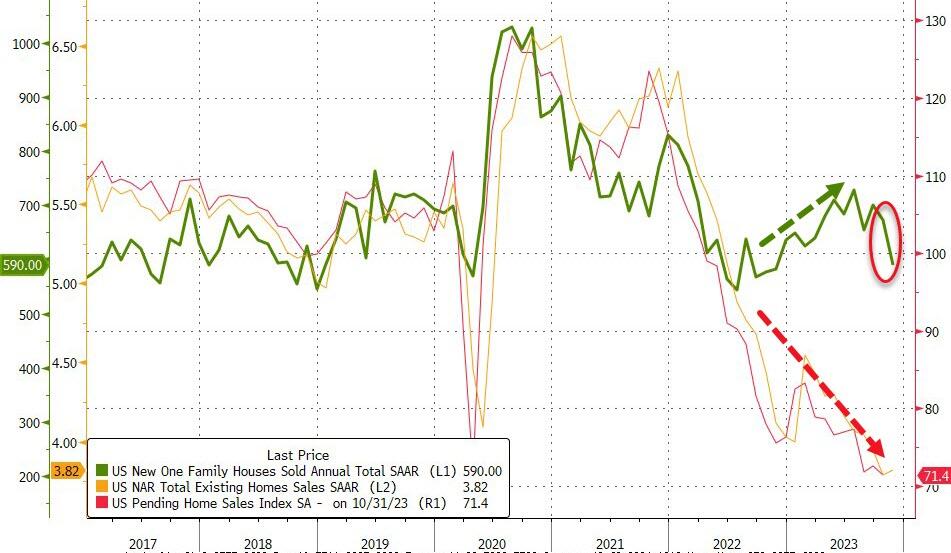
The new home sales SAAR printed 590k (well below the 690k exp) – the lowest since Nov 2022… catching down to existing home sales reality…
Source: Bloomberg
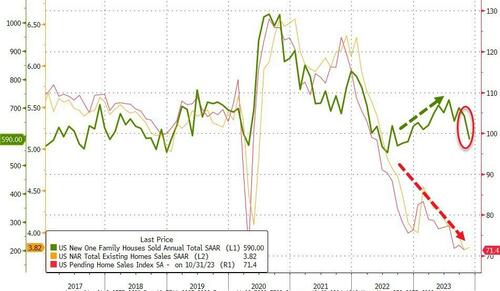
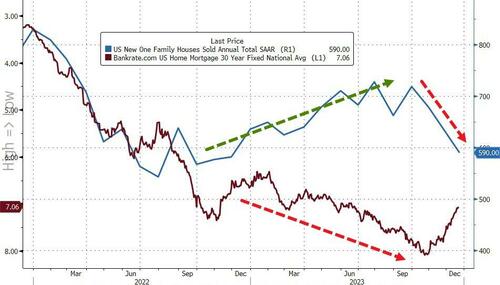
And another catch-up to reality for sales, even as rates tumble…
Source: Bloomberg
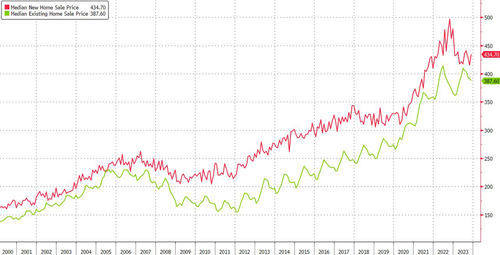
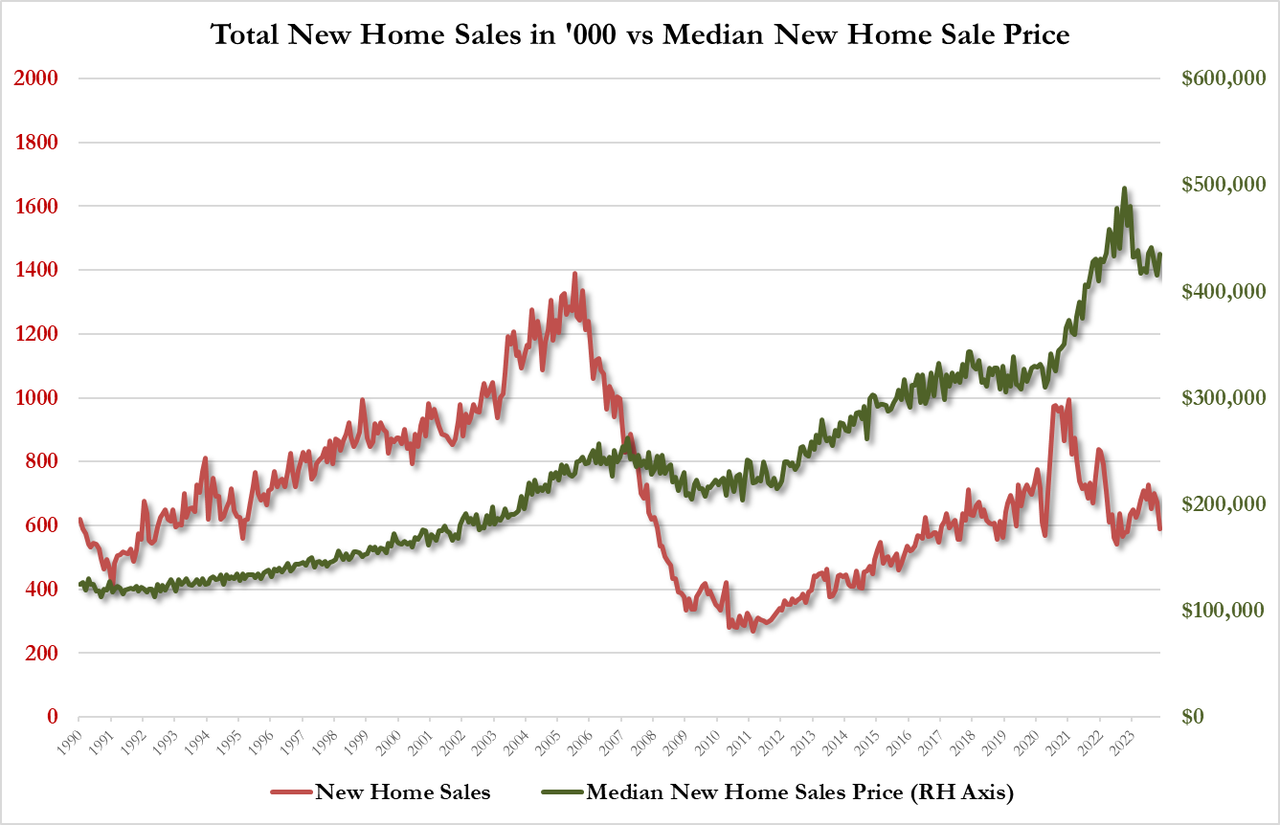
Finally, we note that the median new home priced jumped to $434.7k from $414.9k…
Source: Bloomberg
The median existing home price dropped to lowest since April while median new home price jumped to highest since August
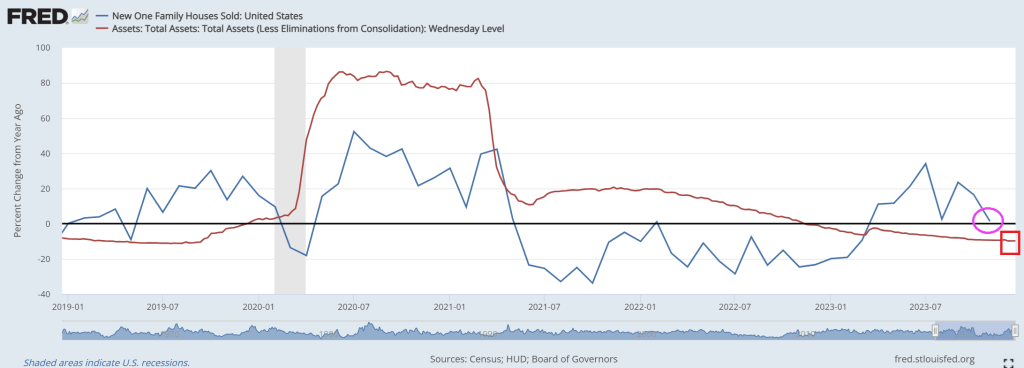
Odd that these ‘actual’ new home sales are plunging as ‘soft survey’ data shows homebuilder sentiment rising, and housing starts.
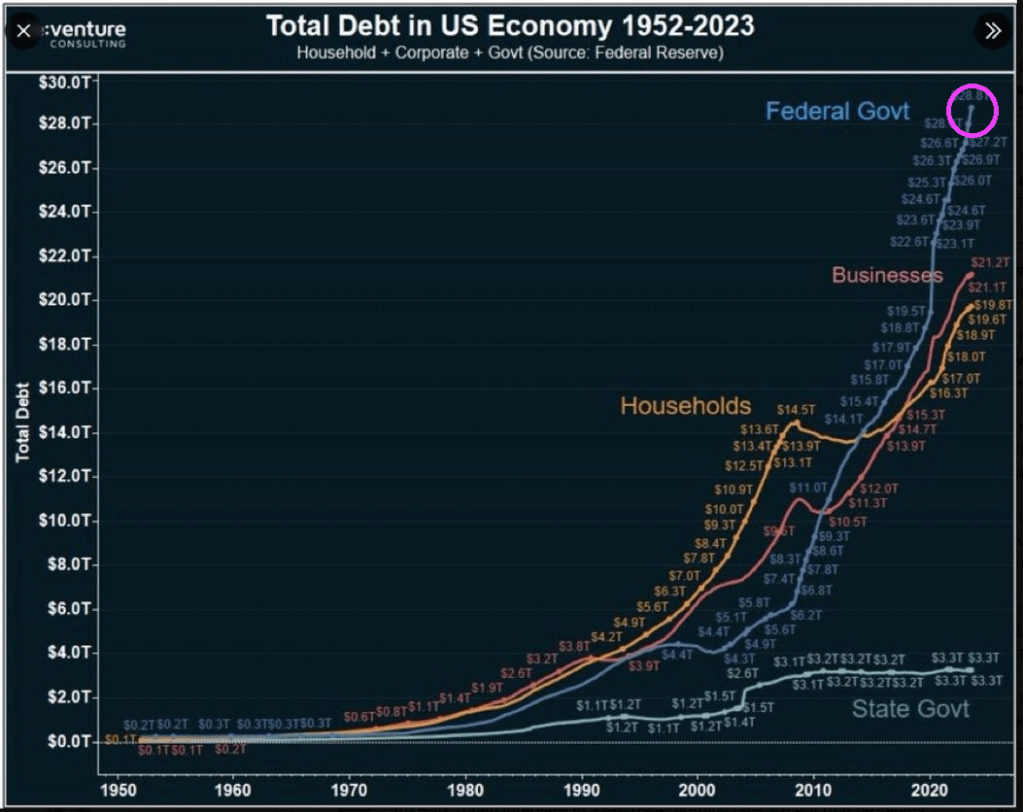
Both the US Federal government and California’s government are facing a fiscal inferno. Thanks to a softening economy and inane fiscal policies.
At the macro level, we see that The Federal government has gone wild spending money and borrowing it. Much more than businesses and households. Biden’s wild spending reduces the degrees of freedom that Treasury has if the US slips into another recession or depression.
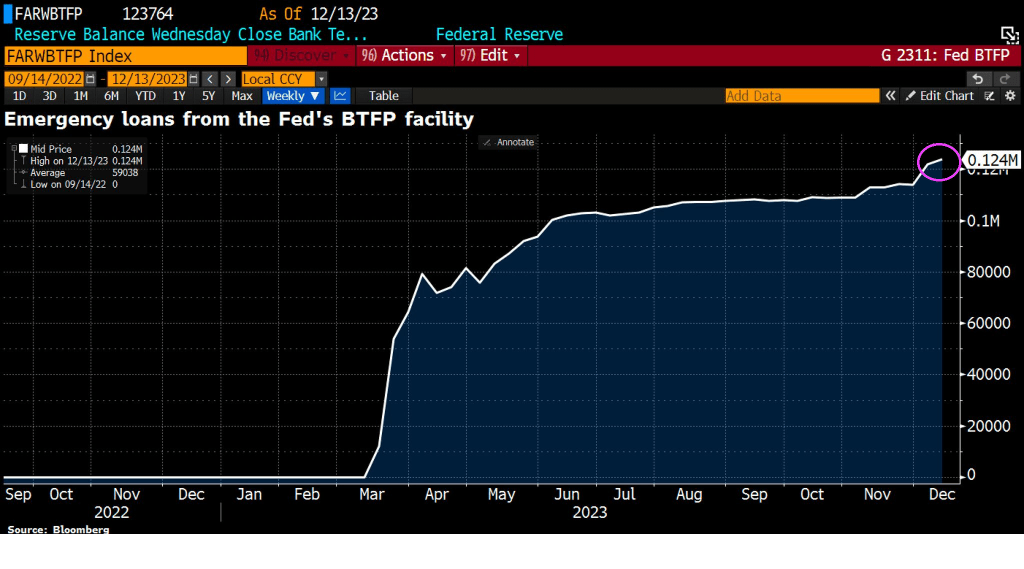
First, let’s begin with banks to illustrate the worsening condition of the economy. Emergency loans from The Fed’s Bank Term Funding Program (BTFP) is on the rise, signaling perceived trouble in the economy.
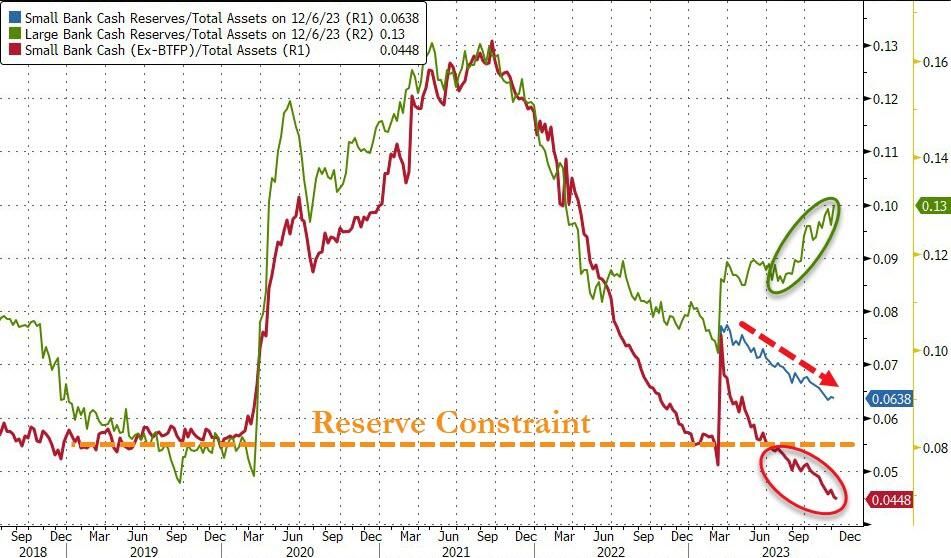
Small banks are suffering more than big banks.
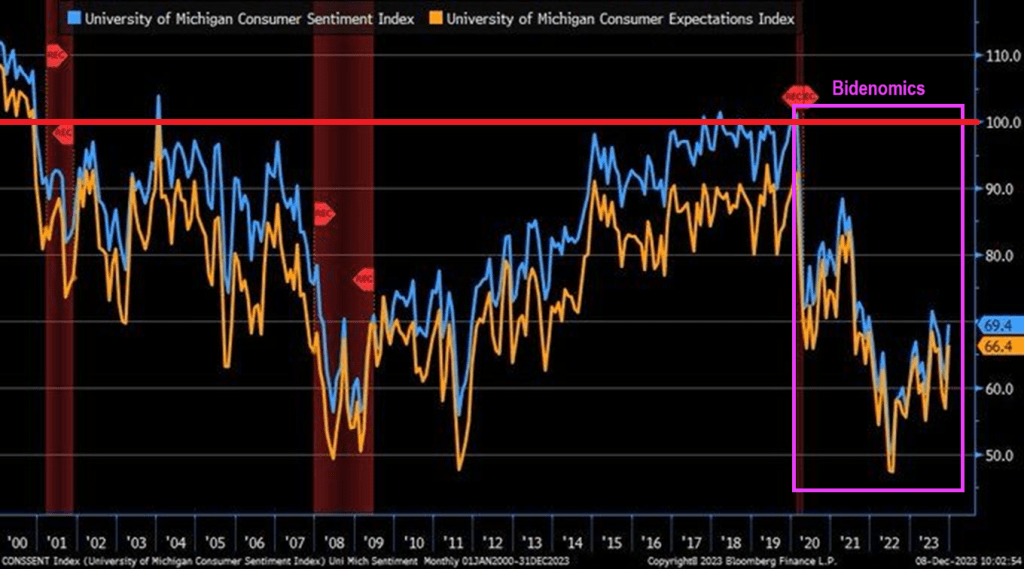
Consumer sentiment is below 70 (100 baseline) under Biden and Bidenomics.
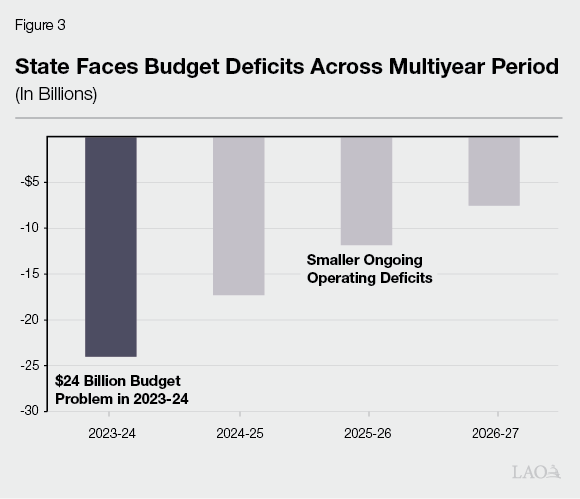
And then we have Gavin “Gruesome” Newsom and California. California is now facing a $68 billion deficit. It has also defaulted on a $20 billion loan from the federal government. The situation is so dire the state is telling agencies not to replace broken printers or re-stock office supplies. Workers are being stripped of benefits and could face furloughs. This is all happening as the state has spent billions funding High-Speed Rail and expanding Medi-Cal to all undocumented immigrants, while losing billions in tax revenue from people leaving the state.
$68 billion is over twice this forecast deficit of $24 billion.
But never fear. “Billions Biden” will make sure California is okay, ar least until the 2024 Presidential election.
Traders and investors must spend precious time deciphering them. For those who wouldn’t mind a break from this parlor game, there are some markets that don’t march to the beat of the global policy cycle, and offer diversification benefits for portfolios.
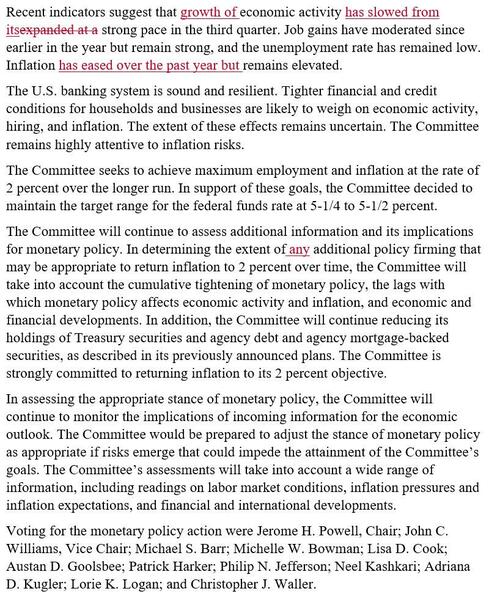
The game was in full flow at Wednesday’s Federal Reserve meeting, as the central bank patiently unpicked the higher-for-longer stitching it had spent many months carefully inculcating in the market.
Anyone who had listened to it on financial conditions, keeping rates restrictive for an extended period, or who thought Powell meant it when he implied he was a Paul Volcker and not an Arthur Burns, is now left trying to figure out if the Fed’s reaction function has indeed changed.
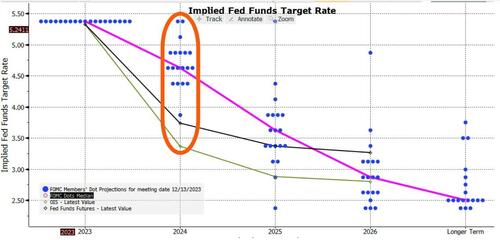
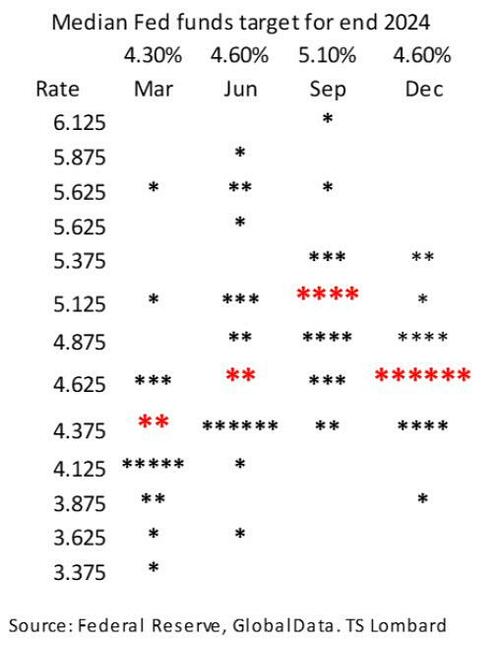
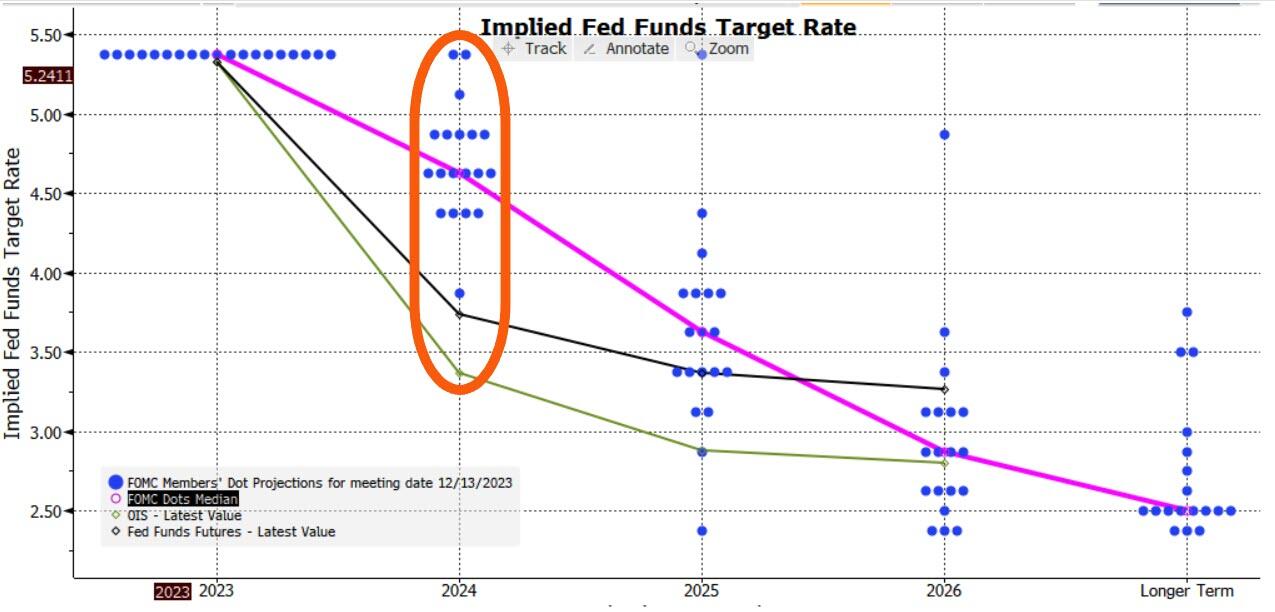
Adding confusion to the game are the dots. They reinforced the dovish message, with the median dot implying three cuts next year versus two back in September.
But with one dot implying six cuts, two implying none and the rest all spread in between, this isn’t exactly sure-footed clarity.
It’ll be repeated again today with the ECB, BOE, the SNB and the Norges Bank all meeting to set rates (the SNB held rates steady and the Norges unexpectedly hiked). For those who can trade only G7 markets, there is not much choice but to play the game.
However, for those looking for markets less reliant on the Delphic utterances of central bankers, there are other options.
The problem is that most bond markets tend to be quite alike over the medium-to-longer term.
Interest rate cycles are typically quite synchronized (with the US the most influential), and capital can flow freely around most of the world.
To show the broad uniformity of bond markets we use a statistical tool called principal component analysis.
PCA is a way of making sense of large data sets. For instance, a retailer may have reams of data on how users use its website: how long they spend on it, which pages they visit, where they hover their mouse, etc. PCA will tell you which input – or combination of inputs – has the greatest explanatory power in determining the total time users spend on the website (something they would want to maximize).
Using PCA on yields from 40 countries, we can show that over half of global bond market moves are described by just one factor.
This not a trivial result. It means we could replace our data on 40 bond markets by this one component and it would capture more than half of the variance of the individual yields.
A bond market that was similar to this component would therefore be a good proxy for the global bond market. However, as the mathematician Carl Jacobi advised, we should always invert. A more interesting question is: which bond markets look least like this factor?
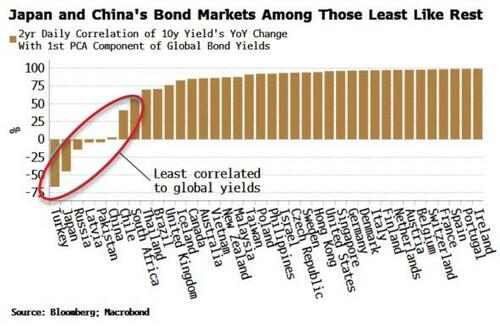
The chart below shows how each of the 40 bond markets are correlated to the first PCA factor. Most have a high correlation – more than 75% – but what stands out is the handful of markets with a low or negative correlation.
Japan and Turkey are among those with a negative correlation, while China’s correlation is close to zero.
This is intuitive.
Japan has been running a deliberately counter-cyclical monetary policy, while Turkey until recently was running a through-the-looking-glass one, cutting rates in the face of rampant inflation. And China’s economy is in deflation, at odds with every other major DM and EM country.
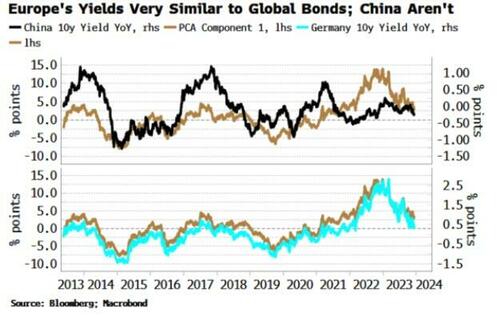
The above analysis provides analytical backing for the intuition that Japan et al have provided diversification for global bond portfolios in recent years, while most other markets, e.g. Europe, the US, Australia, New Zealand, etc are low-resolution facsimiles of each other and therefore have delivered few diversification benefits.
Of course, there will be other things to consider before adding a country’s bond index to a portfolio, such as how overbought or oversold it is, how liquid it is, the expected stance of the central bank, and so on.
But if the correlations persist, such a market should produce a more resilient and lower-volatility bond portfolio.
We can extend this analysis to look at stocks.
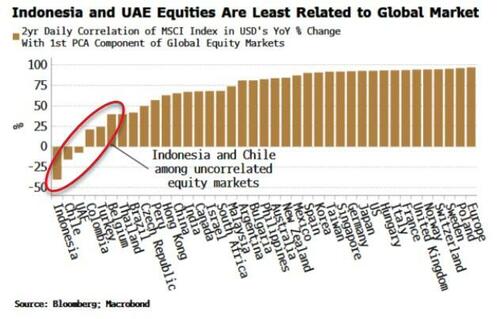
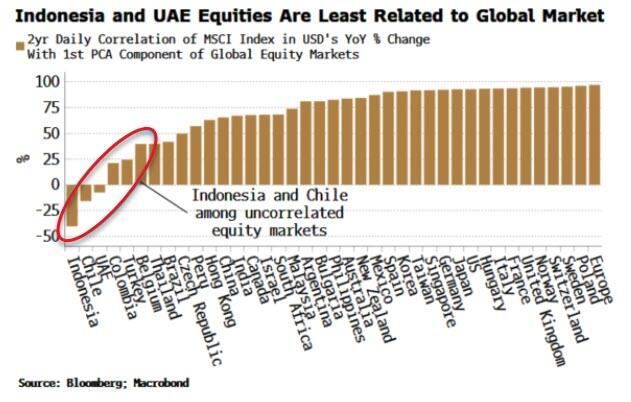
Global equity markets are even more similar to one another than bond markets, with the first component explaining 60% of the total move. Nonetheless, applying PCA offers up some portfolio diversification candidates (using as our data set MSCI country indices in USD).
Indeed, it can be shown that the first PCA component of equity markets is highly correlated to the US’s manufacturing ISM, elegantly demonstrating that in large part global stocks are driven by macro.
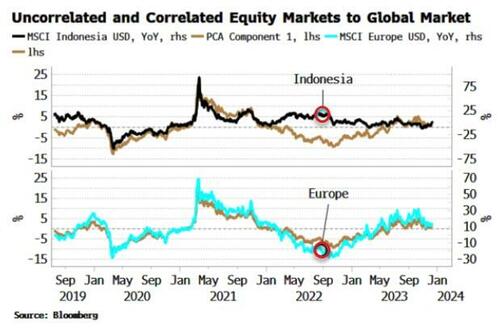
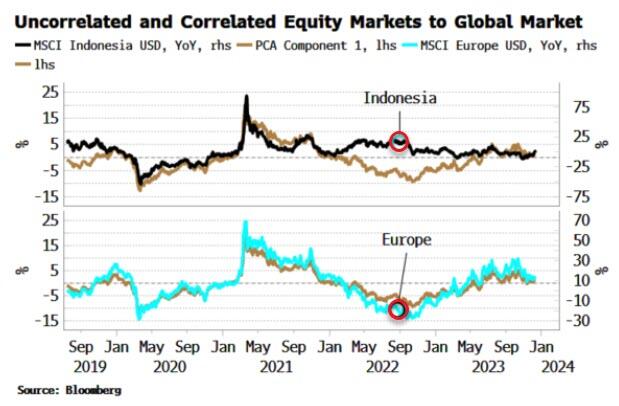
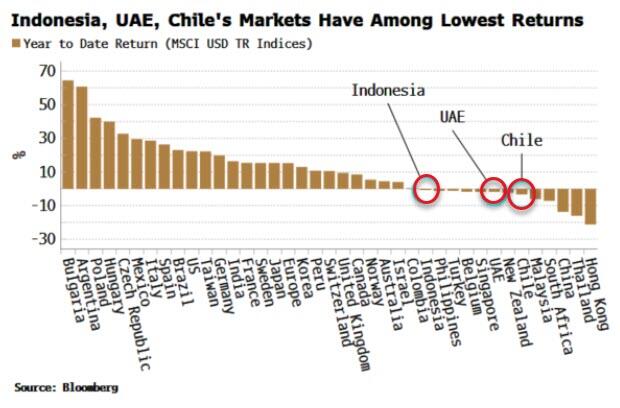
Indonesia, UAE and Chile’s stock markets are all negatively correlated to the global equity move, and therefore the global macro cycle, while European markets move almost in lockstep with it. As the chart below shows, Indonesia’s market (white line) remained supported in late 2022/23, as its market bottomed in July 2022 and rallied through, while other markets went on to make a new low in October of that year.
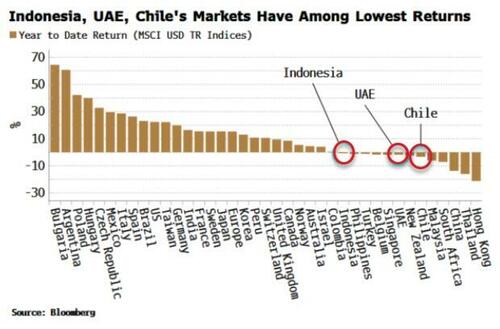
Indonesia et al also have had among the lowest returns of all global equity markets this year. It is relatively common for the markets that are among the worst performers one year to be the among the top the following year.
We can complete the analysis by looking at commodities.
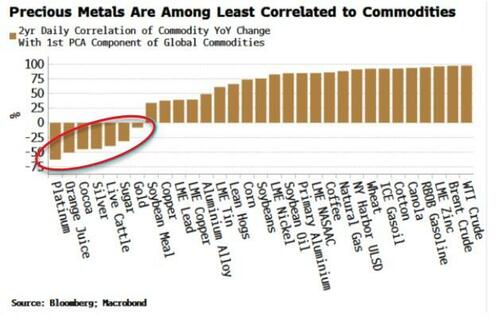
The first PCA component here explains about half the move of all commodities, a similar proportion to global bond markets. PCA shows that precious metals, such as gold, silver and platinum are the most negatively correlated to commodities.
As almost all commodities are traded in dollars, the first component is quite similar to the DXY.
So to some extent we are asking which commodities are most negatively correlated to the dollar. Precious metals typically exhibit a more negative dollar correlation than most other commodities. Further, in the current environment they should offer some protection against inflation.
The lack of variation among macro-driven markets makes portfolio investment challenging as it is easier to add risk rather than uncorrelated factors.
The above PCA analysis shows that Japanese bonds, Indonesian equities and platinum are examples of assets that may confer some diversification advantages for global portfolios.
At the very least, you may not have to pay as much attention to central bankers.
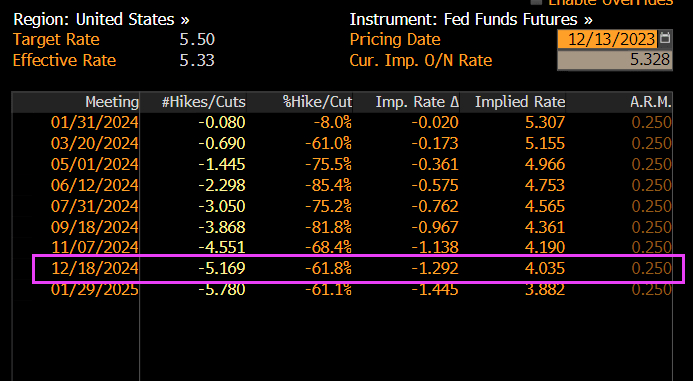
… it was the dot plot, where the median 2024 dot plot now forecasts 3 rate cuts up from 2, that shocked traders: in a very rare admission by the Fed, the central bank confirmed that the pre-meeting market pricing of multiple cuts in 2024 were correct in interpreting the Fed’s intentions. It also confirmed – yet again – that the market was right and every single FOMC member was wrong. In retrospect, none of this should have been a shock.
Commenting on the dot plot, TS Lombard’s Steven Blitz said that “for a group that prizes the pricing of its policy intentions in the forward markets as being more important to shifting market conditions than the spot rate, they h d to know that moving the median forecast for Fed funds at the end of 2024 back to June levels would be a bullish signal.“
Or maybe concerns about the market’s reaction were of secondary importance to a Fed which had gotten the tap on the shoulder by the Biden admin and its Democratic cronies on the Hill, terrified about their re-election chances now that the snake of Identity Politics is finally eating its poisonous tail. Indeed, almost as if having seen the collapse in the recent approval polls, Biden’s handlers made some very persuasive phone calls to the Fed. After all, only something as ridiculous – and serious – as steady political pressure can explain the unprecedented U-Turn by the Fed chair, one which even shocked Powell’s own mouthpiece, Nikileaks, who commented on the “Powell pivot” saying “what a difference two weeks can make.”
But markets are behaving as if The Fed will begin cutting rates. Look at the US 2-year Treasury yield on Wednesday AFTER the Fed minutes were released.
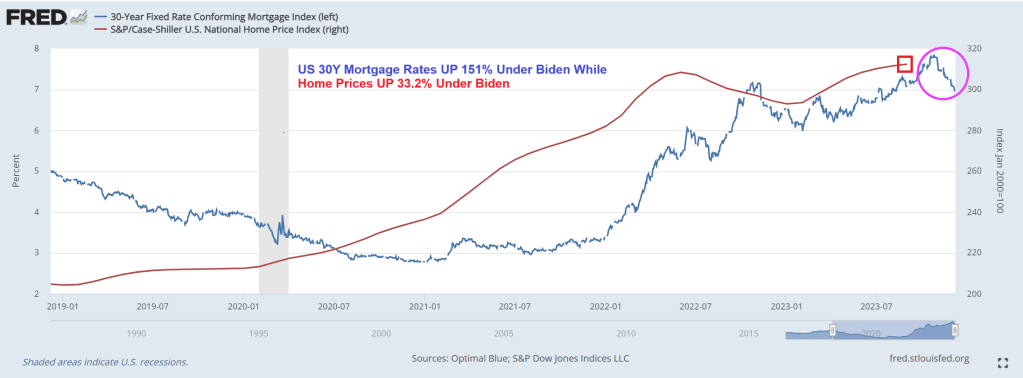
Bear in mind that mortgage rates are up 149% under Biden. And mortgage payments up 88%. Yikes!
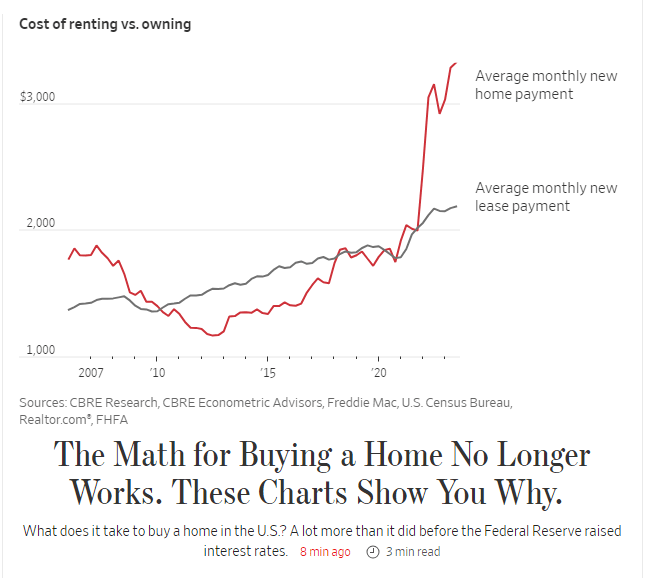
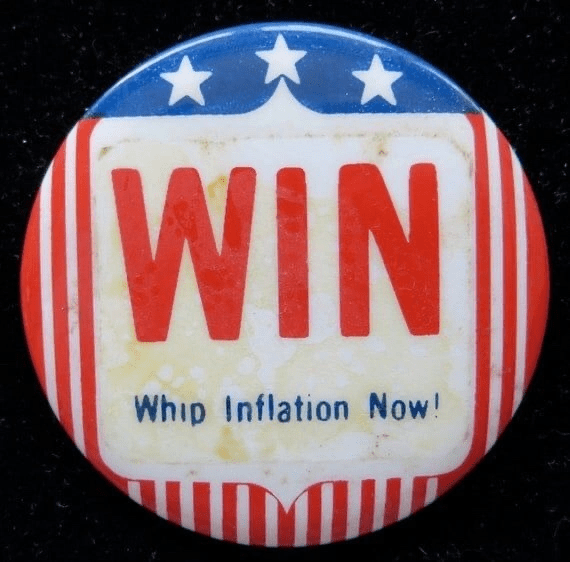
President Gerald For (R-MI) might be best known for his silly attempt at “whip inflation NOW” by having “Music Man” Meredith Wilson write a song: “Whip Inflation Now!” But the second line has been forgotten: “Eat crow instead of cow.” That second line is appropriate for Bidenomics which has left America’s middle class eating crow in the housing market.
The Wall Street Journal had an interesting piece showing the rise of 30-year fixed rate mortgage payments under Biden where the average monthly new mortgage payment is now $3,222, up from $1,787, up 86%!
The 86% rise in mortgage payments is two fold. First, home prices are up 33.2% under Biden and the 30-year mortgage rate is up 181%.
Yes, Americans are eating crow under the utter failure known as Bidenomics: top down government mandates for massive green energy and other nonsense.
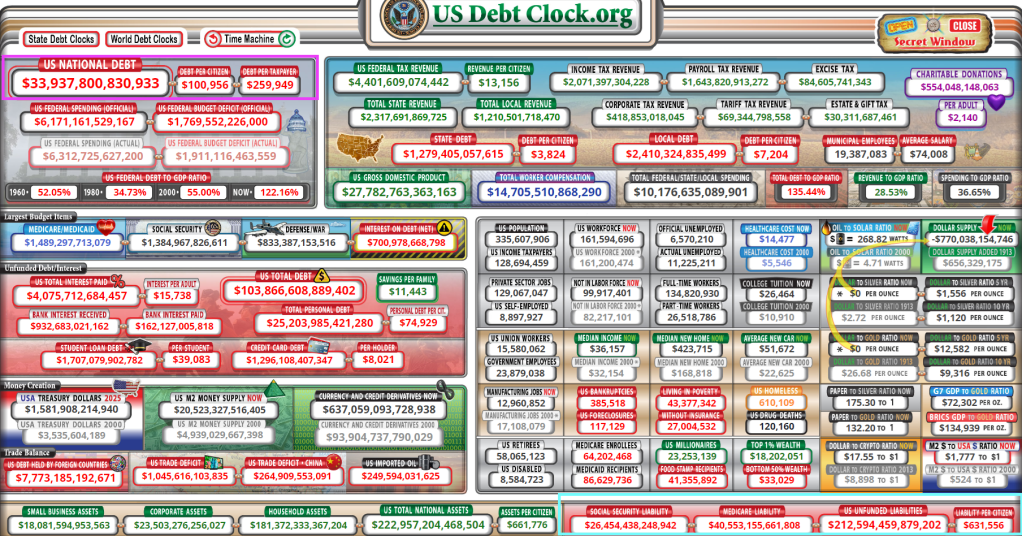
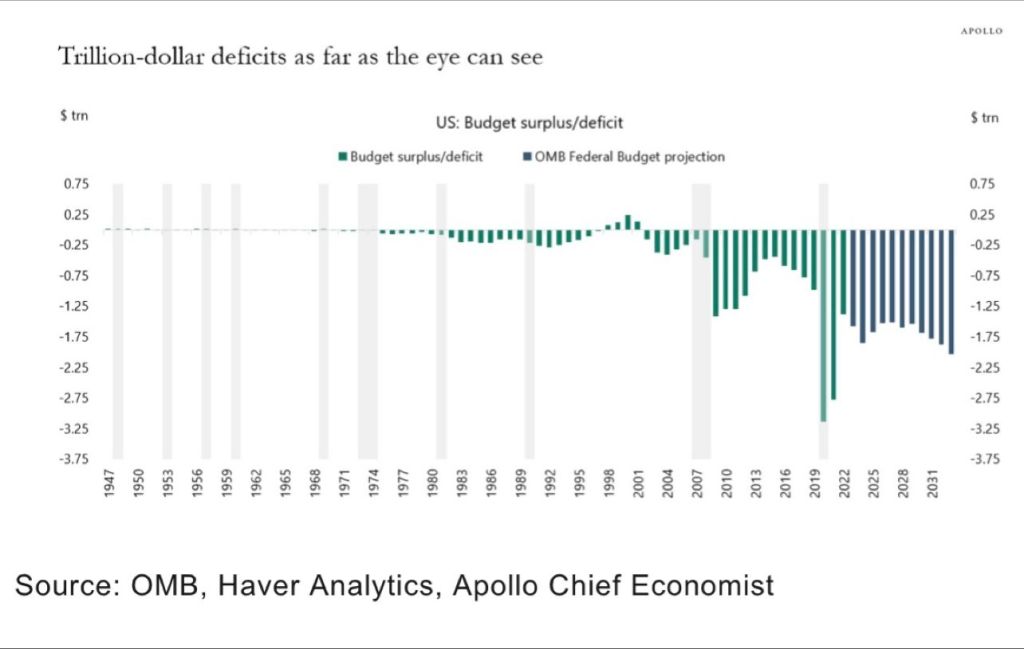
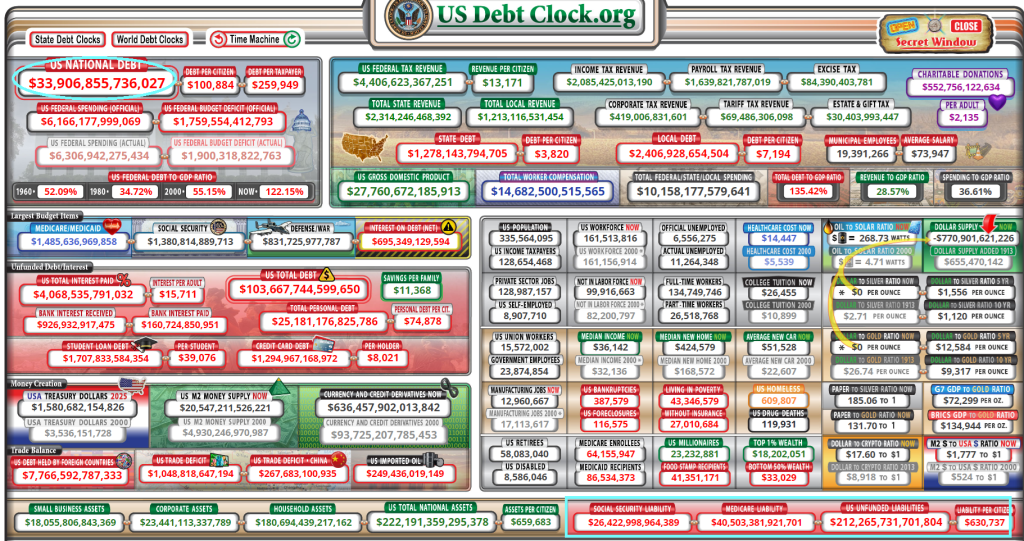
We are on a Highway To Hell! Massive Federal Budget deficits and staggering payments to Treasury from The Fed (losses on balance sheet) and $212 TRILLION in unfunded promises to the non-elites.
Under Modern Monetary Theory (or print money without consequences), we are seeing trillion dollars budget deficits with no end in sight. Nothing has been the same since the financial crisis of 2008 with The Fed’s massive intervention.
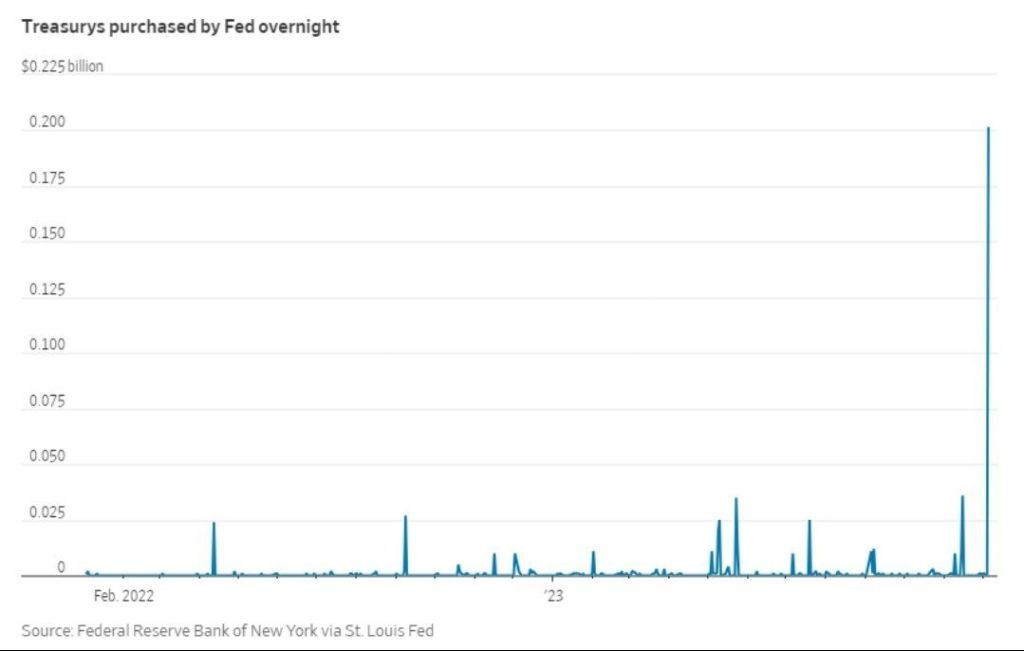
Then we have The Fed paying an ever growing amount to US Treasury for losses on their huge balance sheet.


You must be logged in to post a comment.