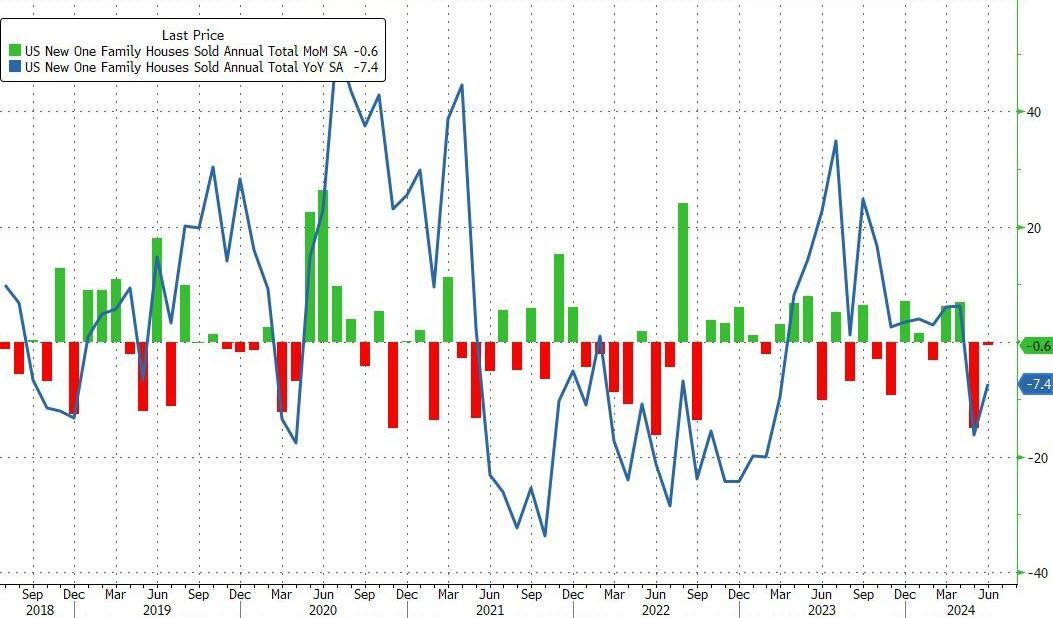
After a disappointing dump in existing home sales in June, new home sales just confirmed the slowdown, dropping 0.6% MoM (notably below the 3.4% MoM expected) and also saw a major downward revision in May from -11.3% MoM to -14.9% MoM. That leaves new home sales down 7.4% YoY…
Source: Bloomberg
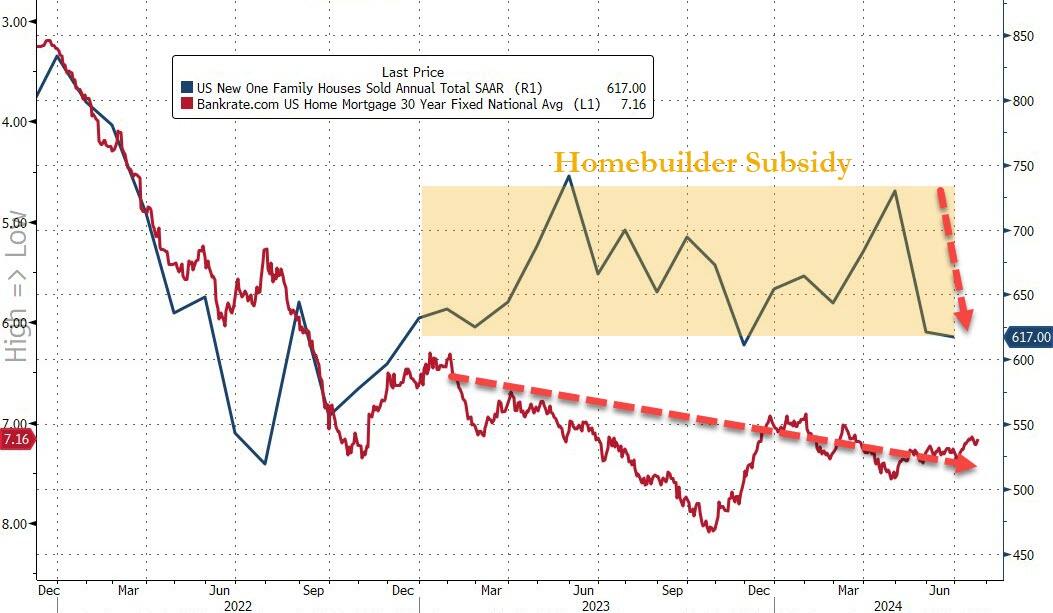
That shift dragged the new home sales SAAR down to 617k – basically unchanged since 2016…
Source: Bloomberg
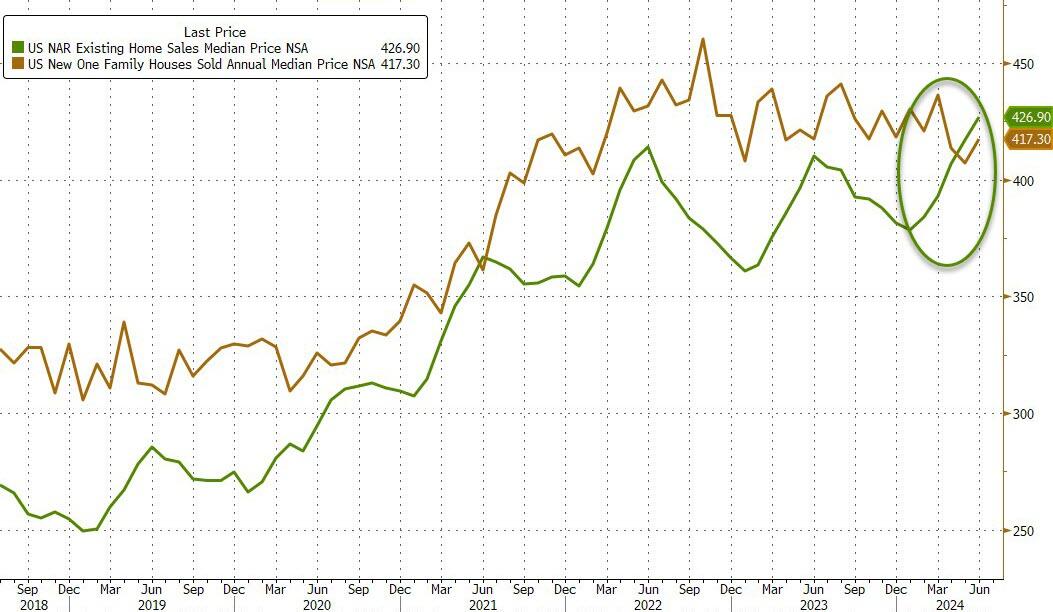
While the median new home price rose in June, it remains below the median existing home price…
Source: Bloomberg
It appears the homebuilder subsidy fad is wearing off as mortgage rates show no signs of easing significantly…
Source: Bloomberg
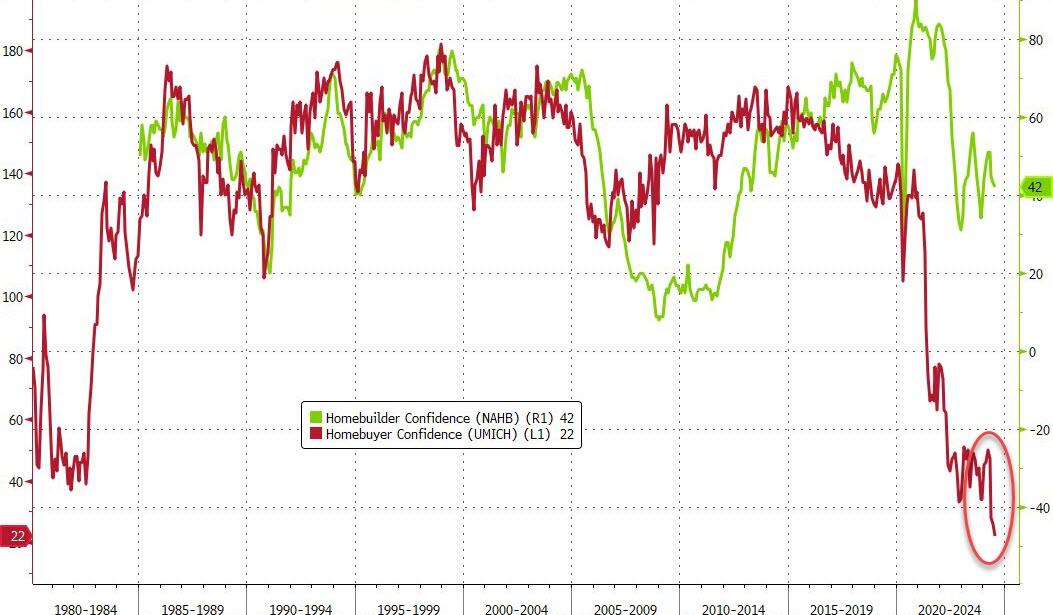
Of course, none of this should be a surprise as homebuyer confidence has collapsed to an all-time record low…
Source: Bloomberg
Will cutting rates help?
Probably not. Bidenomics is now called Harrisnomics (or Cacklenomics) since Harris as VP was the tiereaker in the US Senate. So, she holds some responsibility for the outrageous, wasteful spending in Washington DC.
Here is a chart of Non-commerciak net positions for US Treasuries, currently showing more bailing out of Treasury positions. Has the world sours on DC’s fiscal train wreck and The Fed?
Of course, budget deficits are a disaster with Biden/Congress spending like drunken sailors in port and showing no signs of letting up. The good news? At least a court struck down Biden’s illegal cancelation of student debt (a desperate attempt to win votes). That would have spiked the budget deficit.
As I pointed out yesterday, the UNFUNDED entitlements promised by the Federal government are now larger than that total national assets (business, household). In other words, if the US liquidated ALL assets, they couldn’t pay off the UNFUNDED entitlements. And good luck taking away the entitlements!
President Biden was expected yesterday to propose a cap of 5% on annual rent increases for tenants of major apartment landlords, and he did. Whether it can happen is something else.
As the White House communicatedon Tuesday, the administration is looking for Congress to pass legislation for landlords with more than 50 units in their portfolios, that being the proxy for institutional owners, although it would also affect private investors, family offices, and others that might own at least that many units. According to administration calculations, the total pool would cover 20 million rental units.
The law would then give landlords a choice. They could either restrict annual rent increases to no more than 5% a year or they would forfeit the ability to take fast depreciation of rental housing. There would be an exception for new construction or “substantial renovation or rehabilitation.”
Are you ready? You can tell an election is on the radar since inflation numbers are settling down for the most part. According to the BLS, overall inflation fell slightly in June to 3.0%.
Shelter CPI is up 5.14% YoY as M2 Money growth has been rising slowly … again.
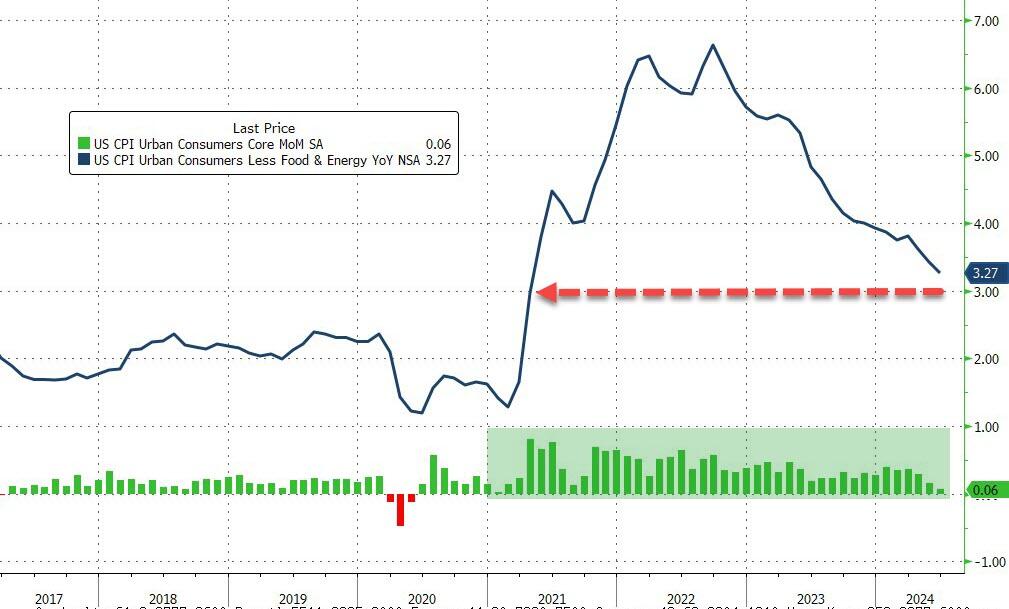
Core CPI also ‘missed’, rising just 0.1% MoM (vs +0.2% exp), dragging the YoY Core CPI down to +3.27% – its lowest since April 2021…
Source: Bloomberg
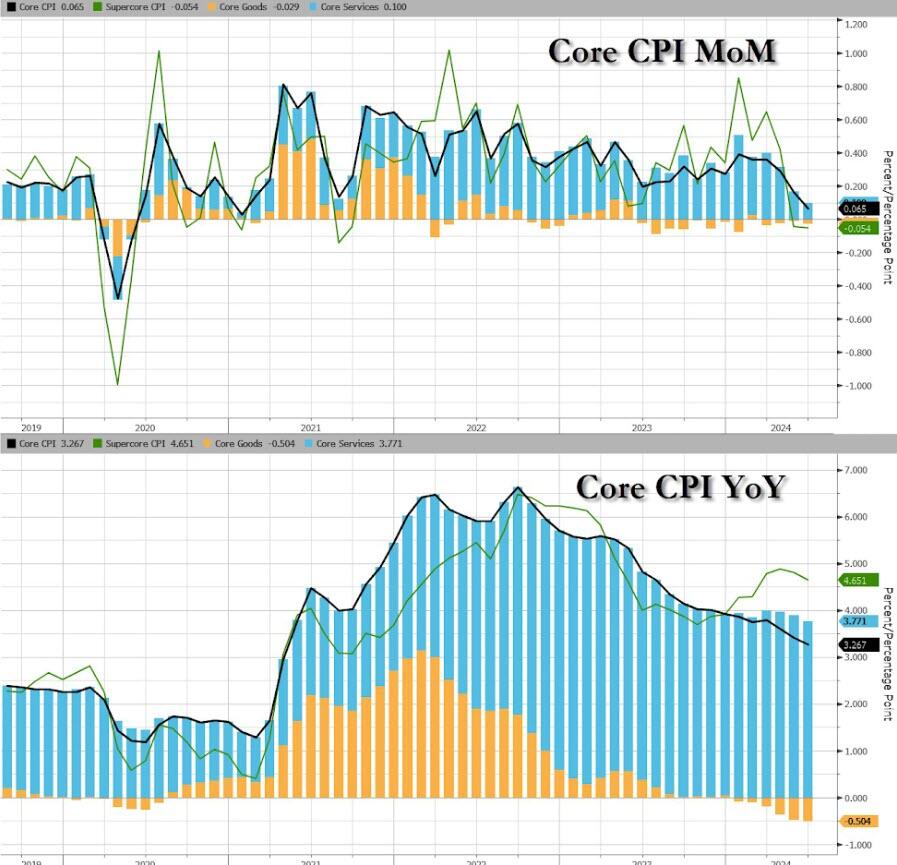
Goods deflation also dominates core prices disinflationary trend…
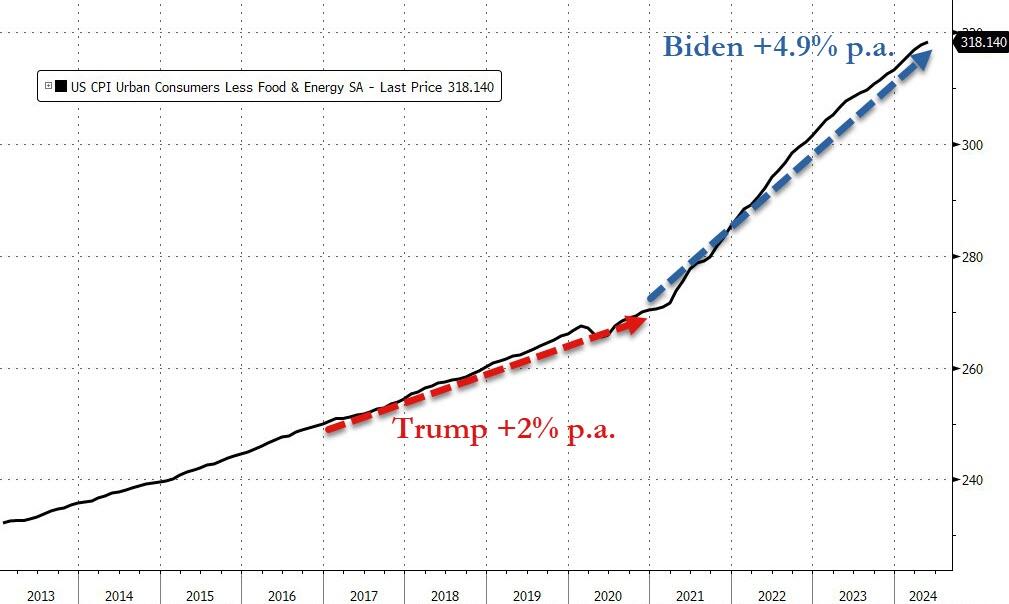
We do note that Core consumer prices have still not seen a single monthly decline since Bidenomics began.
Core consumer prices are up just under 18% since Bidenomics began (+4.9% per annum) – that is dramatically higher than the 2.0% per annum Americans experienced under Trump…
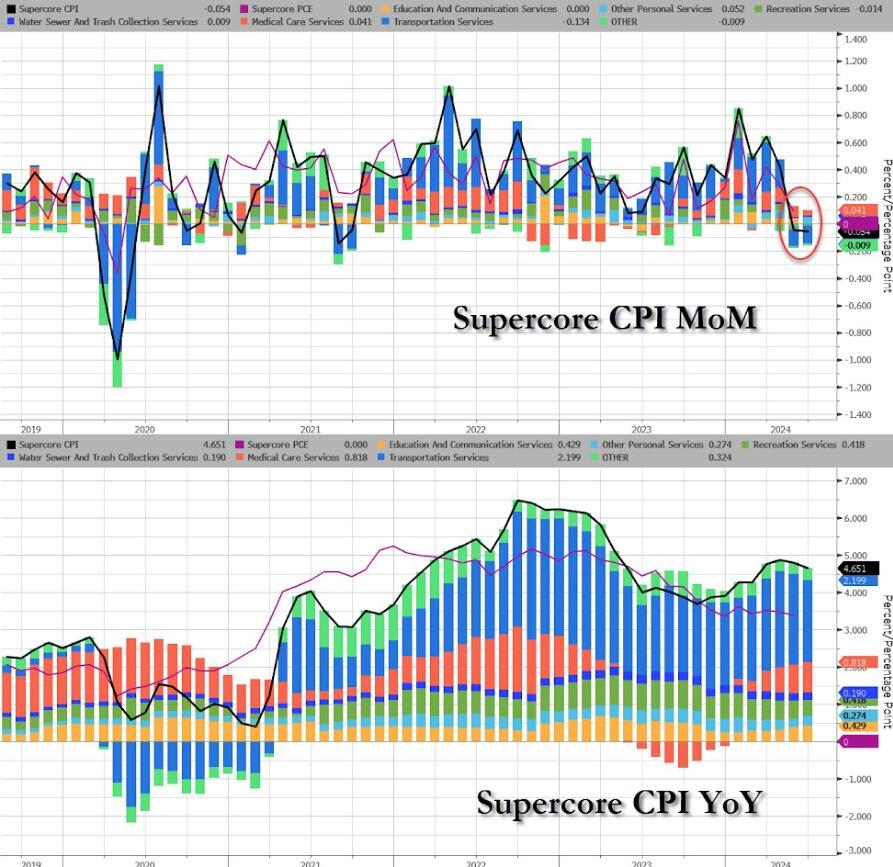
The much-watched SuperCore CPI rose on a MoM basis but declined (back below 5.0%) on a YoY basis (but obviously remains extremely elevated)…
Source: Bloomberg
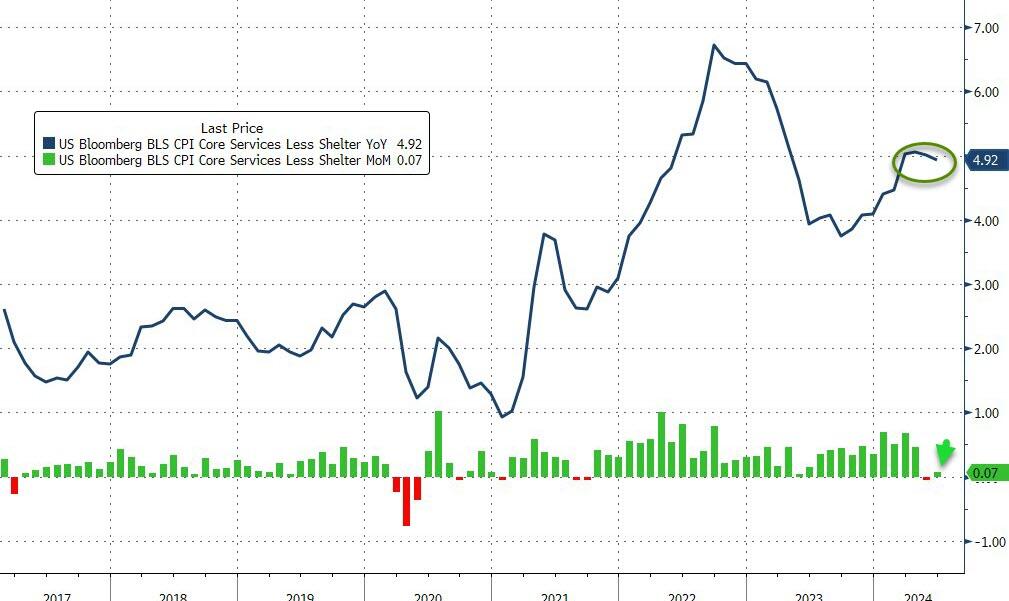
Transportation Services are seeing prices fall…
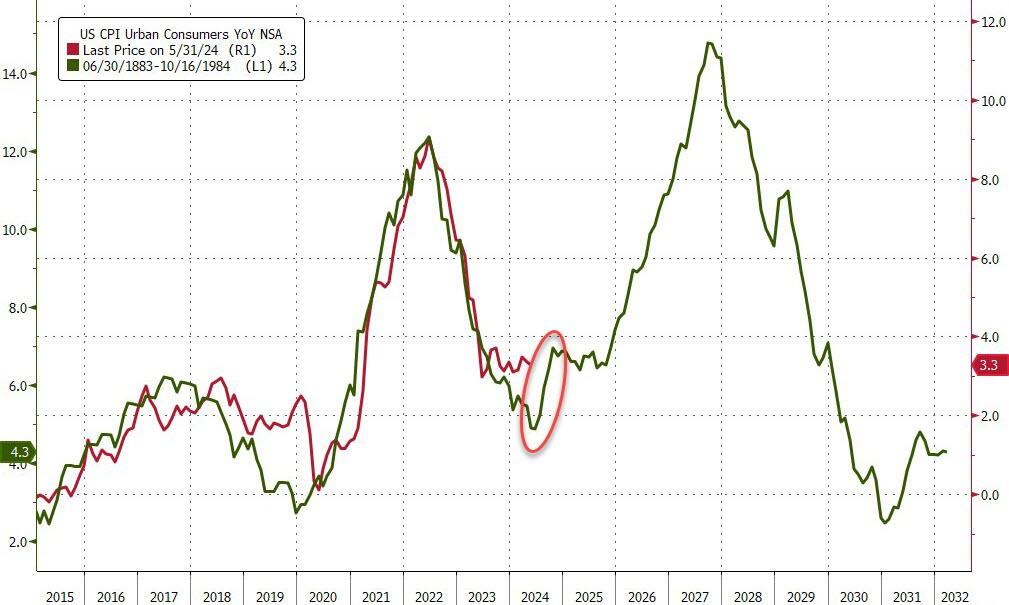
Finally, we can’t help but get a sense of deja vu all over again here. What if… The Fed cuts (because bad – recession – data), Biden loses (because dementia), and inflation re-accelerates (just like in the 80s)…
Source: Bloomberg
Challenger job cuts in construction we the highest since 2008 putting downward pressure on wages.
Like a bad “good news, bad news” joke,. June employment numbers are out from the Feral governement. The good news? Jobs added increased by 206k, more than expected.
The bad news? The unemployment rate hit 4.1%, the highest in 3 years.
Meanwhile, 1/3rd of jobs created were NON-PRODUCTIVE government jobs.
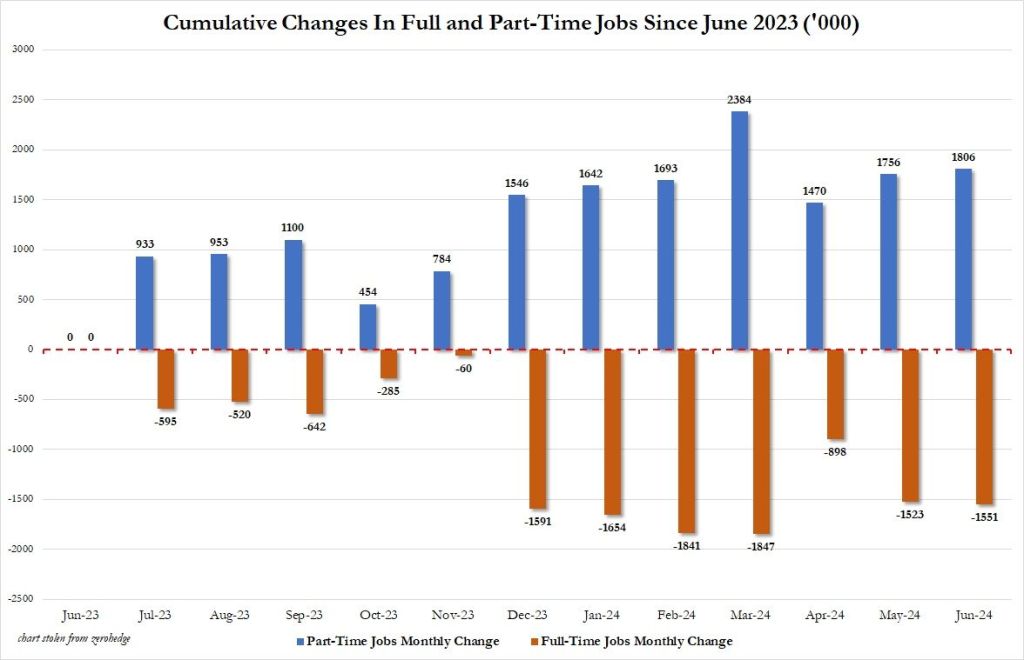
Since June 2023, the US has added 1.8 million part-time jobs and lost 1.6 million full time jobs.
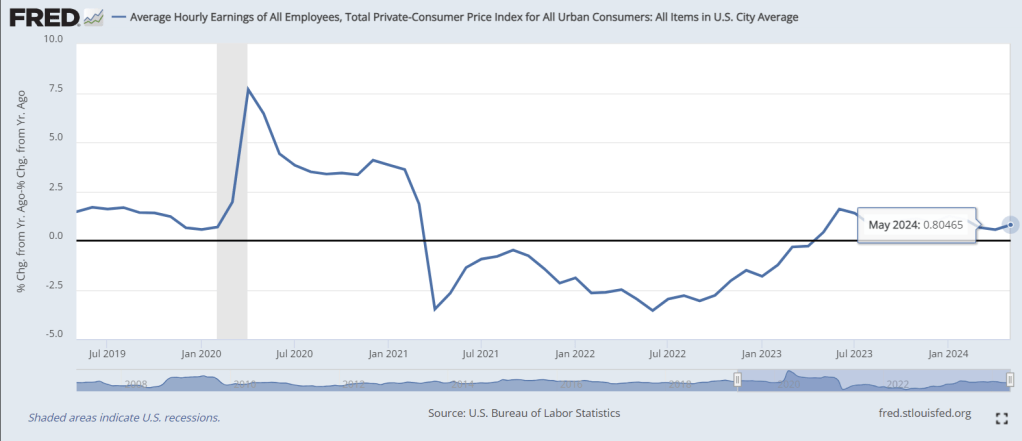
While nominal wage growth grew, REAL wage growth rose a measly 0.8% YoY.
The share of total new worth held by the top 1% is 30.4% while the total net worth held by the bottom 50% is a measly 2.5%.
So much for politicians’ promises to make everyone equal in wealth! Oddly, they keep getting wealthier and the bottom 50% keep losing ground.
During the first three months of 2023, U.S. office vacancy topped 20 percent for the first time in decades. In San Francisco, Dallas, and Houston, vacancy rates are as high as 25 percent. These figures understate the severity of the crisis because they only cover spaces that are no longer leased. Most office leases were signed before the pandemic and have yet to come up for renewal. Actual office use points to a further decrease in demand. Attendance in the 10 largest business districts is still below 50 percent of its pre-COVID level, as white-collar employees spend an estimated 28 percent of their workdays at home.
A new report from Moody’s offers yet another grim outlook that the commercial real estate downturn is nowhere near the bottom. Elevated interest rates and persistent remote and hybrid working trends could result in around 24% of all office towers standing vacant within the next two years. The office tower apocalypse will result in more depressed values that will only pressure landlords.
“Combining these insights, with our more than 40 years of historic office performance data, as well as future employment projections, our model indicates that the impact on office demand from work from home will be around 14% on average across a 63- month period, resulting in vacancy rates that peak in early 2026 at approximately 24% nationally,” Moody’s analysts Todd Metcalfe, Anthony Spinelli, and Thomas LaSalvia wrote in the report.
In a separate report, Tom LaSalvia, Moody’s head of CRE economics, wrote that the office vacancy rate’s move from 19.8% in the first quarter of this year to the expected 24% by 2026 could reduce revenue for office landlords by between $8 billion and $10 billion. Factor in lower rents and higher costs, this may translate into “property value destruction” in the range of a quarter-trillion dollars.
In addition to remote working trends, Moody’s analysts pointed out that the amount of office space per worker has been in a “general downward trend for decades.”
At the peak of the Dot-Com boom, office workers used an average of 190 sq ft. The figure has since slid to 155 sq ft in 2023.
“The argument for maintaining or even increasing remote work practices remains compelling for many businesses,” the analysts said, adding, “If productivity remains stable and costs can be reduced by forgoing physical office spaces, the rationale for mandating in-office attendance diminishes.”
Related research from the McKinsey Global Institute forecasts that office property values will plummet by $800 billion to $1.3 trillion by the decade’s end.
Moody’s expects vacancy rates to top out as office towers are demolished or converted to residential ones in the coming years.
“Right-sizing will continue over the next decade as the market shakes out less efficient space for flexible floorplans that support our relatively new working habits,” they said.
Earlier this year, Goldman analyst Jan Hatzius pointed out that a further 50% price decline would make office tower conversions financially sensible.
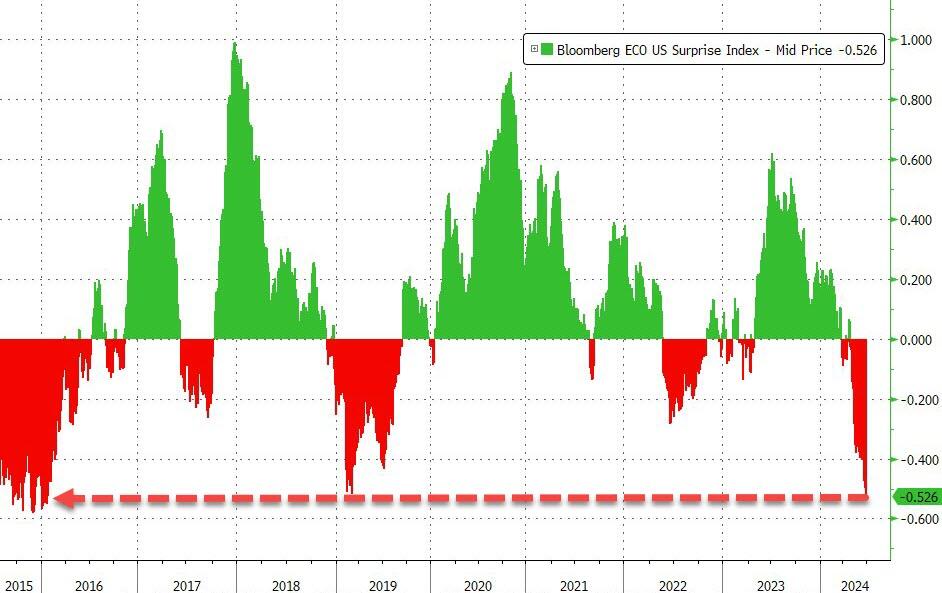
…which, many believe, will also drag down inflation (and it has been)…
Source: Bloomberg
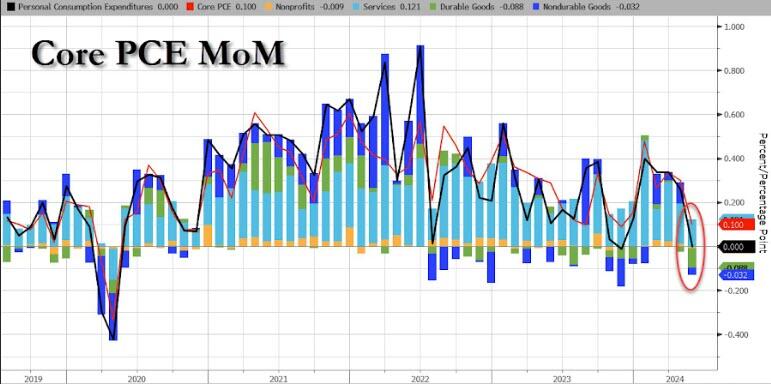
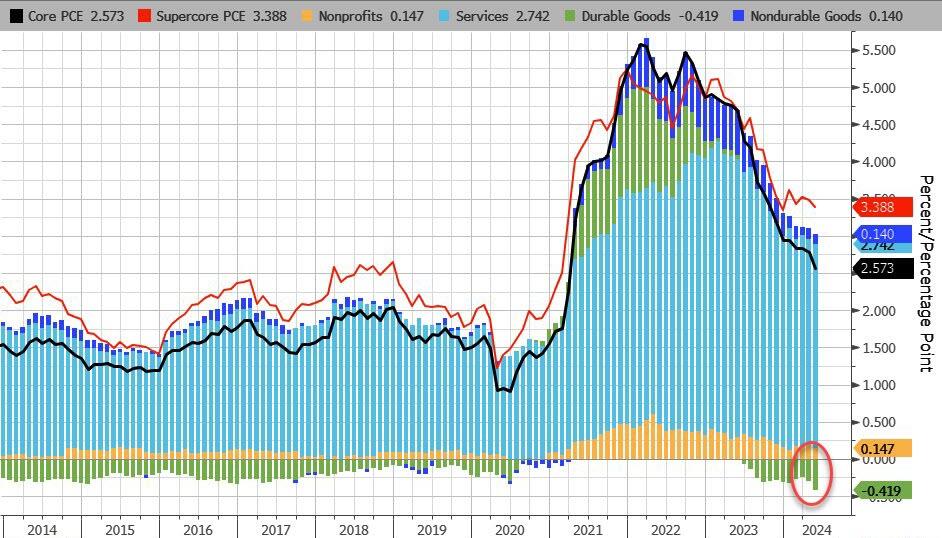
Today, we get to see The Fed’s favorite inflation indicator – Core PCE – which rose 0.1% MoM in May (after a revised +0.3% MoM for April) and in line with expectations. The headline PCE Price Index was unchanged MoM as expected as Durable Goods deflation trumped surging Services costs…
Source: Bloomberg
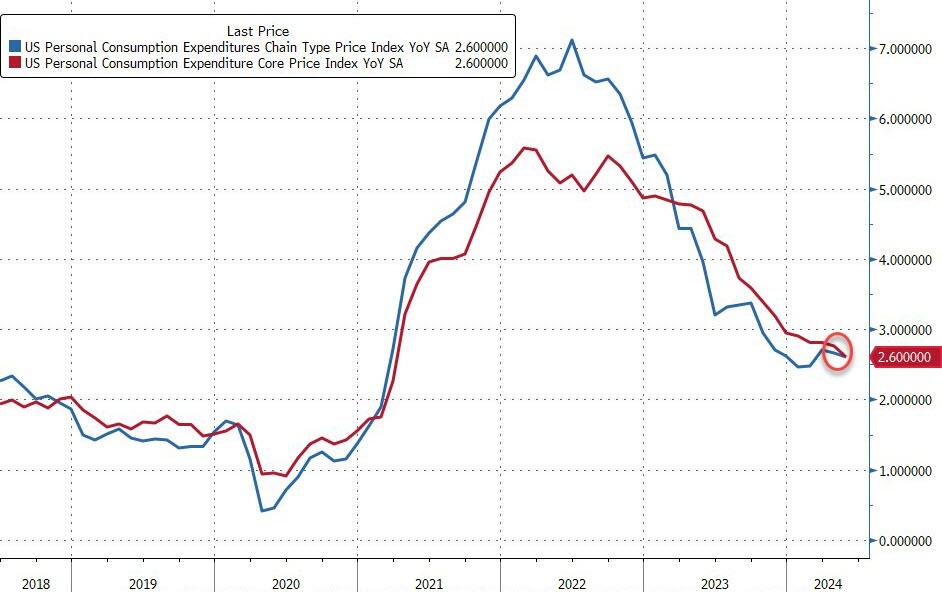
On a YoY basis, both headline and core PCE declined…
Source: Bloomberg
On a YoY basis, Durable Goods deflation is at its strongest in at least a decade…
Source: Bloomberg
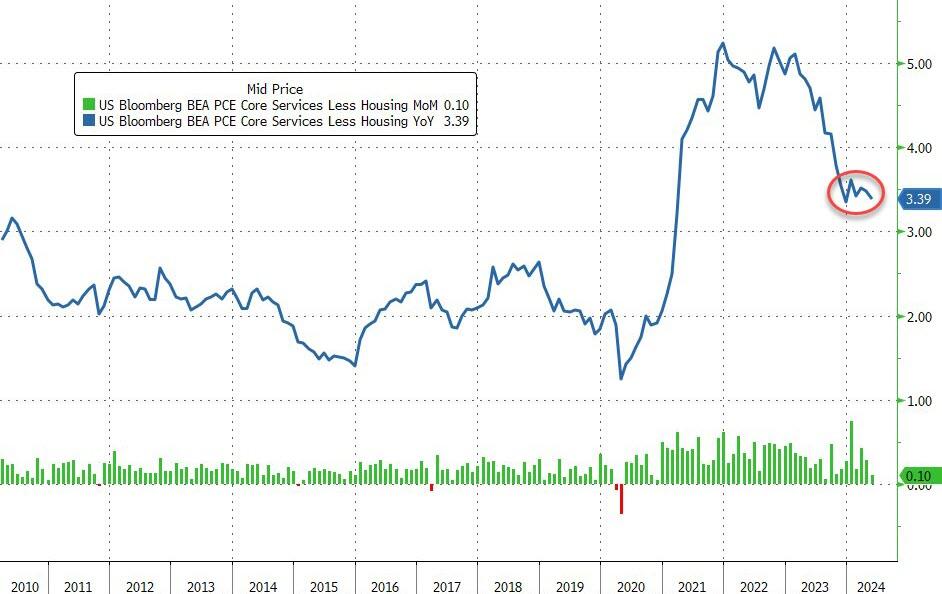
More notably, the so-called SuperCore PCE rose 0.1% MoM, which saw YoY slow to 3.39%… which is awkwardly stagnant at elevated levels…
Source: Bloomberg
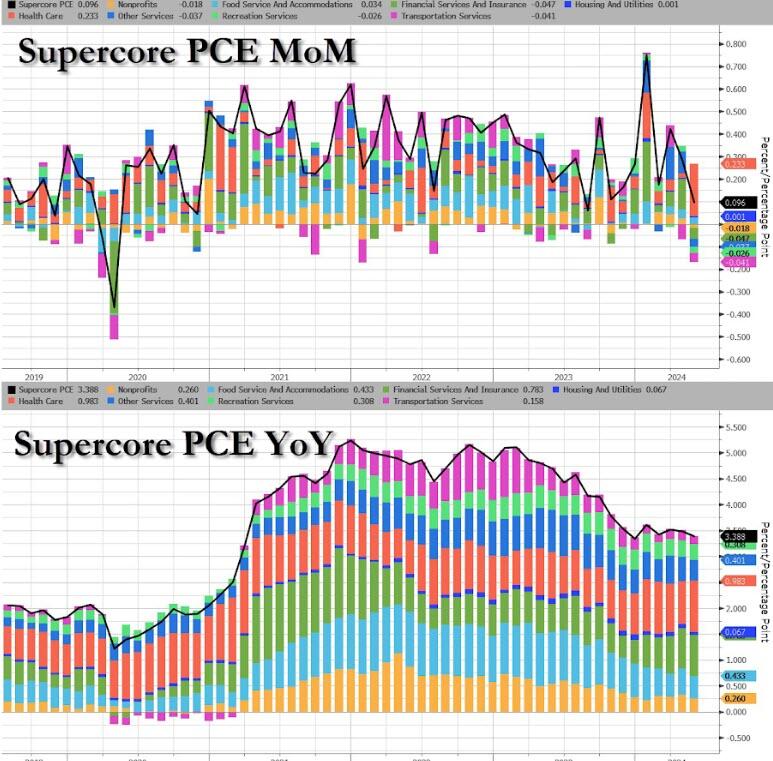
That is the 49th straight monthly rise in SuperCore prices with Healthcare costs soaring…
Source: Bloomberg
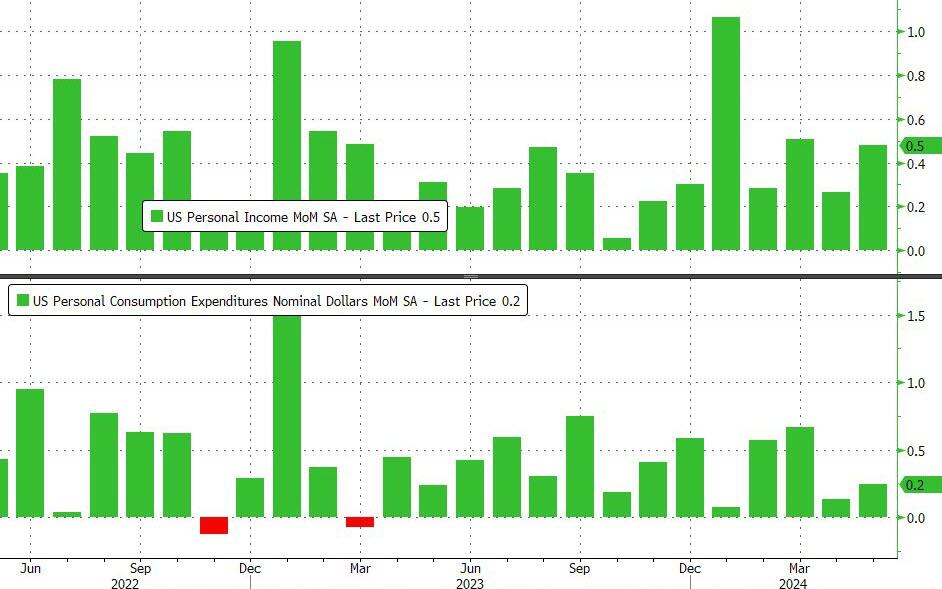
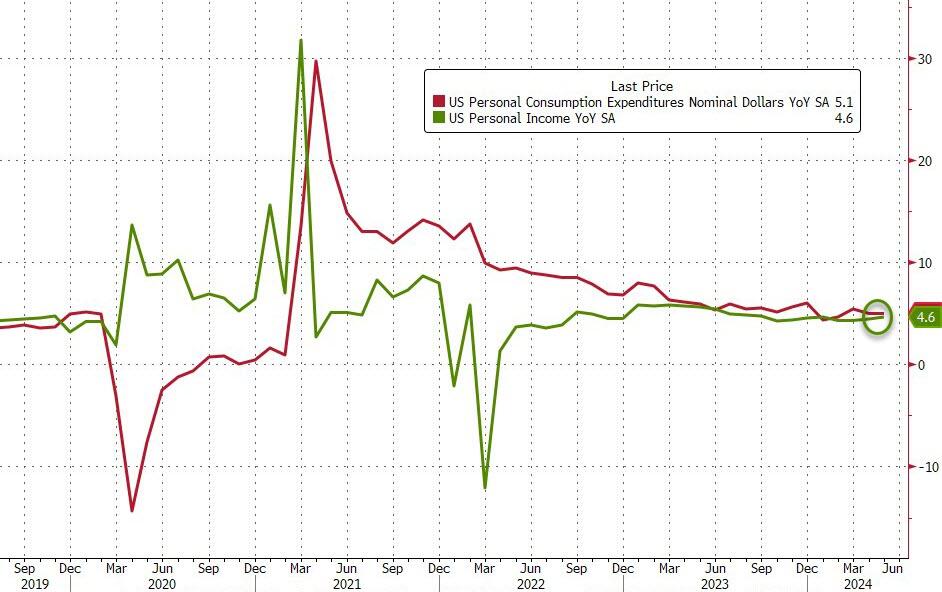
On a MoM basis, Income grew more than expected (+0.5% vs +0.2% exp) while spending rose less than expected (+0.2% MoM vs +0.3% exp)
Source: Bloomberg
Which accelerated both income and spending on a YoY basis (with the latter outpacing the former, of course)…
Source: Bloomberg
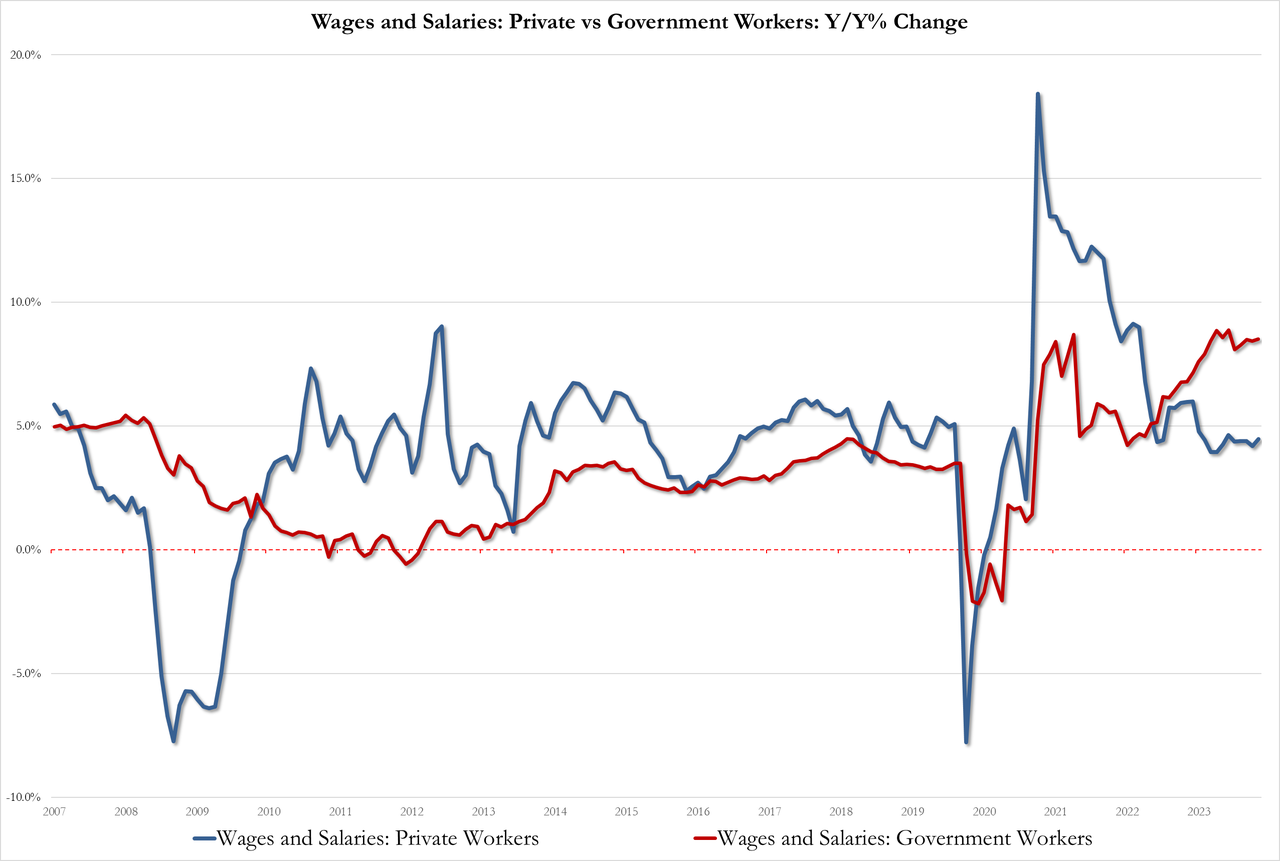
With wage pressures rising once again…
Government 8.5%, up from 8.4% but below the record high of 8.9%
Private 4.5% up from 4.2%
Source: Bloomberg
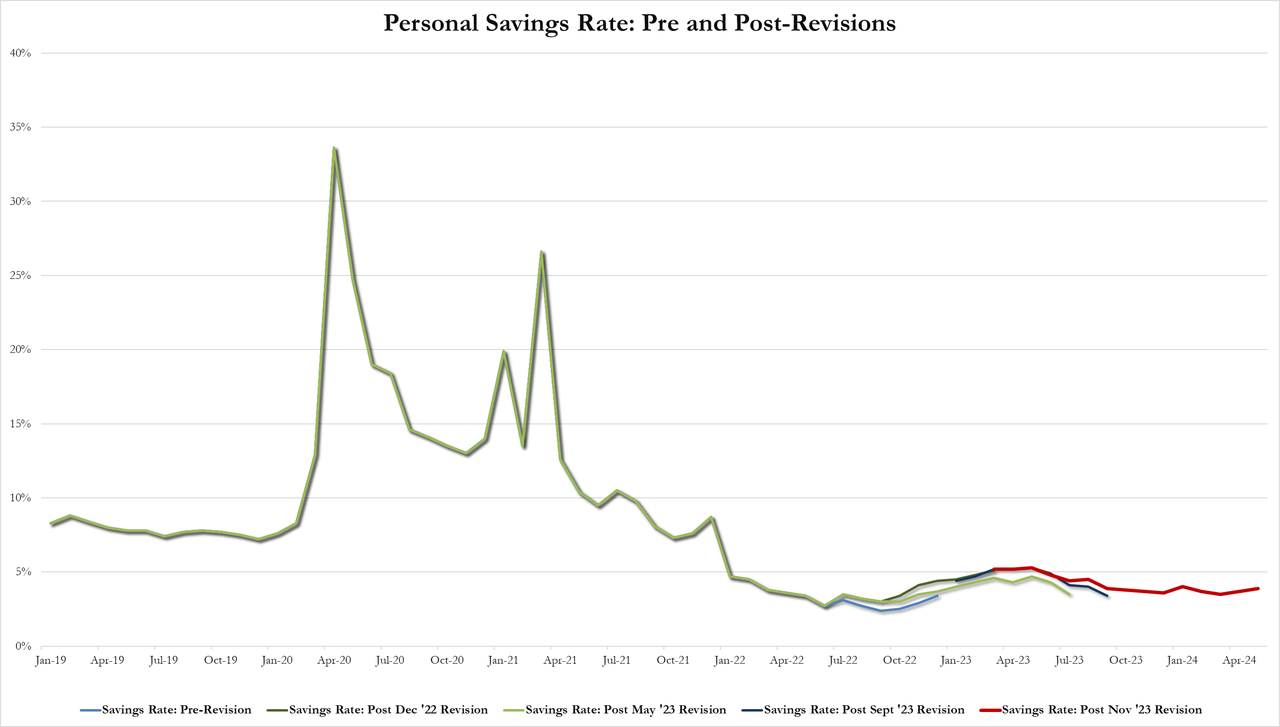
And after a series of revisions, the savings rate ticked up to 3.9% of DPI (from 3.7%) – the highest since January…
Source: Bloomberg
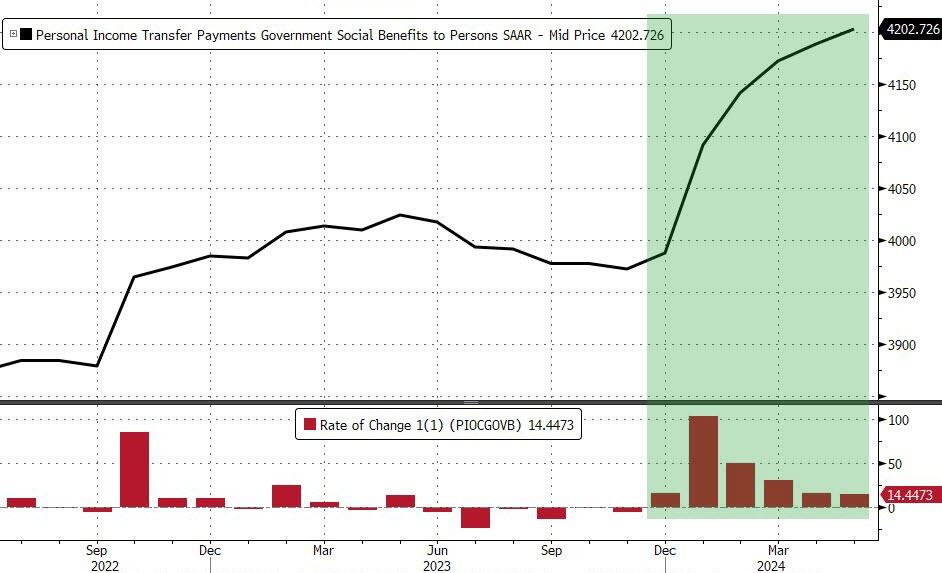
All of which takes place against a background of the sixth straight month of rising government handouts (well it is an election year after all)…
Source: Bloomberg
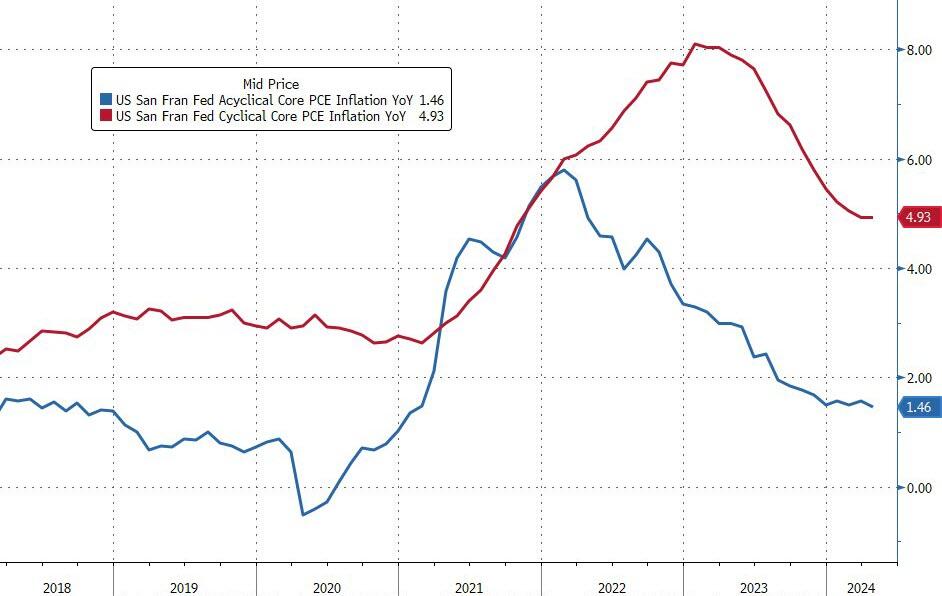
Finally, while acyclical inflationary pressures continue to drift lower, cyclical inflationary pressures remain extremely elevated…
Source: Bloomberg
A very mixed bag but nothing screams ‘automatic’ rate-cuts… and SuperCore refuses to budge.
But, below the hood of the last one we see some more interesting dynamics evolving as revenues and employment decline while prices re-accelerate…
Source: Bloomberg
This is the 25th straight month of contraction (sub-zero) for the Dallas Fed Services index and judging by the respondents’ comments, there is a clear place to point the finger of blame:
Poor national leadership and lack of confidence have eroded the business environment.
The Federal Reserve’s recent announcement of no rate cuts in the near future is concerning regarding the immediate and lag effect it could have on the local economy. We have received direct feedback from many of our clients in various industries, and they are increasingly concerned. They are freezing hires and spending, with many reducing spending. The primary reason is the economic stagnation locally and nationally affecting their businesses.
People are adjusting to new economic realities. Few are expecting salary increases and are instead making lifestyle adjustments to deal with higher living costs. Reality is also setting in for the apartment owners we serve. They understand rents aren’t going up and interest rates aren’t coming down. As rate caps expire and loans mature, lenders are having to adapt as well. Ultimately, a lot of private equity (much in the form of individual retirement savings put into syndications) is getting wiped out.
We need a rate cut before we will see any revenue improvement from home sales.
As elections draw near, the political environment worsens, creating more uncertainty in our business.
We feel inflation and fear of more inflation plus the rise in cost of living are holding consumers back. Hopefully we will adapt to the new realities soon.
Customers are concerned about the election, so they are holding off on large purchases.
The lack of building activity is shutting down the appliance industry.
Affordability has become an ever-increasing problem for new car dealers. The price increases of new cars combined with higher interest rates have put new cars out of reach for more and more people.
[Car] inventories continue to swell, and interest rates remain high. Our grosses are off, and margins continue to decline. Profits are down 20 percent from the prior year.
The economy is slowing. The consumer is more cautious and more reluctant to purchase at higher prices and payments.
And finally, this seemed to sum up just how business-owners feel in general about the current occupant of The White House:
“Our outlook depends heavily on the presidential election.
S&P/Case-Shiller released the monthly Home Price Indices for April (“April” is a 3-month average of February, March and April closing prices). The pace of appreciation has slowed from the previous month, reflecting the toll of 7% mortgage rates and low inventory.
This release includes prices for 20 individual cities, two composite indices (for 10 cities and 20 cities) and the monthly National index.
The S&P CoreLogic Case-Shiller U.S. National Home Price NSA Index, covering all nine U.S. census divisions, reported a 6.3% annual gain for April, down from a 6.5% annual gain in the previous month. The 10-City Composite saw an annual increase of 8.0%, down from an 8.3% annual increase in the previous month. The 20-City Composite posted a year-over-year increase of 7.2%, dropping from a 7.5% increase in the previous month. San Diego continued to report the highest annual gain among the 20 cities in April with a 10.3% increase this month, followed by New York and Chicago, with increases of 9.4% and 8.7%, respectively. Portland once again held the lowest rank this month for the smallest year-over-year growth, with a 1.7% annual increase in April. … The U.S. National Index, the 20-City Composite, and the 10-City Composite upward trends decelerated from last month, with pre-seasonality adjustment increases of 1.2%, 1.36% and 1.38%, respectively.
After seasonal adjustment, the U.S. National Index and 10-City Composite posted the same month-over-month increase of 0.3% and 0.5% respectively as last month, while the 20-City reported a monthly increase of 0.4%.
“For the second consecutive month, we’ve seen our National Index jump at least 1% over its previous all-time high,” says Brian D. Luke, Head of Commodities, Real & Digital Assets at S&P Dow Jones Indices. “2024 is closely tracking the strong start observed last year, where March and April posted the largest rise seen prior to a slowdown in the summer and fall. Heading into summer, the market is at an all-time high, once again testing its resilience against the historically more active time of the year.
“Thirteen markets are currently at all-time highs and San Diego reigns supreme once again, topping annual returns for the last six months. The Northeast is the best performing market for the previous nine months, with New York rising 9.4% annually. Sustained outperformance of the Northeast market was last observed in 2011. For the decade that followed, the West and the South held the top posts for performance. It’s now been over a year since we’ve seen the top region come from the South or the West.
Of course, Fed Money Printing is helping drive home price growth. Perhaps too much!
Here is Jerome Powell, Chairman of The Fed Bubble Blowing Machine!!


You must be logged in to post a comment.