US Home Price Growth “Slows” To 9.24% YoY As Fed Tightens Noose (But Fed’s Balance Sheet Remains Elevated)

The US housing market continued to sag in October as the impact of higher mortgage rates and concerns over the economy rattled buyers and sellers.

Prices fell 0.5% from September, the fourth consecutive monthly decline for a seasonally adjusted measure of home prices in 20 large cities, according to the S&P CoreLogic Case-Shiller index.

The market began downshifting earlier this year as the Federal Reserve started hiking its benchmark interest rate, with the goal of easing high inflation that’s been driven in part by skyrocketing housing costs. 

Rates for 30-year, fixed mortgages reached 7.08% in October — and again in November — though they have since retreated, Freddie Mac data show. With borrowing costs roughly double where they were at the start of the year, and inflation leaving less savings to put toward a down payment, homebuyers have pulled back. Sellers are also reluctant to list their properties, yet houses that are on the market are lingering and getting discounted as demand slumps.

The Case-Shiller National Home Price Index “cooled” to 9.24% YoY growth as The Federal Reserve tightens its monetary noose.

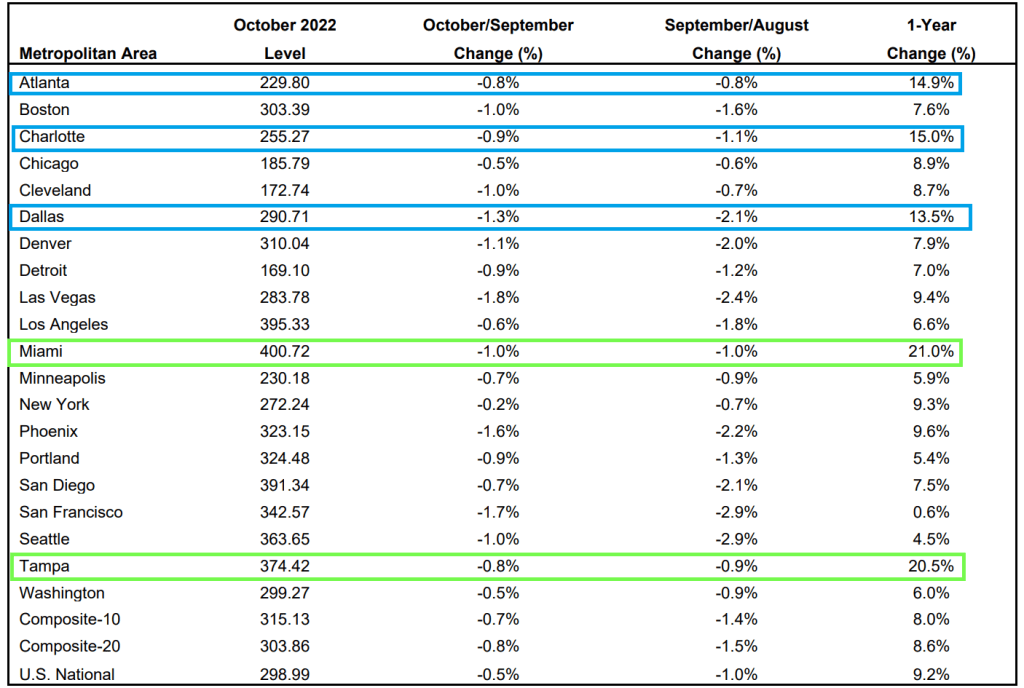
Of the top twenty metro areas, both Miami and Tampa Florida were up over 20% YoY. Hot ‘Lanta, Charlotte and Dallas were over 10% YoY. Mordor on the Potomac was up “only” 6% and all other metro areas were under 10%.

But if we look at October/September changes, all metro areas are down (MoM) with San Francisco the worst.

Finally, The Federal Reserve’s massive balance sheet is still out in force.

Look at this chart of the Case-Shiller National home price index again The Fed’s balance sheet. Uh-oh.

Let’s look at San Francisco (my hometown) since The Federal Reserve began interest rate tightening.

US Gasoline And Diesel Prices Falling As Fed Tightens Monetary Noose (But Gasoline Prices Still Up 30% Under Biden, Diesel Prices Up 78%)

As the global economy slows and global central banks continue to tighten, we are seeing gasoline and diesel prices falling.

But bear in mind that US gasoline prices remain 30% higher since Biden was sworn-in as President. Diesel prices are up a staggering 78% since that fatal day.

Speaking of tightening monetary policy, the US Treasury yield curves have flattened/inverted since The Fed started tightening with rate increases to fight inflation.

Let’s see how inflation does with Congress’ $1.7 trillion, unread Omnibus bill. Aka, Grand Theft Congress. Pelosi is holding an iPhone and Schumer is holding the scope rifle. McConnell is wearing the gas mask since the wasteful spending truly stinks.

Let It Blizzard? Home Sales Slumped 35% in November, The Biggest Decline on Record

Let it snow! Or is it a blizzard?

Redfin released a terrible housing report showing that home sales fell a gut-wrenching 35% in November, the largest on record since Redfin has been collecting data.

Hopefully mortgage rates will continue to decline in 2023!

Merry Christmas from sub-zero Columbus Ohio where it is snowing with 50 mph gusts. Brrrrrr.

US New Home Sales Rose 5.8% MoM In November, But DOWN -15.3% YoY For The Ninth Straight Month (M2 Money Is Vanishing)

A classic good news, bad news story. The good news? US new home sales rose 5.8% in November, better that the expected -5.1%, The bad news? On a year-over-year basis, US new home sales FELL

Sales of new US homes unexpectedly rose in November, suggesting some stabilization in demand as mortgage rates eased late in the month from their highs.

Purchases of new single-family homes increased 5.8% to an annualized 640,000 pace last month after rising in October, government data showed Friday.

A mid-month retreat in 30-year mortgage rates back below 7% along with an increase in builder incentives may have helped support demand. Still, the sales data are volatile from month to month. With home prices remaining elevated and the Federal Reserve poised to raise interest rates further, headwinds for the housing market will persist into 2023.

The increase in sales last month was concentrated in the West and Midwest.

The report, produced by the Census Bureau and the Department of Housing and Urban Development, showed the median sales price of a new home was up 9.5% from a year earlier to $471,200.

There were 461,000 new homes for sale as of the end of last month, though the grand majority remain under construction or not yet started. The number of homes sold in November and awaiting the start of construction — a measure of backlogs — rose to the highest since the beginning of the year.

But for all the cheerleading, new home sales were DOWN -15.3% on a year-over-year basis. The ninth straight month of negative new home sales growth.

At least the median price of new home sales was down -2.79% from October to November.

Inflation Bomb? US Core PCE Deflator Calms Down To 4.7% YoY, Still Over 2x Fed Inflation Target (Taylor Rule At 10.10%, Still Unachievable)

There’s inflation in the air. The US Core PCE deflator slowed to 4.7% YoY in November. But it is still over 2x The Fed’s inflation target.

The lower core PCE growth of 4.7% YoY results in a Taylor Rule estimate for The Fed Funds Target rate of 10.10%. Which The Fed will never reach, particularly since the House Of Overlords (the US Senate) just passed a grossly irresponisble omnibus bill of $1.7 trillion laden with insidious pork barrel spending and, on a depressing note, billions for border security in Egypt, Oman and other countries, just not our wide-open border with Mexico.

Here are the Lords of Darkness (Schumer and Pelosi) who concocted this witch’s brew of crony payoffs that will be ulitmately signed by El Stupido (Biden).

US Leading Economic Indicator Falls To -1% QoQ In November, -4.5% YoY As Fed Sugar Dissolves (Do I Detect A Trend?)

Do I detect a trend in the US Leading Economic Indicator data?

The Conference Board’s US Leading Economic Indicator was released this morning and it wasn’t pleasant. The US Leading Index was down -1% MoM in November.

On a year-over-year basis, it is down -4.5% YoY as The Fed withdraws its massive monetary stimulus.

The good news … for military contractors … is that Biden and Congress have given Ukraine’s Zelenskyy ANOTHER $47 BILLION.

Misery! US Real GDP Remains Below 2% YoY As Core PCE (Inflation) Rises And Remains Near 5% YoY (Misery Index Remains Elevated At 12%)

Its another slow growth economic report for the Biden Administration. So much stimulus, so little to show for it other than painful inflation.

On a year-over-year (YoY) basis, US real GDP rose to a measly 1.9%. US core PCE YoY fell slightly to 4.93%. M2 Money growth is at 2.6% YoY.

The Misery Index (U-3 inflation rate + inflation) remains elevated and above 10% (it currently clocks-in at 12%), far above the pre-Covid reading of around 5%.

Here is the rest of the story. On a quarter-over-quarter basis, real GDP rose to 3.2% QoQ. Personal consumption rose 2.3% QoQ. Core PCE (Personal Consumption Expenditures) rose to 4.7% QoQ. If we use core PCE as a measure of inflation, inflation is rising.

Here is a video of Fed Chair Jerome Powell (doubling as President Joe Biden) saying creating inflation and then raising interest rates to fight it “It’s for the best.”

US Existing Home Sales Plunge -35.4% In November, 16 Straight Months Of Negative YoY Growth (Median Price YoY Falls To 3.21% As Fed Stimulus Wears Out)

One of the big problems with Federal goverment and Federal Reserve monetary stimulus is … it wears out. Just look at M2 Money growth.

US existing homes sales fell -7.70% in November to 4.09 million units SAAR. And since the same month last year, existing home sales are down -35.4% YoY.

Existing home sales were the lowest in November since 2010.

The good news? The median price of existing homes fell to 3.21% YoY. The bad news? The ark is really bad pointing to a bad December. Inventory for sale (orange line) remains below pre-Covid shutdown levels.

Of course, will the Federal government and Federal Reserve come riding to the rescue of the housing market … again? It looks like The Fed is thinking about it.

Mortgage Bomb Cyclone! Mortgage Rates Drop 82 Basis Points Since October 21, Yet Purchase Apps Down -17.25% (Purchase Apps Down 36% Since Last Year, Refi Apps Down 85% Since Last Year)

The mortgage market is behaving like today’s bomb cyclone in terms of the weather. Bomb cyclone in that mortgage rates have dropped 7.16% on October 21, 2022 to 6.34% on December 16, 2022 (a drop of 82 basis points), but mortgage purchase and refinancing applications are not increasing like one would hope.

Mortgage applications increased 0.9 percent from one week earlier, according to data from the Mortgage Bankers Association’s (MBA) Weekly Mortgage Applications Survey for the week ending December 16, 2022.

The Refinance Index increased 6 percent from the previous week and was 85 percent lower than the same week one year ago. The seasonally adjusted Purchase Index decreased 0.1 percent from one week earlier. The unadjusted Purchase Index decreased 3 percent compared with the previous week and was 36 percent lower than the same week one year ago.

But remember, The Federal Reserve is going to be lowering their target rate after they keep raising it.

My Kuroda! BOJ’s Kuroda Shocks Markets By Loosening Rate Band (Final End To Uber-loose Japanese Monetary Policy)

My Kuroda!

(Bloomberg) — Bank of Japan Governor Haruhiko Kuroda just gave investors a glimpse of what to expect when the world’s boldest experiment with ultra-loose monetary policy comes to an end.

In the face of sustained market pressure, Kuroda shocked markets Tuesday by saying he’ll now allow Japan’s 10-year bond yields to rise to around 0.5%, double the previous upper limit of 0.25%.

Whether this is a strategic tweak to buy time for his yield-curve control settings until his decade-long term ends in Aprilor the start of the end for his unprecedented monetary easing remains to be seen. 

Here are the BOJ’s rate. bands being widened.

The yen?

And with the ECB, Fed and now Bank of Japan all tightening, we are seeing sovereign yields rising across the board.

The Japanese sovereign yield curve is upward sloping unlike the humped US Treasury yield curve.

Will the US Treasury Secretary Janet “Statist” Yellen comment?