Too Much Money! U.S. Consumer Spending Drops, Price Index Up Most Since 1982 (REAL Personal Spending Fell 1% In December)

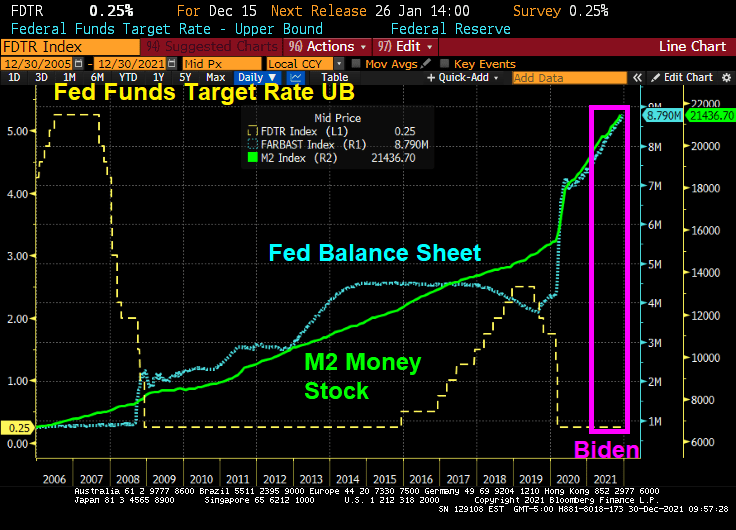
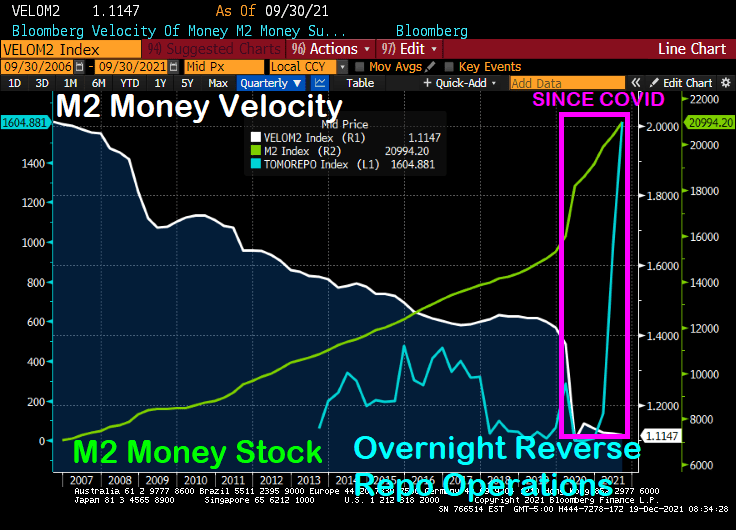
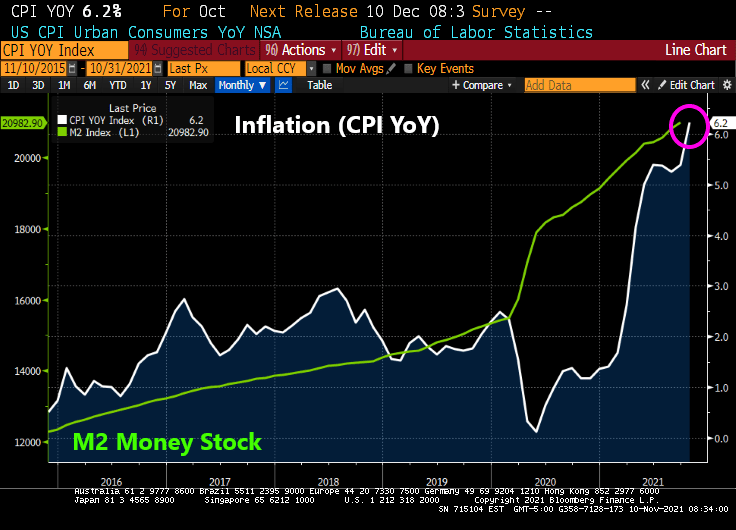
This is a case of “Too much money” in the economy, courtesy of The Federal Reserve.

(Bloomberg) — U.S. inflation-adjusted consumer spending fell last month by the most since February, suggesting that Americans tempered their outlays amid the latest Covid-19 wave and the fastest inflation in nearly 40 years.

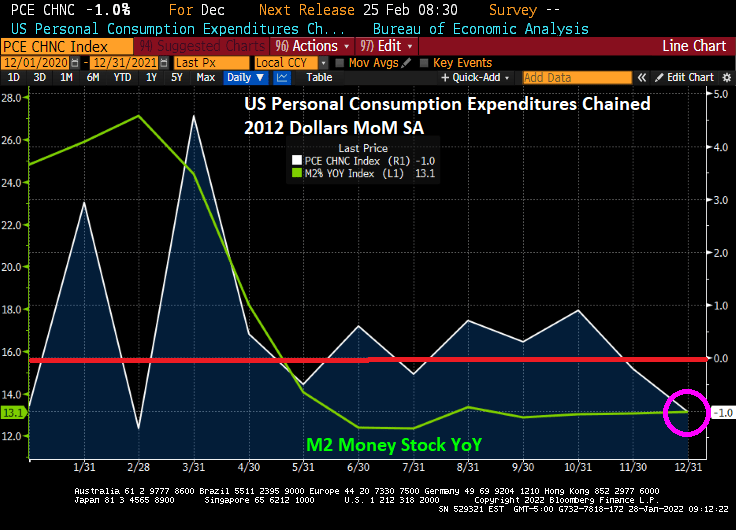
Purchases of goods and services, adjusted for changes in prices, decreased 1% from November, the Commerce Department said Friday. 

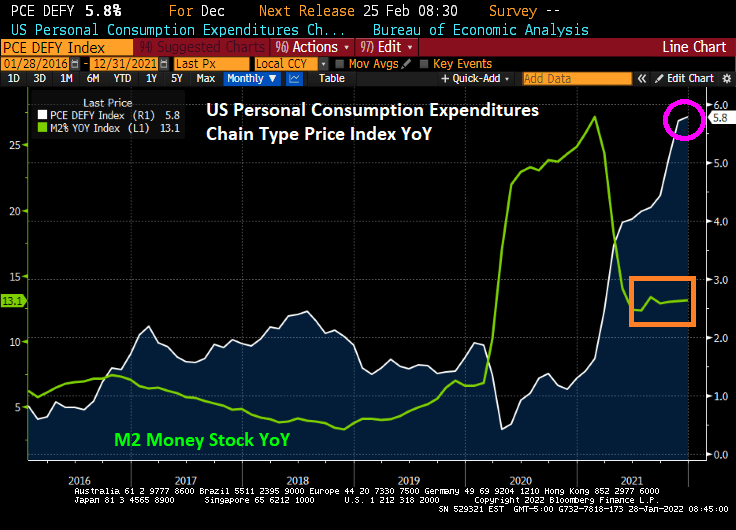
The personal consumption expenditures price gauge, which the Federal Reserve uses for its inflation target, rose 0.4% from a month earlier and 5.8% from December 2020, the most since 1982. Unadjusted for inflation, spending fell 0.6%, while incomes rose 0.3%.

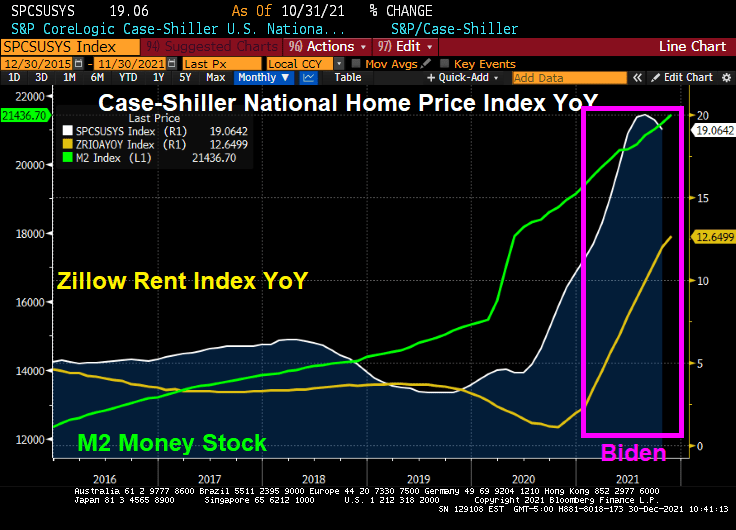
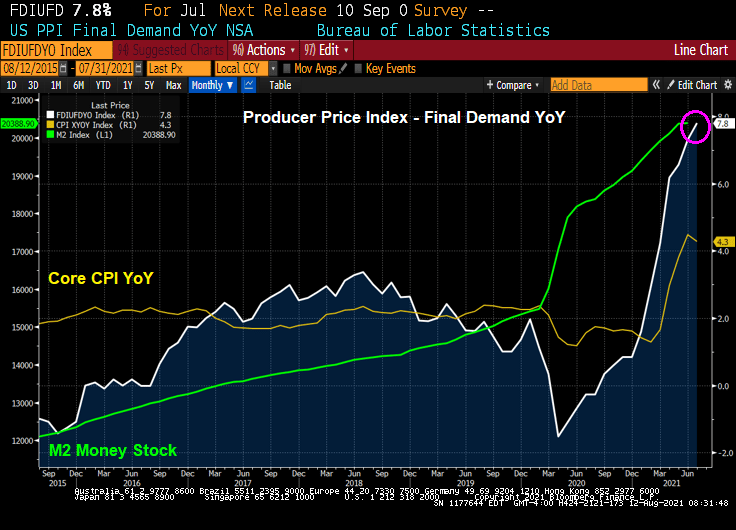
Yes, the PCE Deflator YoY rose to 5.8% as M2 Money Stock is growing at a 13.1% YoY clip.

REAL personal spending declined 1% in December as prices rose in part thanks to the 13.1% growth in M2 Money stock YoY.

Too much money! Time to slow down, Jay Powell! Stop sucking the life out people with inflation.

US Treasury Yield Curve Now Back Where It Stated With Biden At The Helm (Inflation Crushing America And The Yield Curve)

It has been almost a year since Joe Biden has been President of the United States and a Democrat majority took control of The House and Senate. And what has happened to the US Treasury yield curve slope over the past year?

The yield curve is back where it started. There was the “honeymoon effect” where the curve slope rose. After all, Biden was Obama’s Vice President for 8 years and The Democrats has promised so much in the 2020 election. But by early April, the reality of the massive Federal spending (combined with Fed Stimulypto) began showing what was feared: inflation (blue line) started to grow at a rapid rate of speed. With inflation now at 6.8% YoY,

In fairness to Biden, The Federal Reserve has been overstimulating the economy since The Federal Reserve since Ben Bernanke and the Fed Open Market Committee (FOMC) dropped the hammer on The Fed Funds Target Rate once the rate hit 5.25% in September 2007. They kept cutting it reached 25 basis points (or 0.25%) in December 2008. In August 2008, Bernanke and Company began their “Quantitative Easing” or asset purchasing programs. Between The Fed’s Target Rate and QE, The Fed has continued to overstimulate markets ever since. Under Biden, The Fed Funds Target Rate remains at 0.25% and The Fed’s Balance sheet has grown to $8.79 Trillion (bigger than the entire economies of Japan and Germany put together!).

How about housing? Home prices are growing at 19% YoY while rents are growing at 12.65% YoY.

Energy prices have risen dramatically under Biden. Gasoline is up 46% despite a slight reprieve recently. WTI crude prices are up 64%.

How about food? Beef prices are up 20% and chicken prices are up 10%.

On a positive note, the S&P 500 index has soared … thanks has soared during Biden’s term thanks to Fed stimulus and Federal spending on COVID.

The Build Back Better Act if passed (in its entirety or on a piecemeal basis) will lead to even MORE inflation.

Perhaps Biden’s spokesperson Jen Psaki can recreate the Biden Administration as a lovable, hilarious family like the comic strip Gasoline Alley with old Joe Biden as Skeezix. And insider-trading star, House Speaker Nancy Pelosi as the family matriarch.

Transitory? Temporary? What Happens When The COVID Stimulus Is Removed? GameStop, Bitcoin, Ethereum, Gold And M2 Money

I love how The Federal Reserve talking heads, the media, economists like Paul Krugman, all refer to inflation as “transitory” and excessive liquidity as “temporary.”

Let’s look at a variety of alternative investments to the S&P 500, GameStop, Bitcoin, Ethereum and Gold after The Federal Reserve’s and Federal government massive (over)reaction to COVID in early 2020. Gold is the first asset to surge after M2 Money surged, but has declined since. Game Stop had a big surge (likely due to positive vibes on Reddit), but has been volatile and generally falling since “The Surge.” Bitcoin had a delayed surge as did Ethereum. Despite fear about government regulation, Ethereum in particular remains elevated.

The “temporary” stimulus has resulted in the lowest M2 Money velocity in history. And we will have to see if the “temporary” excess liquidity in the financial system is truly temporary.

Here is a chart to show the “Stimulytpo” effect on commercial and industrial loans which surged (including PPP loans) but have simmered down to pre-COVID levels.

The earnings for GameStop were terrible (down 39.7% YoY). But at least Christmas season is upon us and maybe GameStop will surge with a good retail spending season.

But what happens to markets if the Federal government “stimulypto” is removed? If it ever is.

Inflation Prints Hotter Than Expected (6.2% YoY)

My heart goes out to households living on a pension. And households who are not in the elite 1% class of Americans. Particularly if they rely on The Federal Reserve and Federal government to keep inflation low.

Inflation (as measured by the Consumer Price Index) rose to 6.2%.

Yes, a large chunk of inflation is thanks to the green American lobby who want energy prices much higher. Due to the chip shortage, we have used cars and trucks soaring in price at 26.4% YoY growth.

Then we have my least favorite, most misleading inflation measure: shelter. According to the BLS, shelter rose “only” 3.5% YoY. Odd since home prices are growing a 20% YoY clip.

I know, I know. The media talking heads will say “temporary price increases.” Even with all the money pumped into the economy??

I know, I know, (CNN)President Joe Biden said Wednesday that inflation statistics showing America’s prices are surging more than they have in 30 years are proof that there is “more work to do before our economy is back to normal.”

Then stop printing money and slow down your terrible crony spending policies!!!

The Inflation Tax Levied By The Federal Government Rose To 8.62% In October (Biden Interviews Brainard For Fed Chair Position)

Now that President Biden is interviewing Lael Brainard for Federal Reserve Chair, I am really getting a peaceless, uneasy feeling that The Fed will NEVER raise rates and inflation will be perpetual. To whit, …

Prices paid to U.S. producers accelerated in October, largely due to higher goods costs, fueling concerns about the persistence of inflationary pressures in the economy.  

The producer price index for final demand increased 0.6% from the prior month and 8.6% from a year earlier, matching forecasts, Labor Department data showed Tuesday. The annual advance was the largest in figures back to 2010.

Excluding the volatile food and energy components, the so-called core PPI rose 0.4% and was up 6.8% from a year ago.

Prices paid to U.S. producers rose in October, reflecting in part higher energy costs
  

More than 60% of the headline increase was due to goods, which jumped 1.2%. Higher energy costs, including that for gasoline, drove the gain. The cost of services rose a more moderate 0.2% for a second month, reflecting a further pullback in the cost of securities brokerages and investment advice.

The report underscores how transportation bottlenecks, materials shortages and increasing labor costs have sent prices soaring across the economy in recent months. Trucking freight costs jumped a record 2.5% from September.

Inflation is a tax created by printing too much money and stupid Federal economic policies (or follicies).

Lael Brainard? Discussing the chairmanship with Brainard could signify that the Biden team is weighing how a break with Powell might help advance their goals for the central bank. Brainard and Powell work closely together on multiple issues and are viewed as holding similar views on monetary policy, but she’s favored a tougher stance on big banks.

Remember, The Federal Reserve is a privately-owned entity independent of The Federal Government. A Brainard appointment would make The Fed the financing arm of the Democrat Party.

Inflation Alert! US Producer Prices Come In Hotter Than Expected (+7.8% YoY), Annualized Run Rate Is 12%!

Well, economists were expecting a 7.2% YoY print of the Producer Price Index – Final Demand. But July’s print came in hot … at +7.8% YoY. Compare that with the Core Consumer Price Index YoY of +4.3%.

The month-over-month PPI Final Demand is showing a run rate of 12%! (1% in July x 12 months).