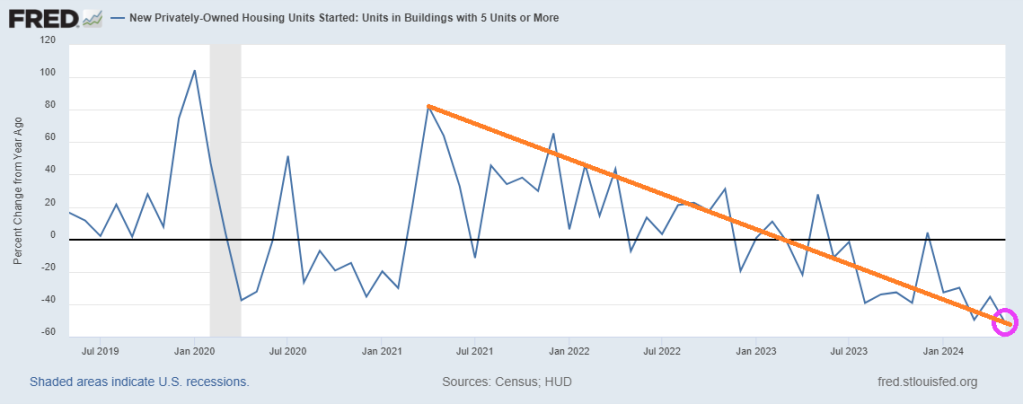
It begs the question: where are the 10+ million illegal immigrants living who have poured over the border under Binden/Mayorkas? Especially when 5+ units housing starts dropped -51.7% since last year (YoY) in May. And the trend under Biden looks terrible!
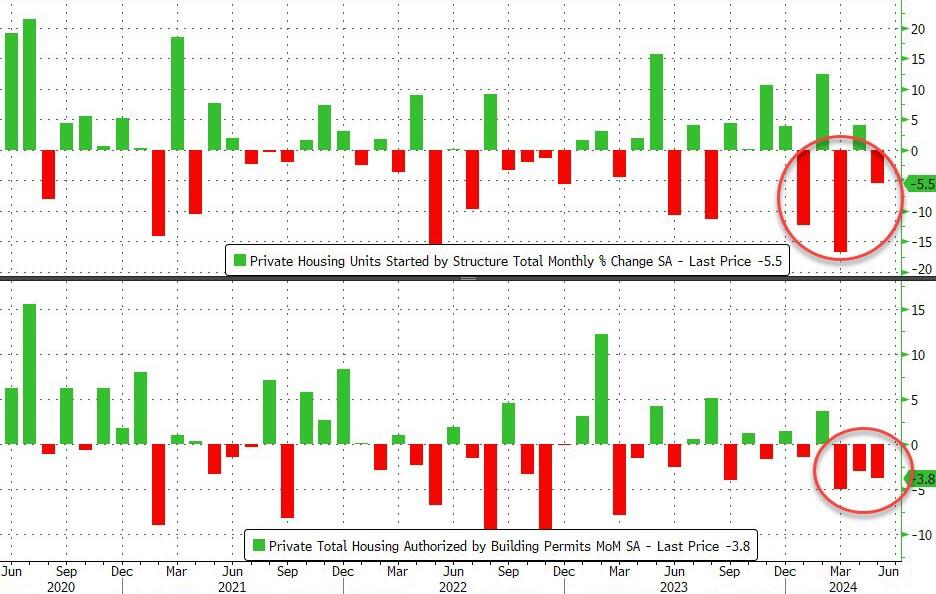
That was the third monthly drop in permits (more forward looking) in a row. Worse still, April Housing Starts were revised lower (from +5.7% to +4.1%), making this miss even worse.
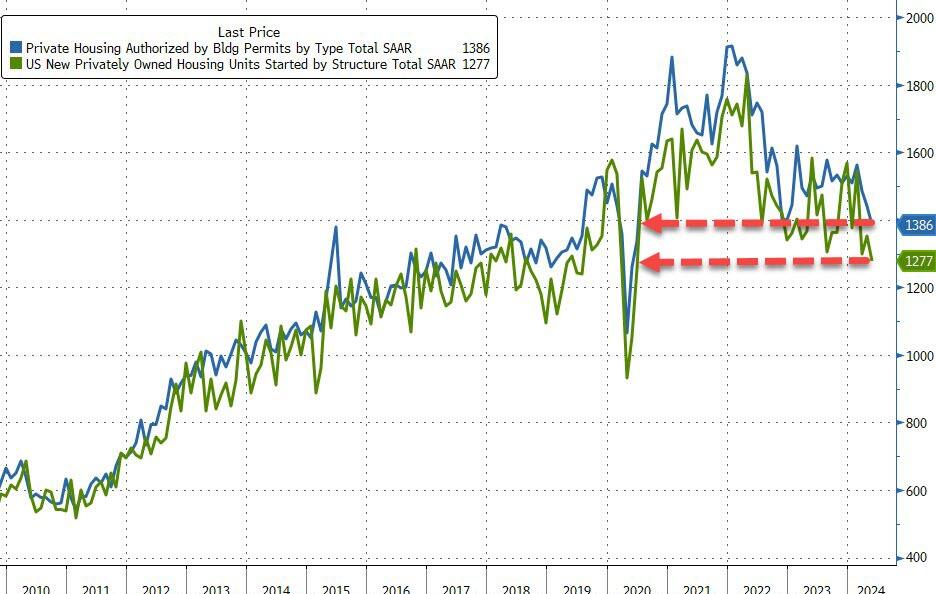
This dragged the SAARs for starts and permits to their lowest since the trough of COVID…
Source: Bloomberg
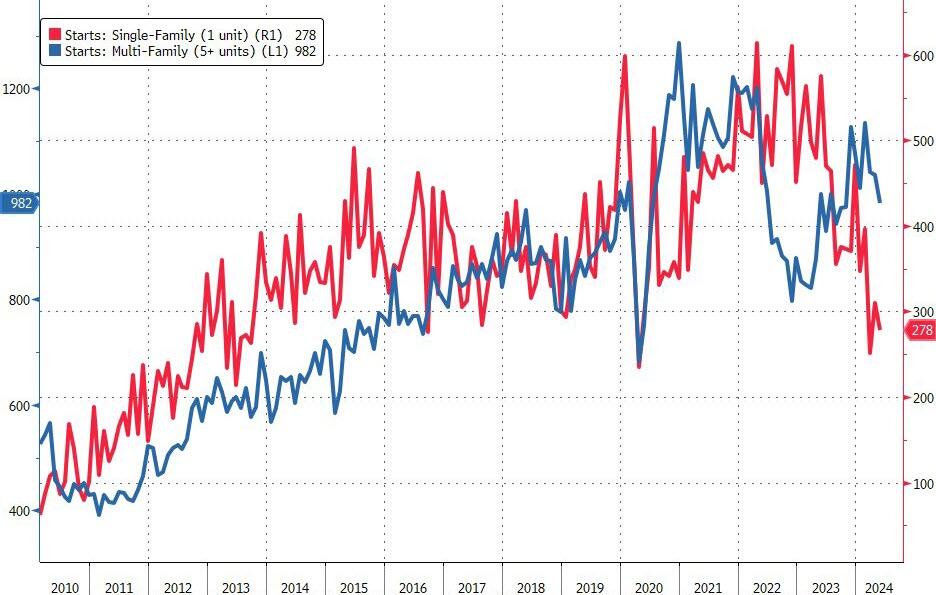
With Multifamily starts falling back near COVID lockdown lows…
Single-Family 982K SAAR, down 4.8% from 1,031K and the first sub-million print since October 2023
Multi-Family 278K, down 13.7% from 322K and the lowest since March’s 245K (which was the lowest print since covid crash)
Source: Bloomberg
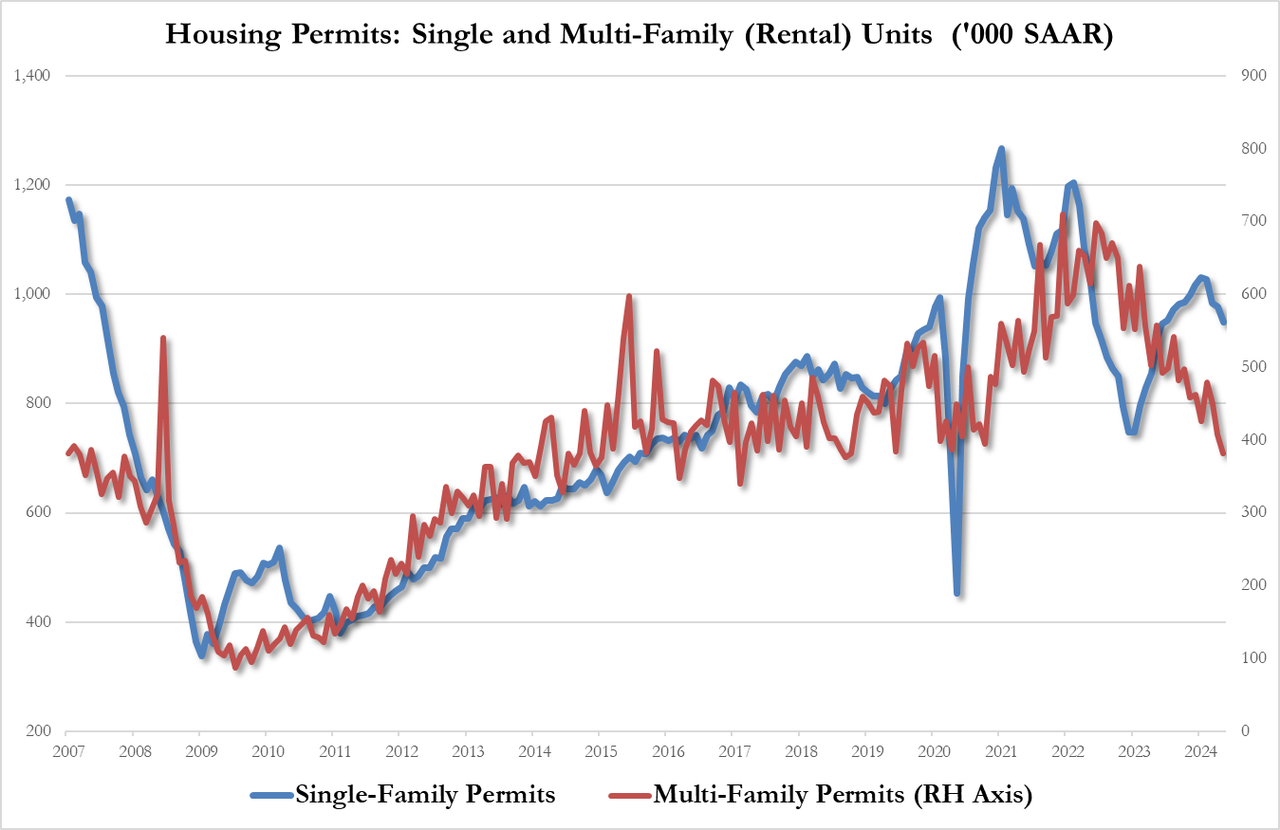
And multi-family permits cratering to their lowest since Oct 2018…
Single-Family permits 949K SAAR, down 2.9% from 977K
Multi-Family permits 382K SAAR, down 6.1% from 407K
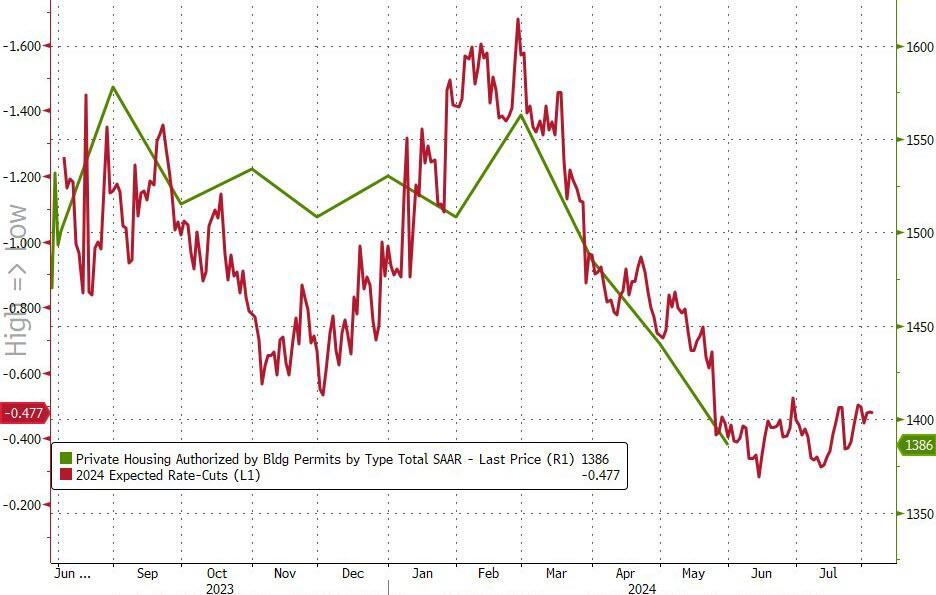
And with rate-cut expectations holding near their lows, there is no sign of recovery in home-building yet…
Source: Bloomberg
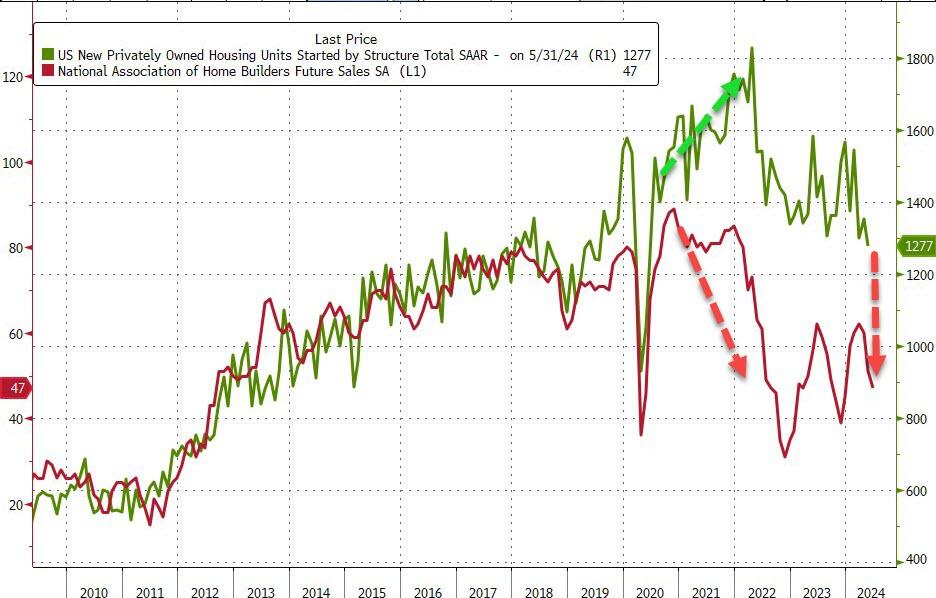
It seems reality is starting to set in for homebuilders…
Source: Bloomberg
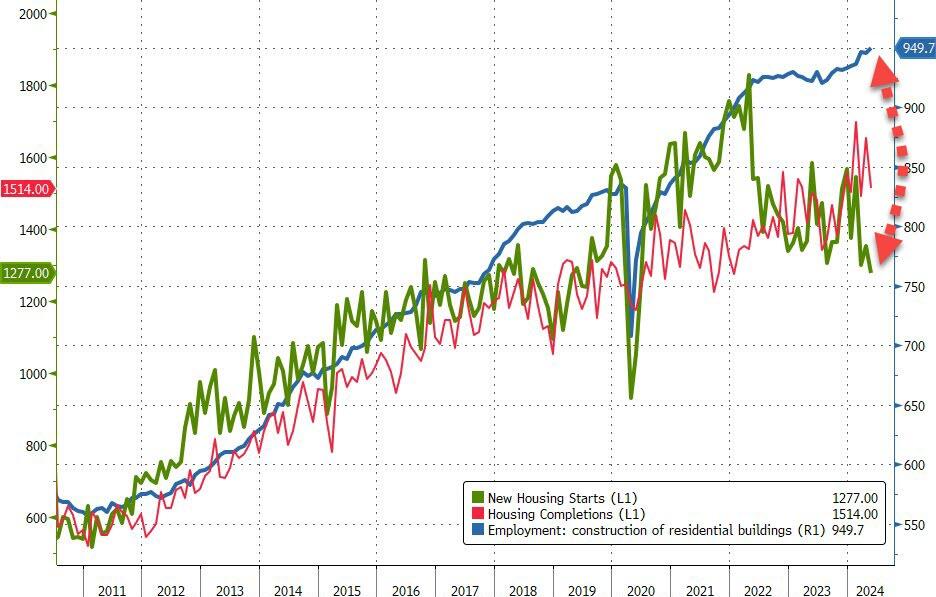
As housing starts plummet, jobs seem to keep growing to record highs…
Now you know why Joe Biden has fund raisers in Hollywood and New York where the elites (the top 1%) live. Biden is the President of The Elites, not the middle class.
How bad it is? The top 1% now have more household wealth than the entire middle class. Note that the recent surge occurred under Trump, but Biden is doing nothing about it.
Further evidence? 46% of households are struggling.
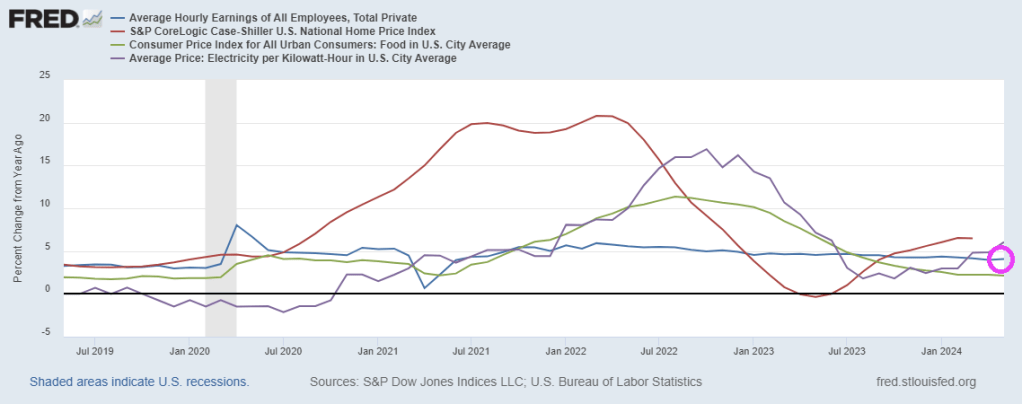
In terms of housing prices, home prices are growing FASTER than average hourly earnings. Again!
Politicians. You can’t trust ANY of them with our money. Or a cookout.
Here is New Yprk Senator Chuck Schumer posing as a middle class American cooking gray hamburgers at super low heat with cheese on top of raw meat. What a fraud!
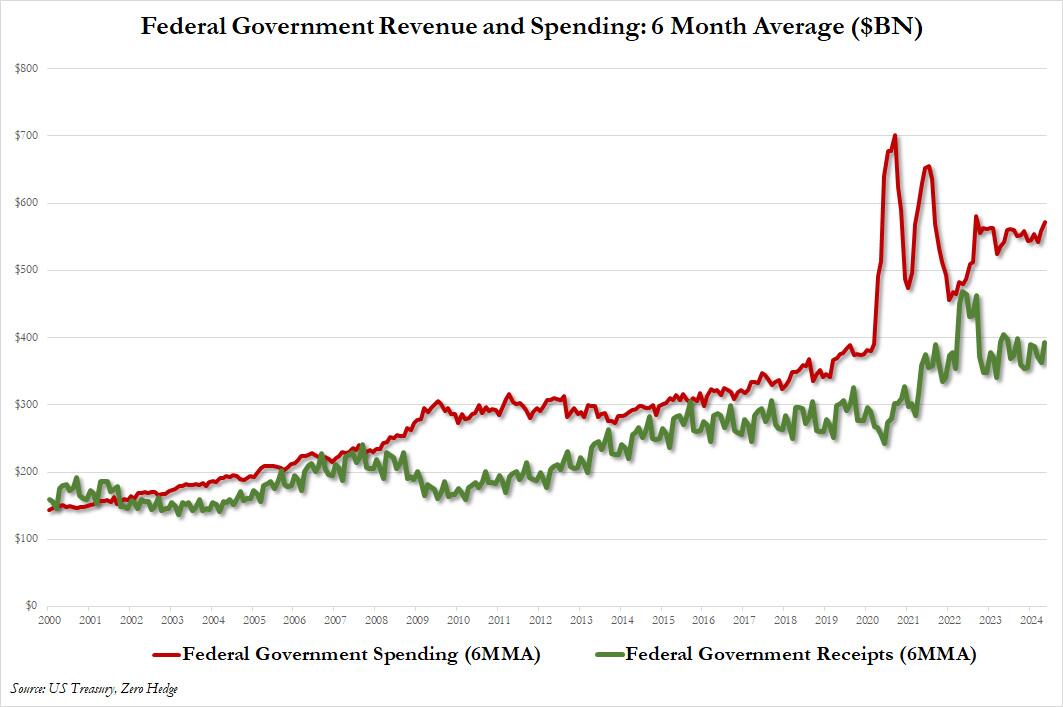
So much for Biden’s bragging that “he” cut the US budget deficit by half. Actually, Biden regularly confuses the national debt with the national deficit.
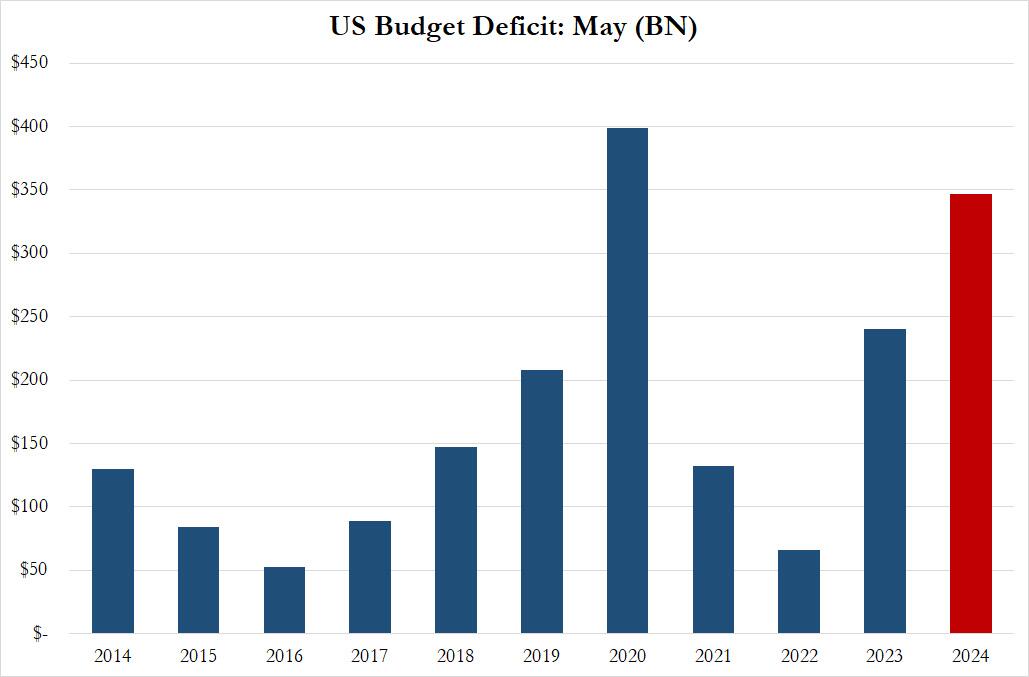
… resulting in a May budget deficit of $347 billion – about $100 billion more than consensus expected – and the second biggest May deficit on record, with only the Covid crisis peak of May 2020 higher.
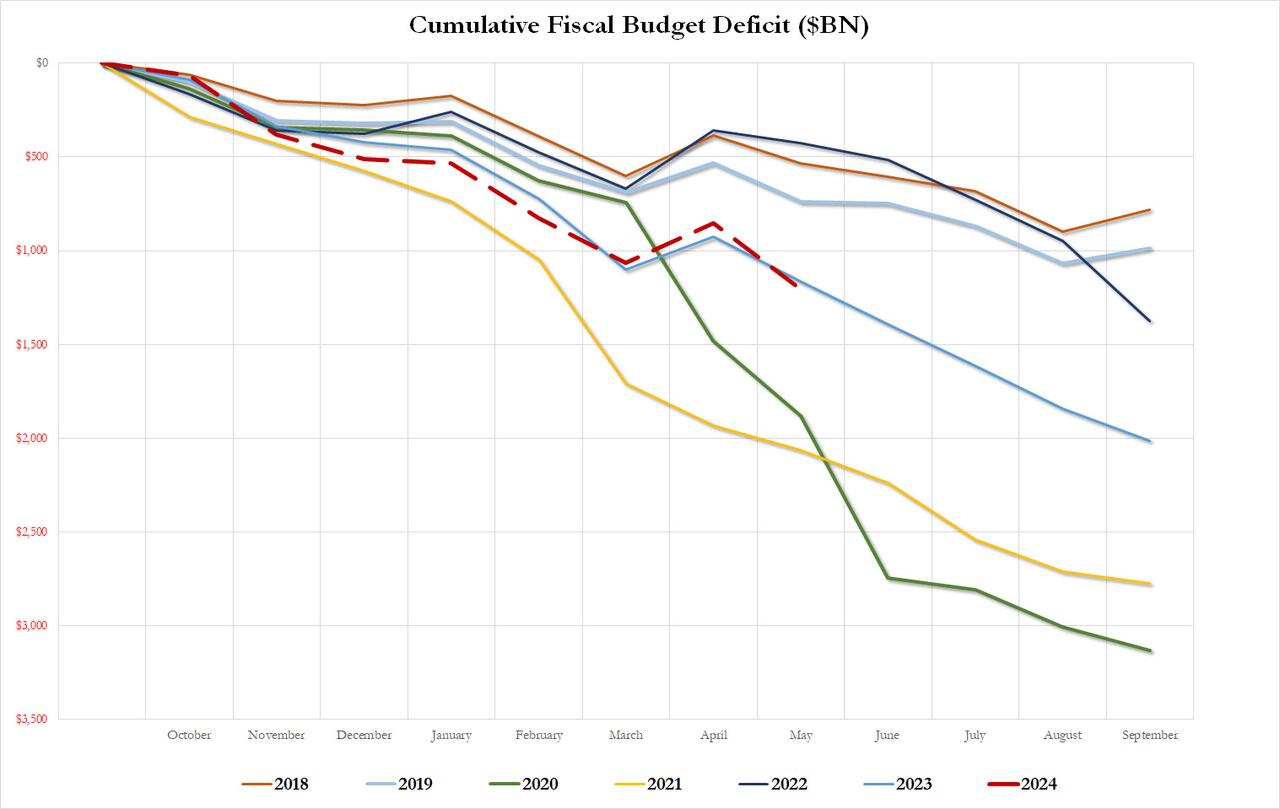
As a result of the blowout May deficit, the cumulative fiscal 2024 shortfall once again surpassed the 2023 total, bringing the YTD deficit total to just over $1.2 trillion more than the $1.16 trillion cumulative deficit througth May 2023, and that’s with 4 more months left in the fiscal year.
Now, at this point, someone who still has a functioning brain at the CBO looked at the two llines and realized that with the final 2023 deficit printing just over $2 trillion, the CBO’s current forecast of “only” $1.5 trillion for 2024 looked idiotic at best, and like total propaganda garbage at worst.
And so, moments ago – and, again, with just 4 months left in fiscal 2024 – the CBO took machete to its 2024 forecast, and in hopes to avoid looking like a consummate fool, hiked its 2024 budget deficit forecast from $1.5 trillion to $1.9 trillion, confirming that there will be effectively no difference in the fiscal picture between 2023 and 2024.
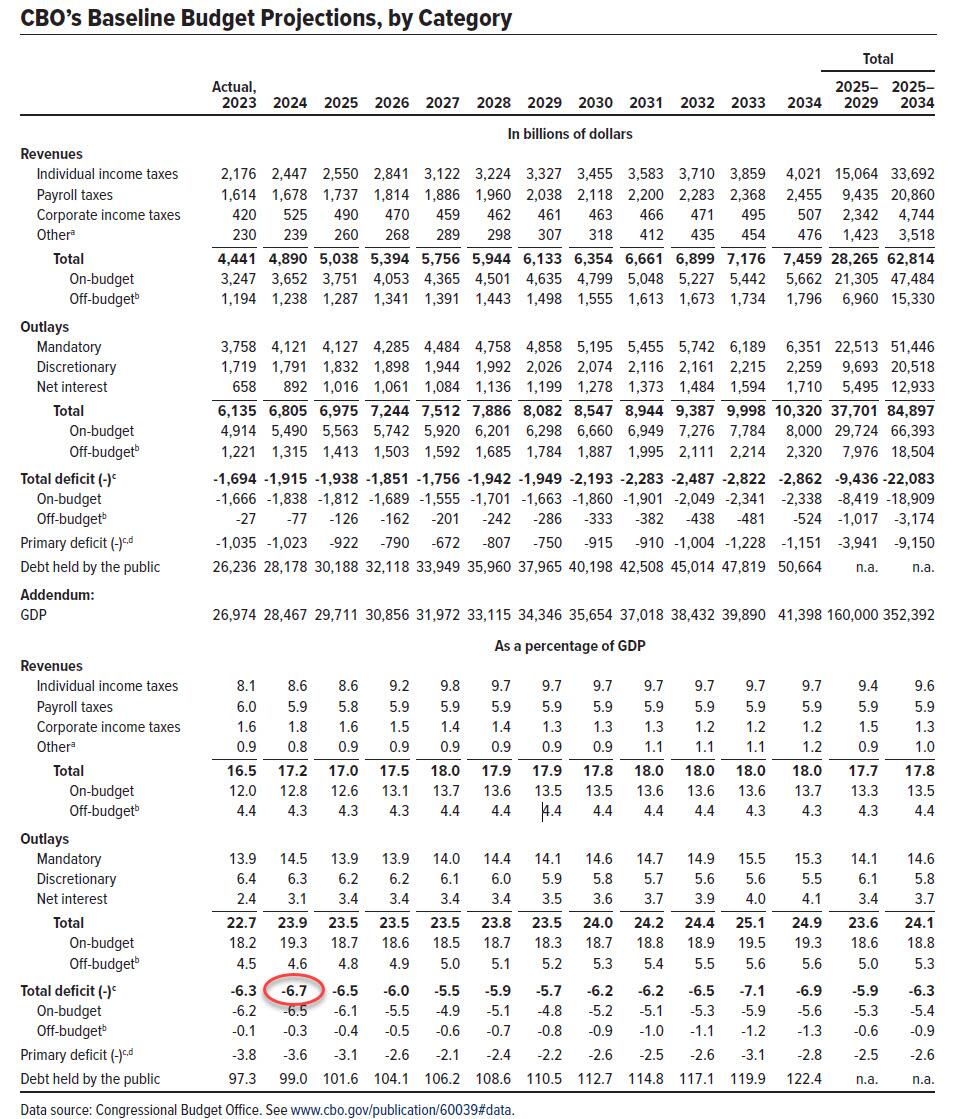
In its latest projections published today, the Congressional Budget Office (CBO) predicted that government spending would continue to, drumroll, rise. The CBO estimate of the budget deficit was $400 billion higher from the office’s last projections released in February, bringing the total to $1.9 trillion, up from its previous $1.5 trillion forecast.
The office attributed the 27% spike to several key drivers, including foreign military aid (i.e. covering up Biden’s crimes in Ukraine via constant military aid to the local regime), the Biden administration’s student loan actions, the Federal Deposit Insurance Corporation’s slower-than-expected recovery of payments made in response to bank failures over the past two years, higher outlays for Medicaid and increases in discretionary spending. Oh, and the $1.2 trillion in interest expense on Federal debt isn’t helping either, and is one of the biggest reasons why the CBO now expects a 2024 deficit-to-GDP ratio of 6.7%, up from the previous 5.3% pedestrian prediction.
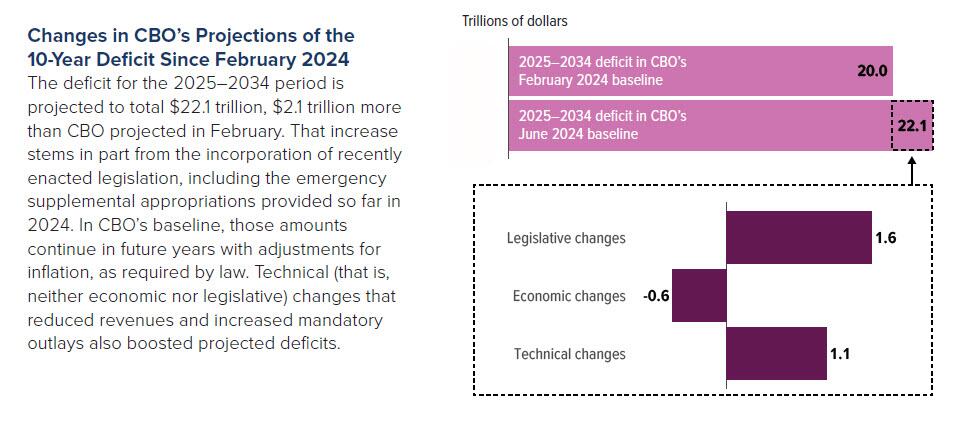
Meanwhile, the cumulative deficit from 2025 to 2034 is projected to reach $22.1 trillion, which is 10% higher than the office previously projected in February, marking a $2.1 trillion increase.
Of course, by the time 2034 rolls along, the actual deficit will most likely be at least 10x more, but since gold will be about $100,000 by then while bitcoin will be the world’s digital reserve currency, none of that will matter.
“The largest contributor to the cumulative increase was the incorporation of recently enacted legislation into CBO’s baseline, which added $1.6 trillion to projected deficits,” the CBO said Monday. “That legislation included emergency supplemental appropriations that provided $95 billion for aid to Ukraine, Israel, and countries in the Indo-Pacific region.”
“By law, that funding continues in future years in CBO’s projections (with adjustments for inflation), boosting discretionary outlays by $0.9 trillion through 2034.”
Compared to the past five decades, the budget analysts said deficits over the next 10 years “are about 70 percent larger than their historical average” when measured “in relation to economic output.”
In other words, the US is now well past the Minsky Moment point of no return, and it will all come crashing down once the USD loses its reserve currency status.
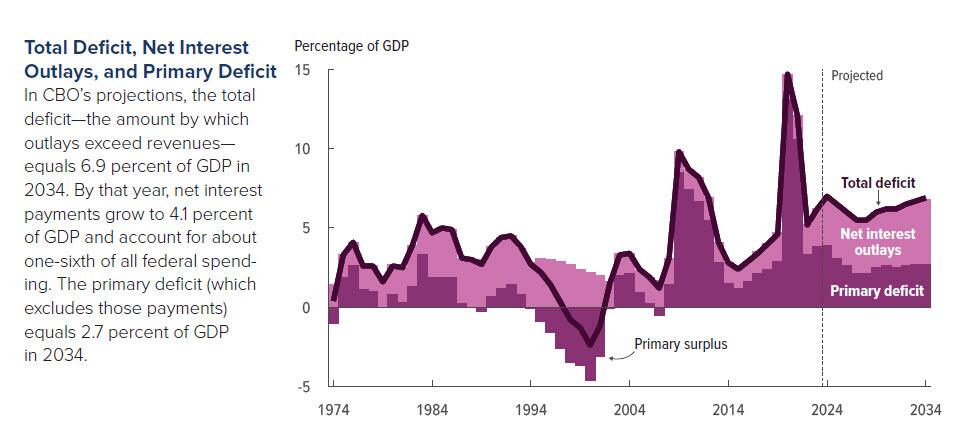
As interest costs and spending on programs like Medicare and Social Security continue to rise, the CBO projects federal outlays will reach 24.2% of gross domestic product (GDP) in 2024 and 24.9% of GDP in 2034.
Of course, all of this is irrelevant, because even the CBO now admits that in the long-term, it’s game over as there is no inflection point that makes future deficits grind down to zero, even in the most optimistic scenario.
The perpetually confused Joe Biden will probably take credit for the disastrous US budget.
US Treasury Secretary (and former Fed Chair) Janet Yellen says the US economy is in excellent shape. Is she a genius and sees something that rest of us don’t? Or is she a partisan thug like Shap Shot’s Gilmore Tuttle?
Yellen brags about rising wages and declining inflation. Well, average hourly earnings YoY are now 4.1%. However, home prices are growing at 6.5% year-over-year (YoY) and electricity prices are up 6.1% YoY. Food CPI grew at 2.1% in May. Yellen ignores the string of 10%+ increases in 2022-2023 making eating unaffoprdable for millions.
I doubt if Yellen could run a lemonade stand in my neighborhood. But like Gilmore Tuttle, maybe she could run a donut shop!
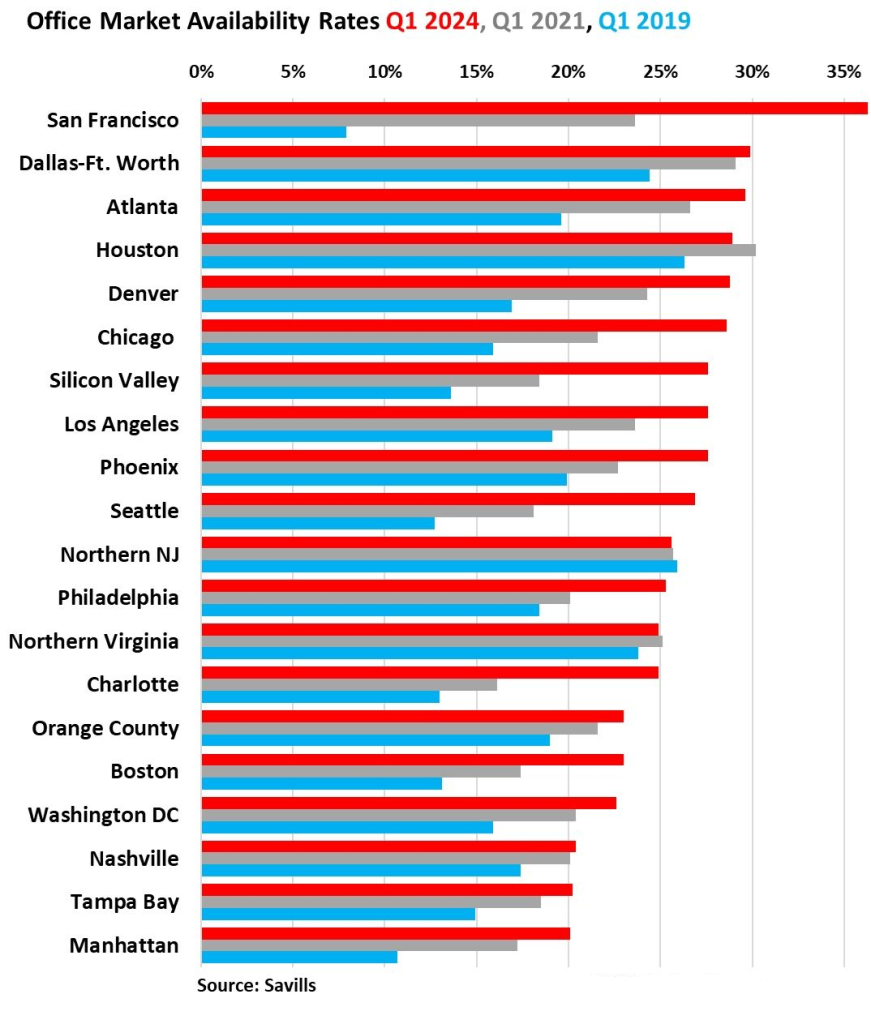
And the CRE office market is showing disaster. San Francisco office market availability rates have soared in Q1 2024 to over 35%, up from less than 10% in Q1 2019.
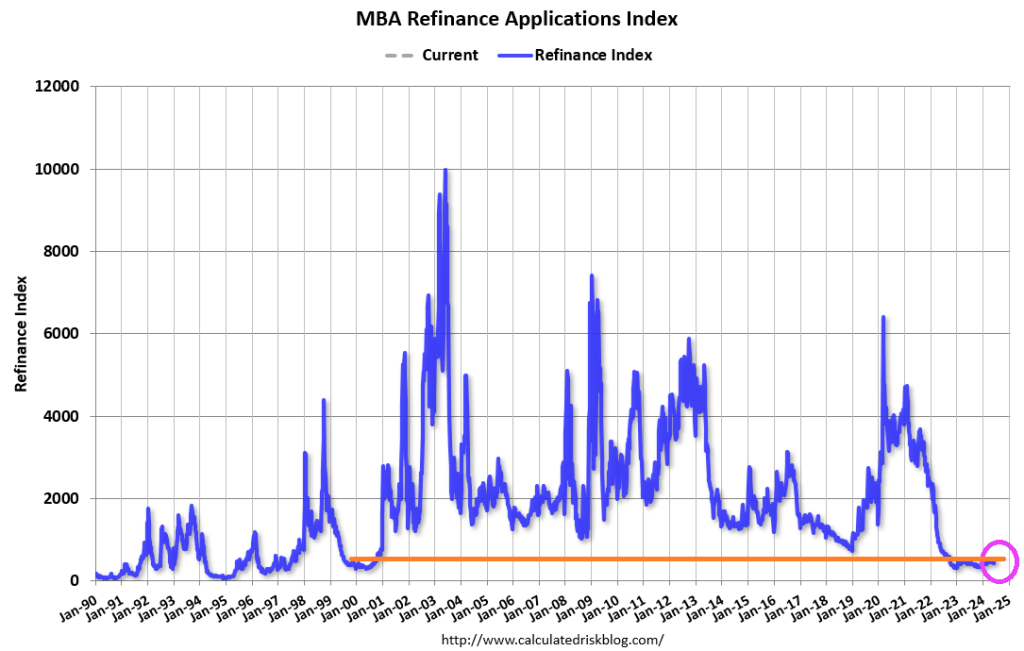
Well, it was the first week of June. Mortgage applications usually peak in May, so we are on the historic “dark side of the moon” for mortgage demand.
Mortgage applications increased 15.6 percent from one week earlier, according to data from the Mortgage Bankers Association’s (MBA) Weekly Applications Survey for the week ending June 7, 2024.
The Market Composite Index, a measure of mortgage loan application volume, increased 15.6 percent on a seasonally adjusted basis from one week earlier. On an unadjusted basis, the Index increased 26 percent compared with the previous week. The seasonally adjusted Purchase Index increased 9 percent from one week earlier. The unadjusted Purchase Index increased 19 percent compared with the previous week and was12 percent lower than the same week one year ago.
Beware of getting too excited about the19% WoW increase. It is 19% off an extremely low number.
The Refinance Index increased 28 percent from the previous week and was 28 percent higher than the same week one year ago.
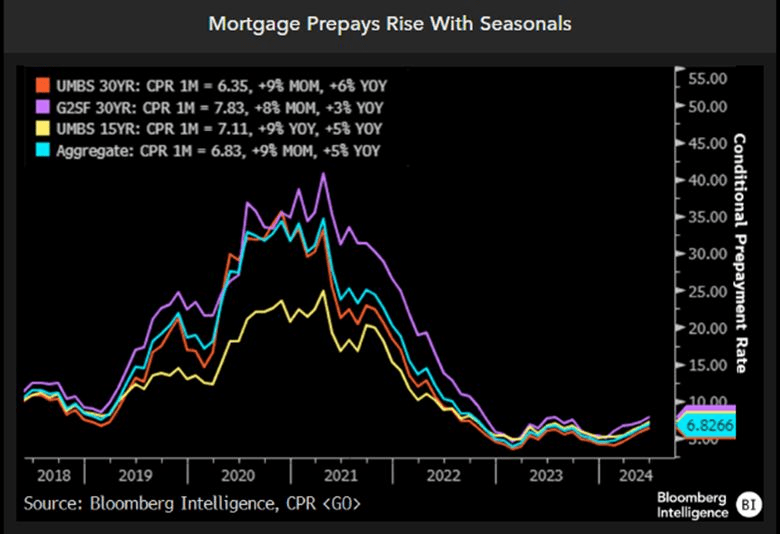
This charts sums up the seasonal component to prepays.
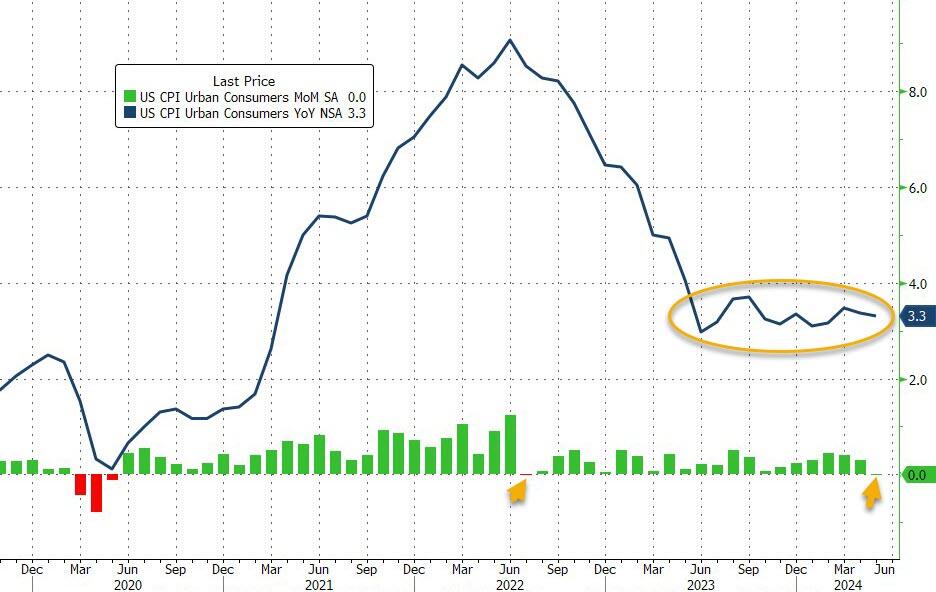
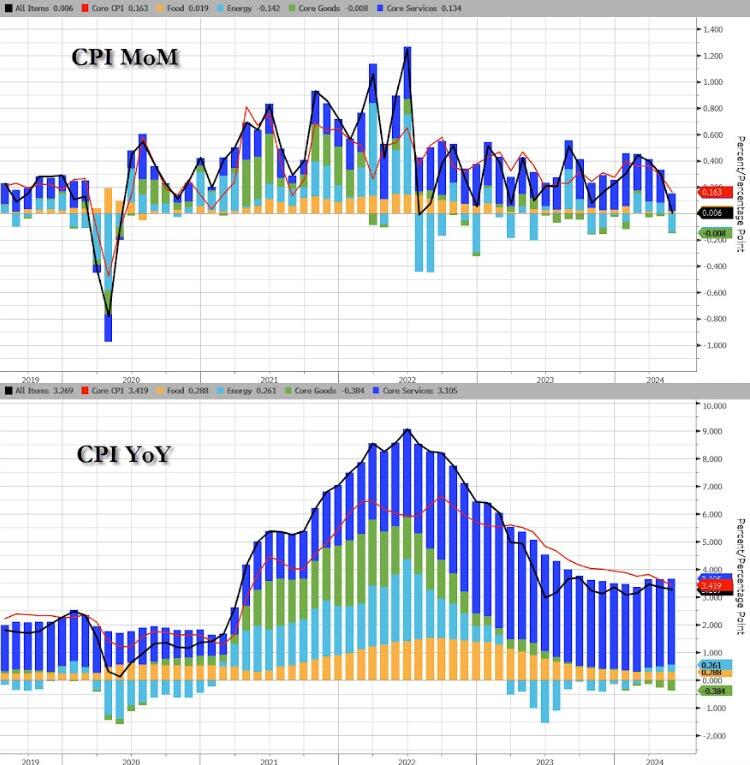
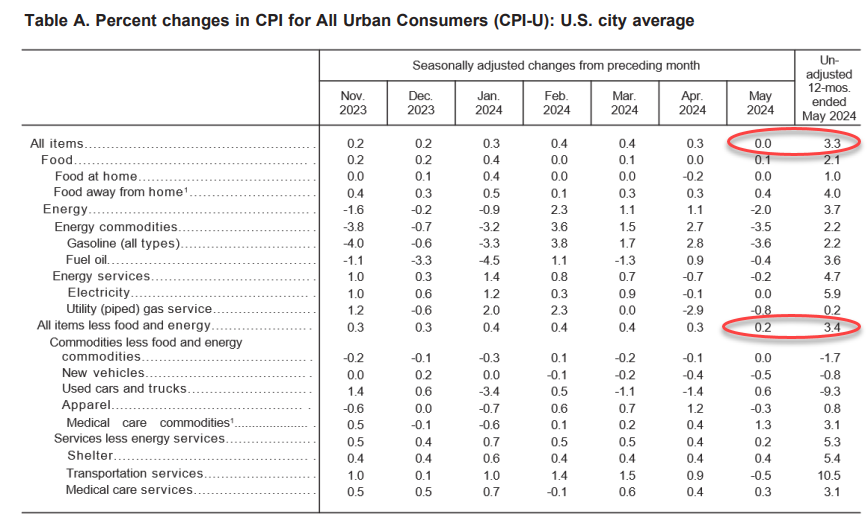
Energy was the biggest drag on the headline CPI MoM…(Gasoline prices tumbled 3.6% in May from April, one key reason why the headline CPI was flat on the month. )
Source: Bloomberg
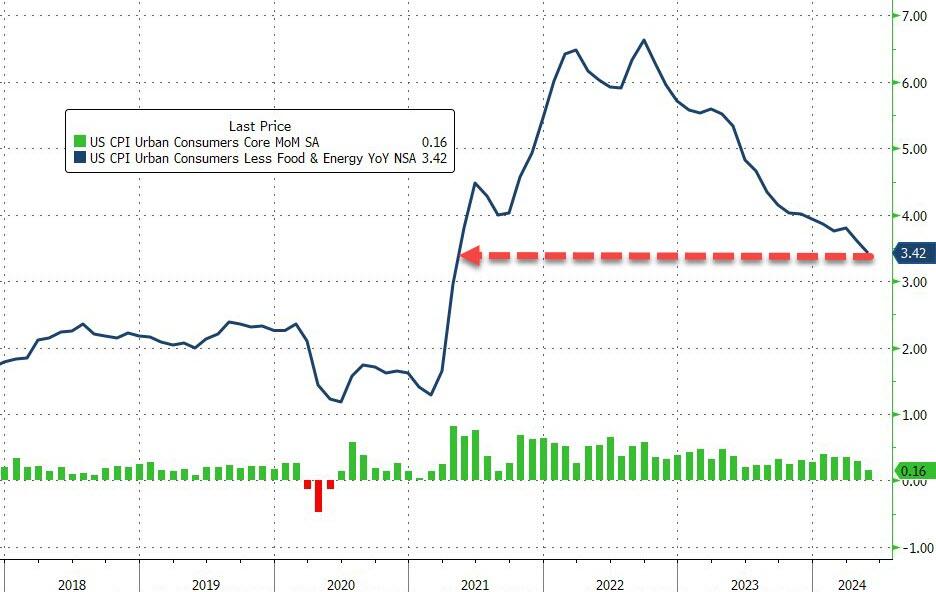
Core CPI rose 0.2% MoM (below the 0.3% exp) pulling the YoY change down to 3.4% (from 3.6% and below the 3.5% exp). That is the lowest Core CPI YoY since April 2021…
Source: Bloomberg
Core CPI has not had a down-month since President Biden was elected.
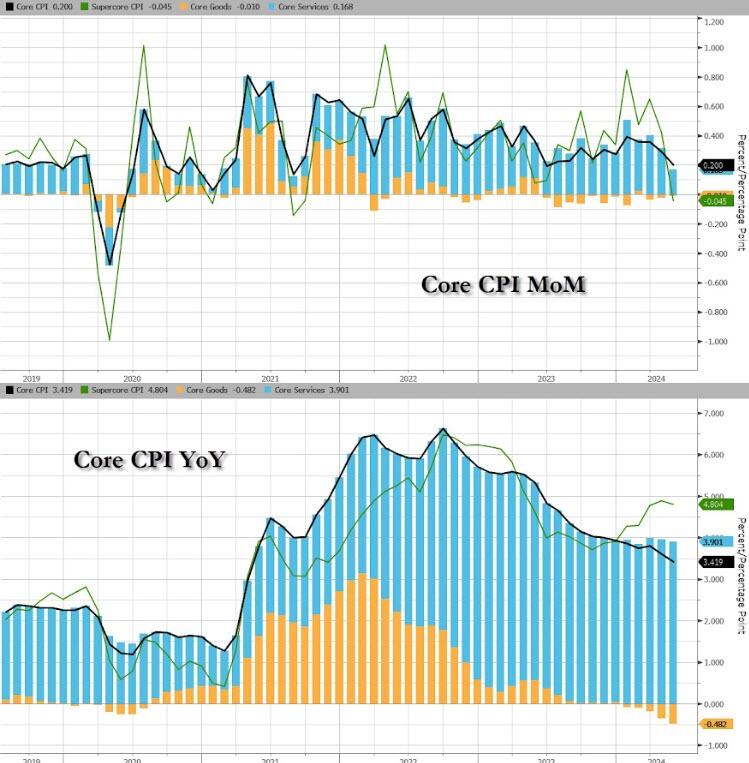
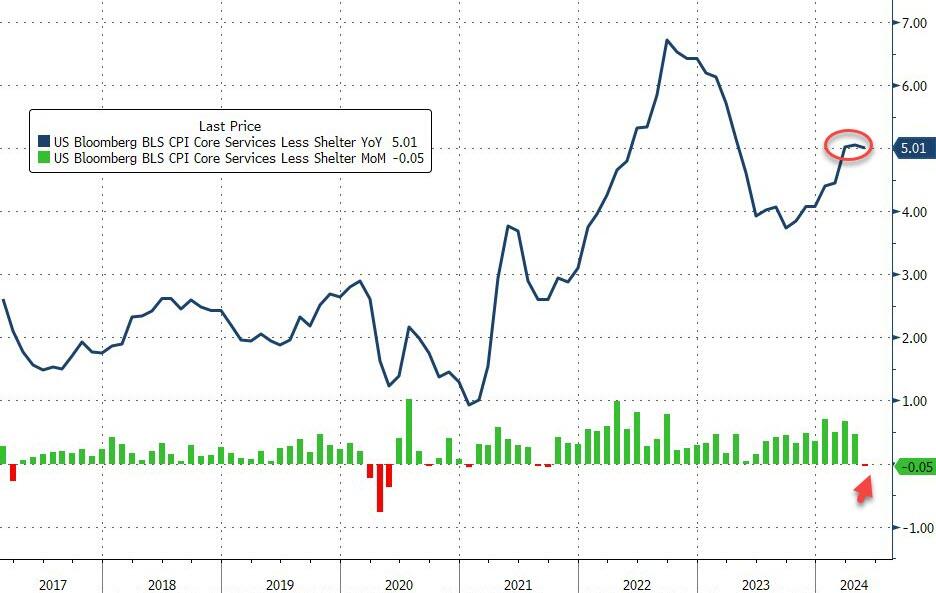
Core Services inflation slowed notably MoM…
Source: Bloomberg
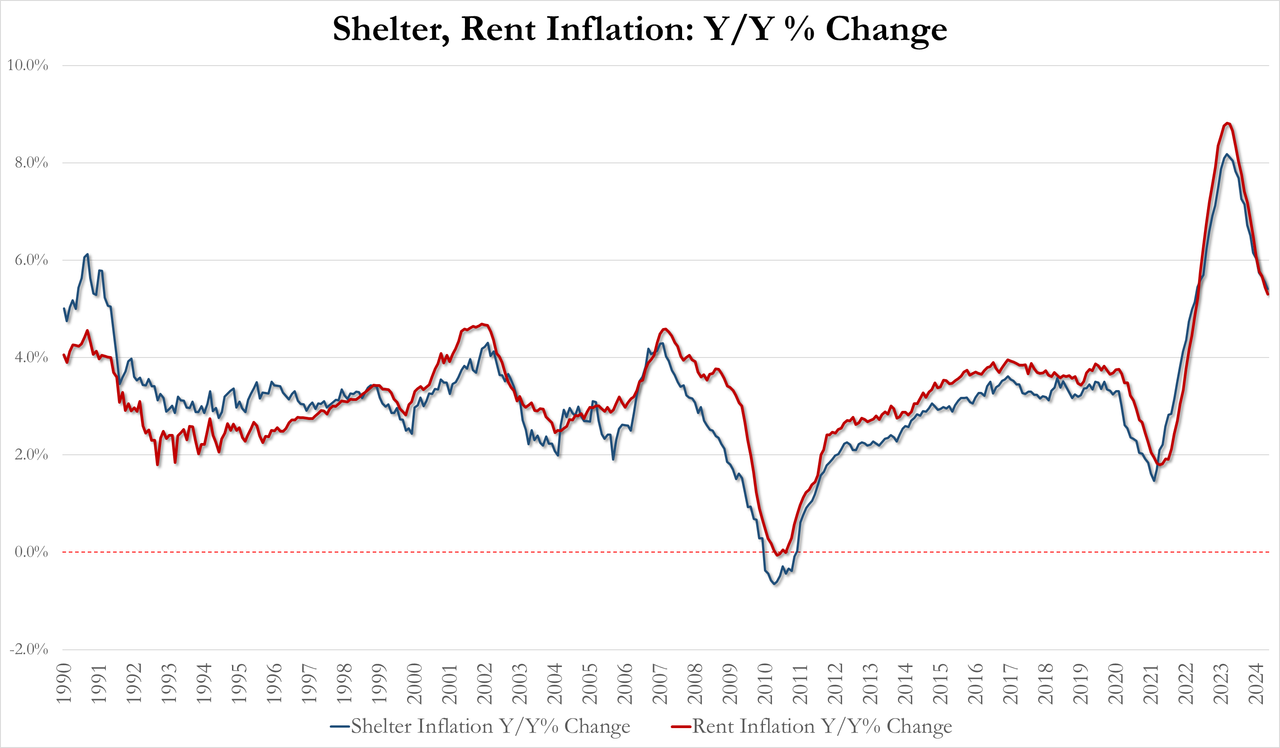
The shelter index increased 0.4 percent in May and was the largest factor in the monthly increase in the index for all items less food and energy.
May Shelter inflation 5.41% YoY, down from 5.55% in April and lowest since April 2022
May Rent inflation 5.30% YoY, down from 5.44% and lowest since May 2022
For context on how important housing costs are to US inflation data, the shelter index rose 5.4% over the last year, making up over two thirds of the total 12-month increase in the all items less food and energy index.
Source: Bloomberg
It does make one wonder were exactly the BLS is getting their BS OER data from…
The full breakdown…
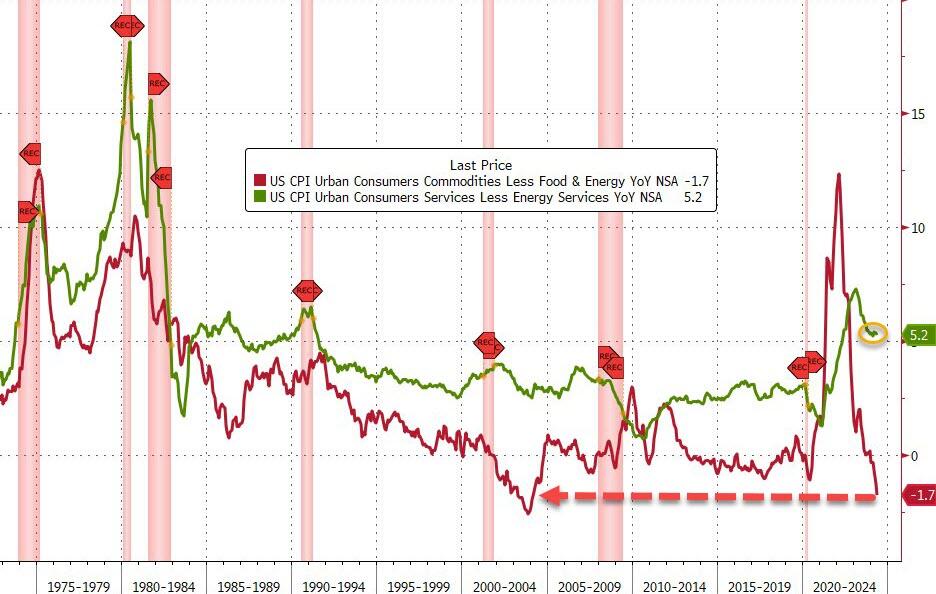
Services INflation remains awkwardly stuck above 5% while Goods DEflation is at its weakest since January 2004…
Source: Bloomberg
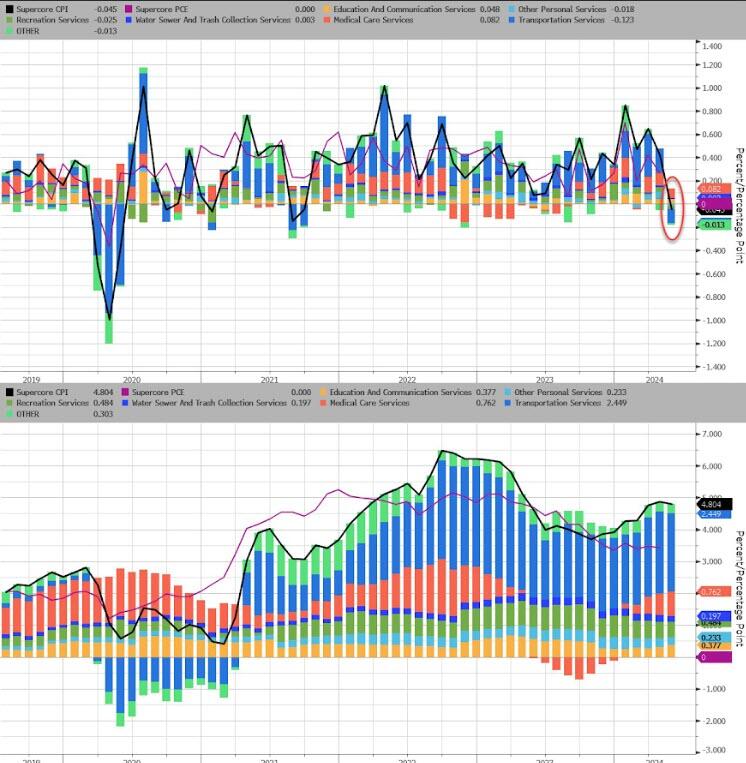
SuperCore CPI fell 0.05% MoM – its first drop since Sept 2021, but that left the YoY level still above 5.0%…
Source: Bloomberg
Transportation Services costs tumbled MoM to drag SuperCore lower MoM…
Source: Bloomberg
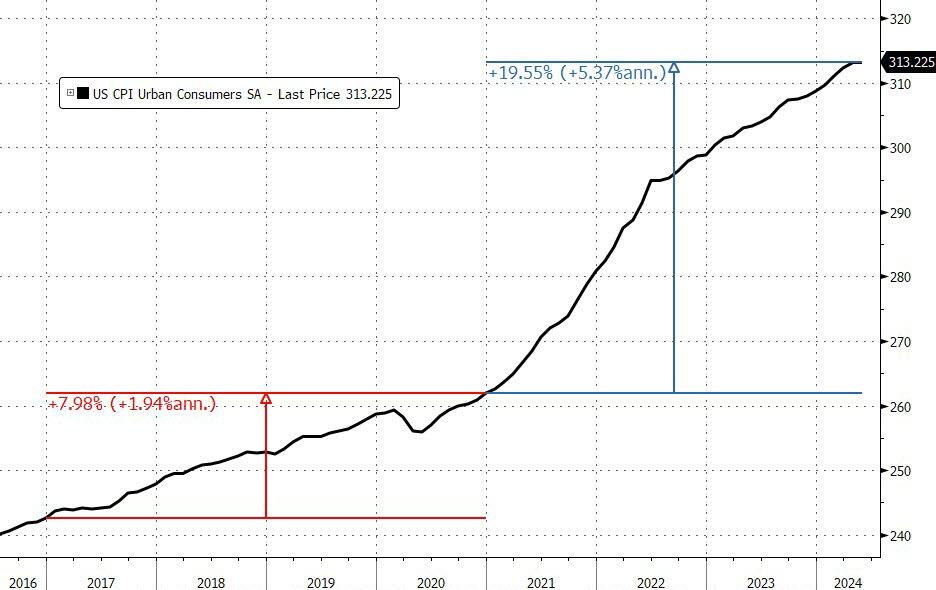
We note that consumer prices have not fallen in a single month since President Biden’s term began (July 2022 and May 2024 was the closest with ‘unchanged’), which leaves overall prices up over 19.5% since Bidenomics was unleashed (compares with +8% during Trump’s term).
And prices have never been more expensive…
That is an average of 5.4% per annum (almost triple the 1.9% average per annum rise in price during President Trump’s term).
Source: Bloomberg
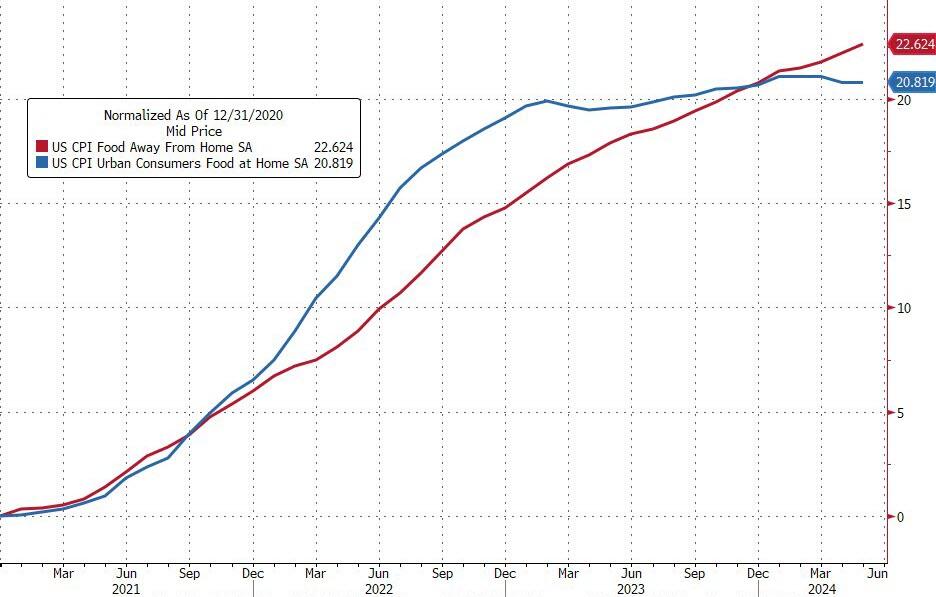
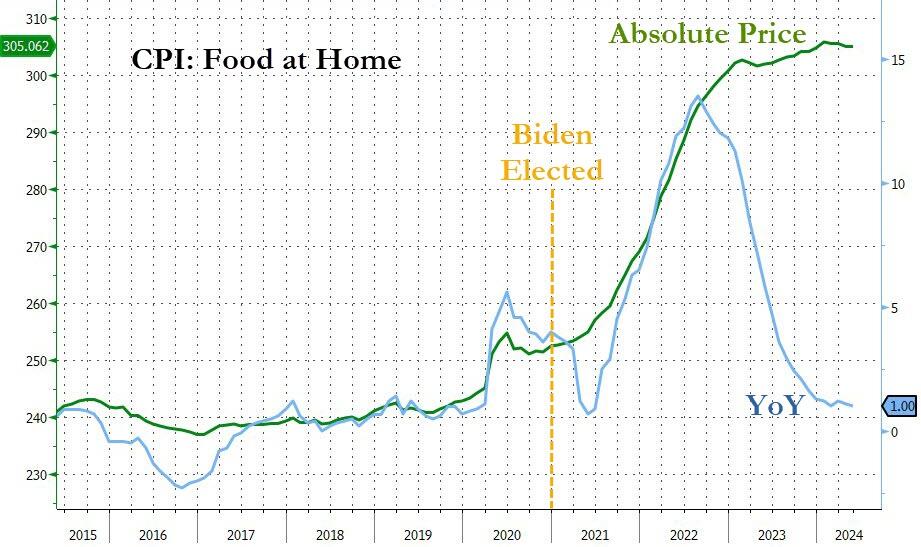
Since President Biden was elected, food prices at home are up around 21% and food prices away from home are up almost 23%…
And while the Biden administration will continue to gaslight voters with comments like “inflation is tumbling”… every man, woman, and child who actually buys food knows prices have NEVER been higher…
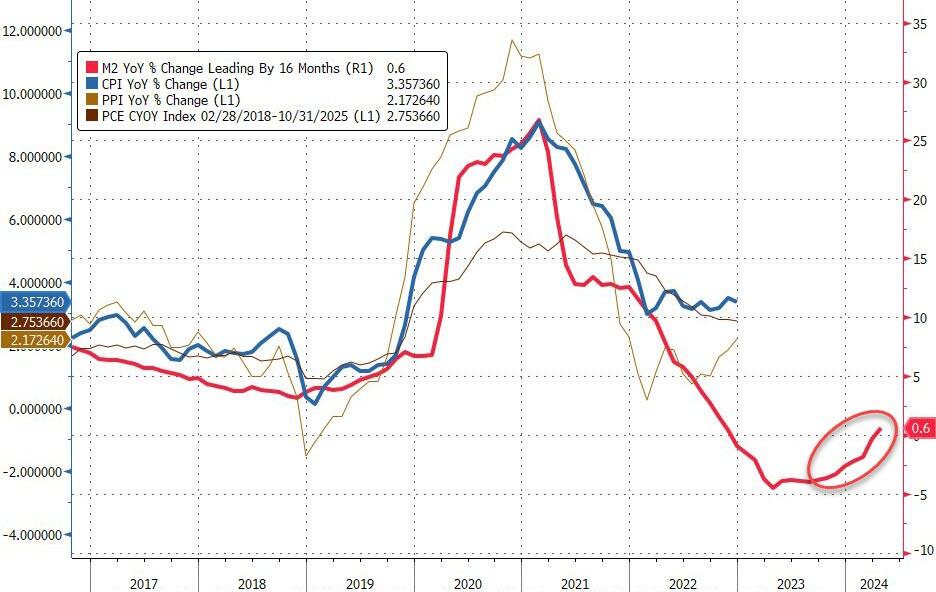
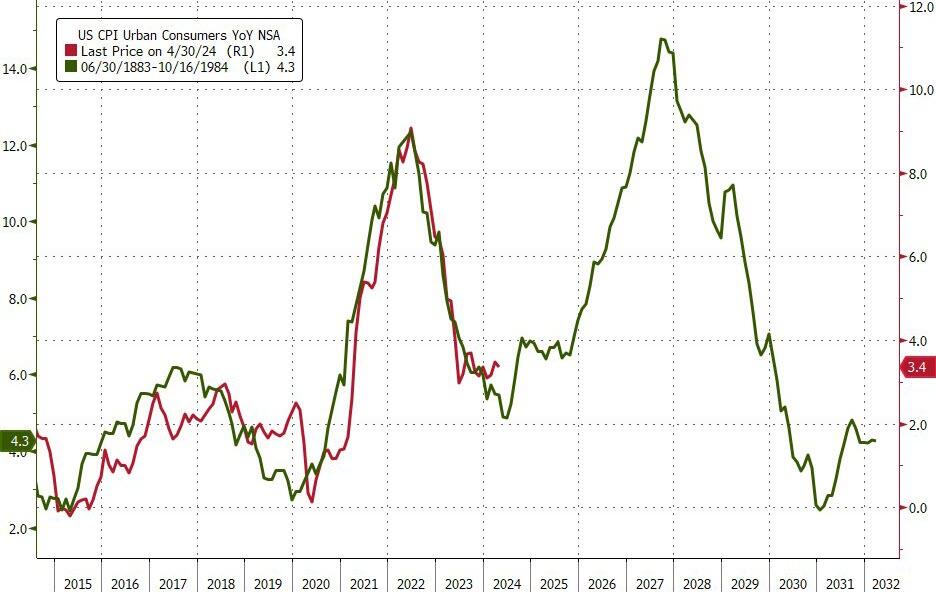
Finally, while the ‘flations’ have broadly tracked M2 lower, we note that M2 YoY is now starting to turn back higher once again…
Source: Bloomberg
Will the next President and Fed head face a 70s redux?
Source: Bloomberg
And is this guaranteed if Powell decides “insurance” cuts are required (for Biden?)
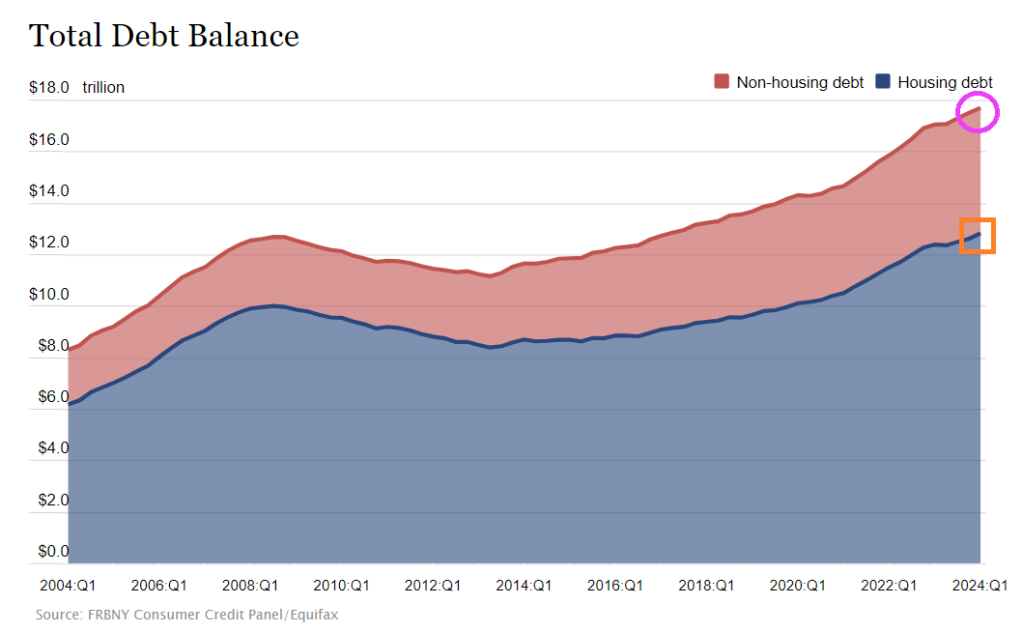
Too much debt should be the theme song for the US! Both for consumers and the Feral government (not a typo!)
Consumer credit increased by +$6.403 billion in April, much softer than consensus estimate of +$10 billion … more notable, however, was March data, given initial read of +$6.274 billion was revised down to -$1.099 billion.
Not to mention $13 trillion in mortgage debt (1-4 unit housing), but at least that is backed by property. Unlike The Feral government who borrows/prints with only a promise.
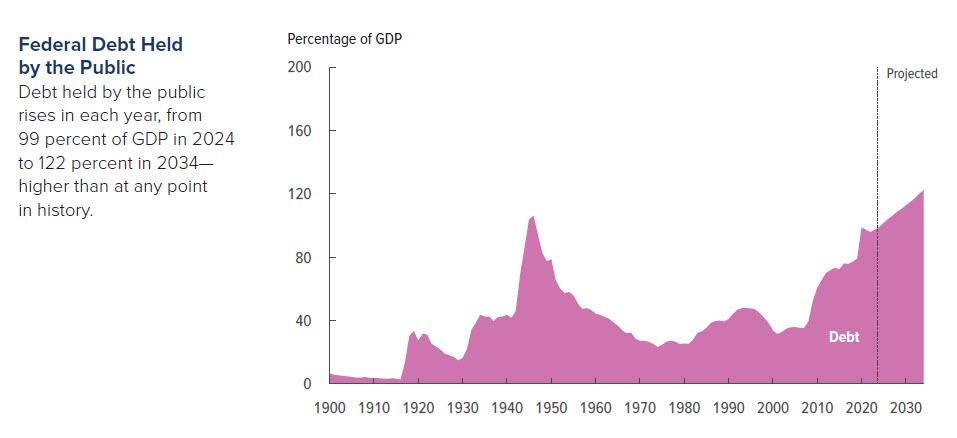
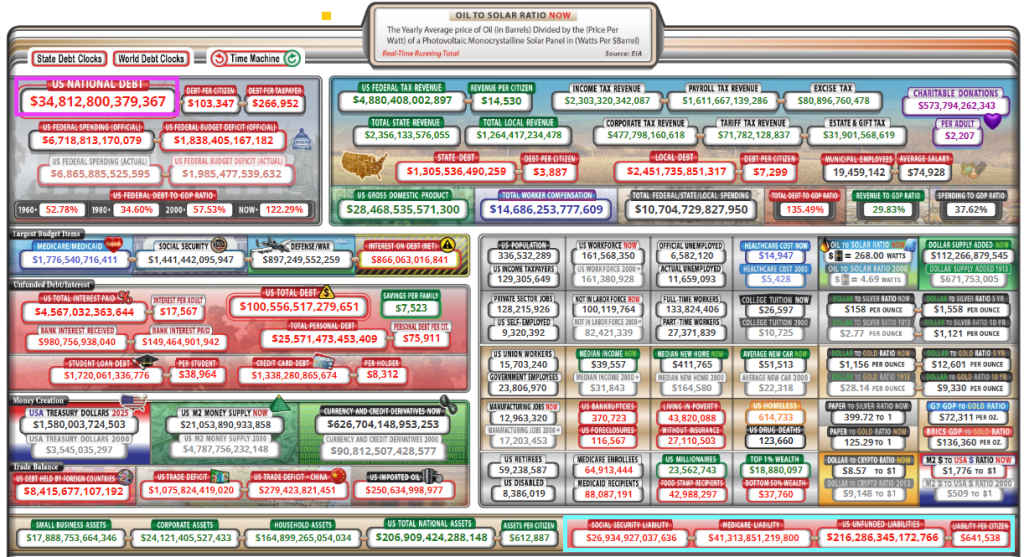
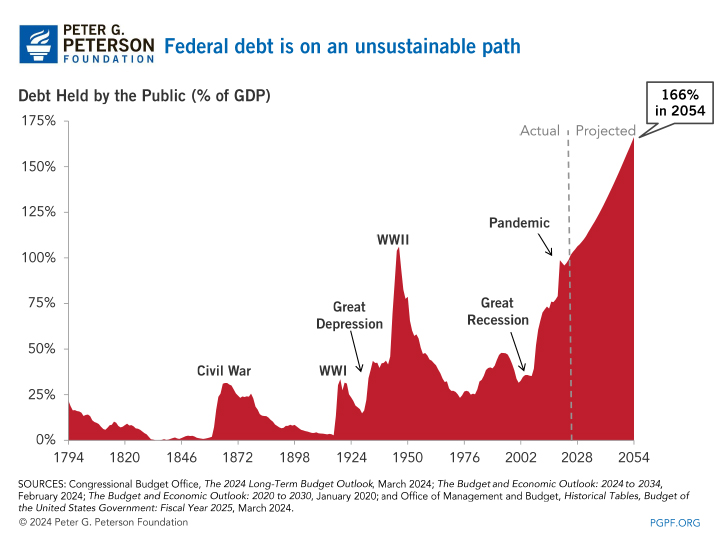
And growing awfully fast. Note that since the “pandamic”, debt as % of GDP has exceeded 100% and is projected to hit 166% by 2054. But look at the UNFUNDED LIABILITIES the need to be paid ($216+ TRILLION ($641.5k per citizen!). Pretty soon, we (the 99%) will be back on the chain gang paying for endless wars and government corruption. I wish Biden, Schumer, McConnell and other swamp creatures would consider all the spending the government is on the hook for rather than focus on spending that will help them get elected perpetually. There is no middle of the road anymore. The US is broke and has too much debt.
Of course, President Biden wants endless spending on wars (Ukraine, Israel, etc) and now wants an unlimited check to pay for the next pandemics. The Pretenders’ song “My City Was Gone” seems to be appropriate for the US as “My County Is Gone.”
Of course, some “economists” claim that the US can borrow/print unlimited amounts of money … until they can’t.
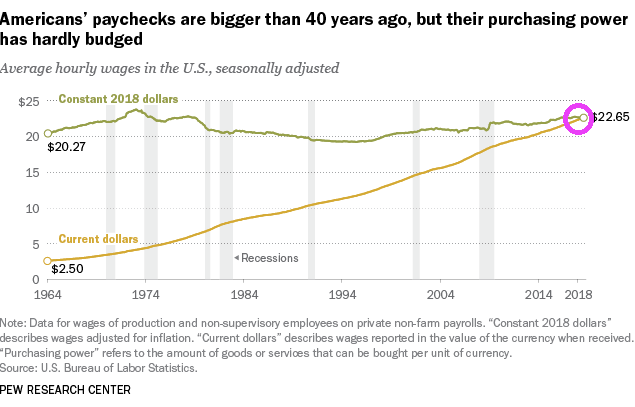
To begin with, America’s paychecks are bigger than 40 years ago, but purchasing power of those larger paychecks is about the sames as it was 40 years ago. Great job Washington DC!!! … NOT!!!!
Meanwhile, credit card delinquencies are at the highest level since 1991.
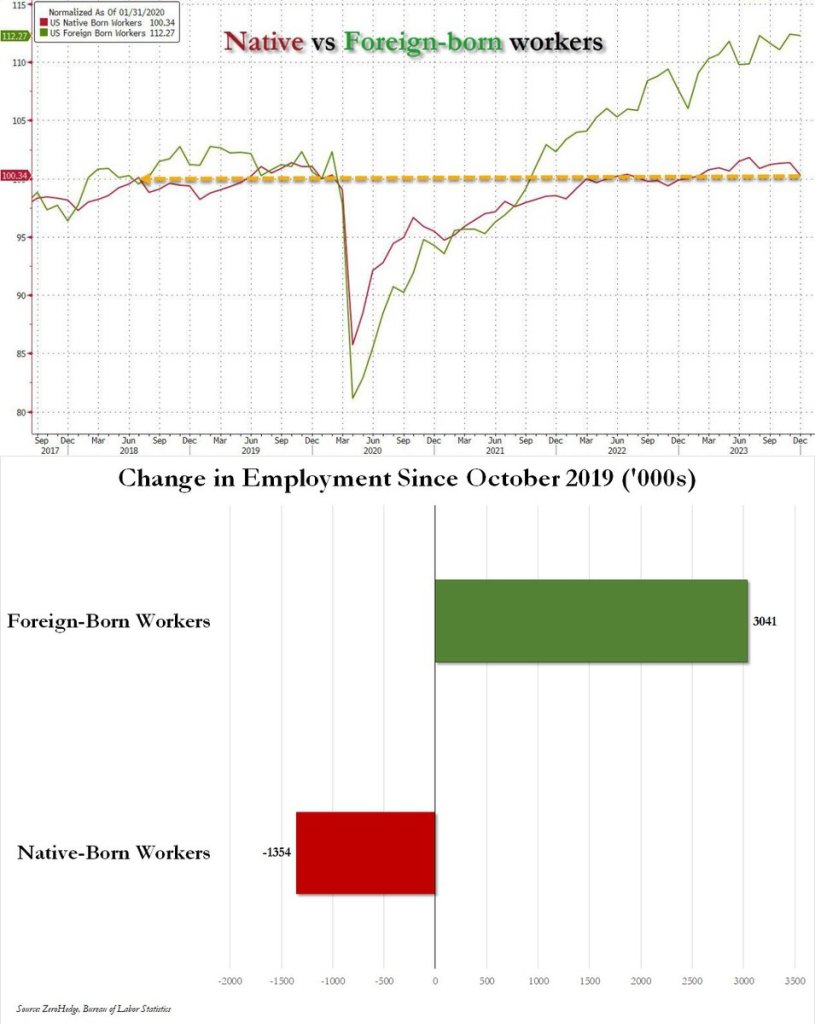
Biden’s open borders policies are like something out of the book/film “Gangs of New York.” This time it isn’t Irish immigrants that are rioting/looting, it iis illegal immigrants from Latin America, China, and the Middle East. Essentially replacing native-born workers with foreign-born workers.
Since COVID, the growth in foreign-born workers have blow away the growth in native-born workers. So much so that since 2019, native-born workers have actually lost jobs while foreign-born workers have surged.
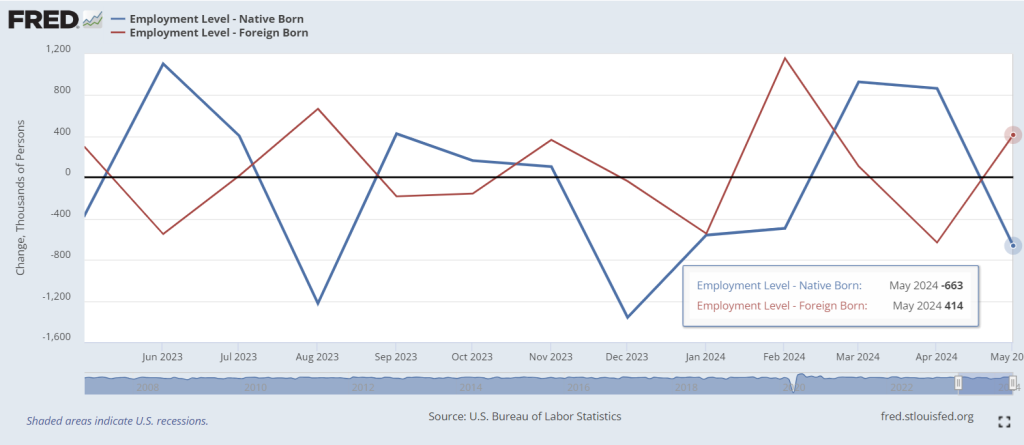
But for May 2024, native-born workers lost 463k jobs while foreign-born gained 414k jobs.
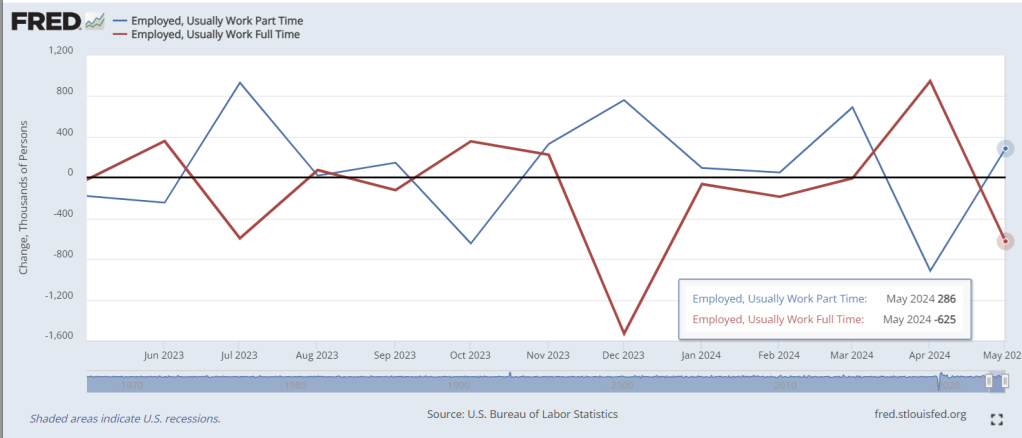
In May, part-time jobs soared by 286k jobs while full-time jobs nosedived by -625k jobs.
Finally, the difference between the BLS survey and the more accurate Household Survey is huge!


You must be logged in to post a comment.