Not surprisingly, the median price of new home sales are up 8.2% MoM (since September).
The Fed’s minutes for their last FOMC meeting will be out at 2pm EST. Let’s see if they discuss WHY they haven’t reduced their balance sheet by much which is contributing to asset bubbles.
Here is The Fed’s Dots plot from the September meeting. I get the impression that The Fed thinks that their target rate will be coming down in 2024 and after.
The global economic slowdown has one nice unintended consequence: as the 10-year Treasury yield softens, mortgage rates decline.
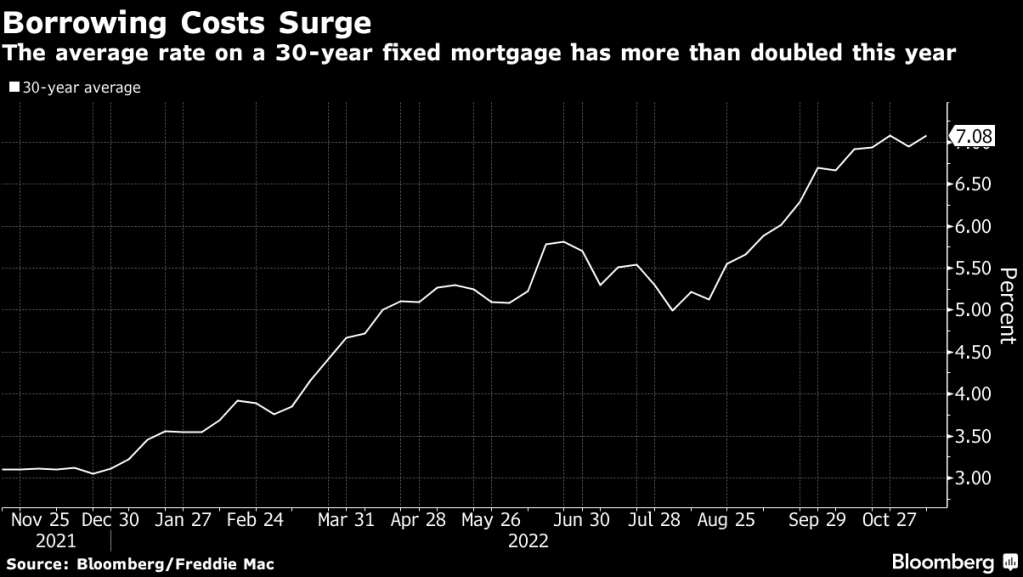
US mortgage rates retreated sharply for a second week, hitting a two-month low and providing a bit of traction for the beleaguered housing market.
The contract rate on a 30-year fixed mortgage decreased 23 basis points to 6.67% in the week ended Nov. 18, according to Mortgage Bankers Association data released Wednesday.
Rates have plunged nearly a half percentage point in the past two weeks, the most since 2008, as recession concerns mount, inflation shows signs of cooling and a number of Federal Reserve officials say it may soon be appropriate to slow the pace of monetary tightening.
The slide in borrowing costs helped stir demand as the group’s index of applications to buy a home climbed 2.8%. That marked the third-straight increase since the gauge stumbled to the weakest level since 2015.
The pickup in demand allowed the overall measure of mortgage applications, which includes refinancing, to rise for a second week, but it still remains depressed. The index of refinancing activity edged up from a 22-year low.
The Refinance Index increased 2 percent from the previous week and was 86 percent lower than the same week one year ago.The unadjusted Purchase Index increased 9 percent compared with the previous week and was 41 percent lower than the same week one year ago.
But you need an electron microscope to see the increase in both purchase and refi apps.
One indicator of a slowing global economy is the decline of FANG (Facebook, Amazon, Netflix, Google) with declining liquidity.
The US housing market is slowing, to be sure. Yesterday’s existing home sales (EHS) report revealed that US EHS were down -28.43% YoY and the median price of EHS slowed to 6.6% YoY.
But that is just the surface of the EHS report for October. Once I removed inflation (CPI YoY) from the numbers, we are left with REAL median price of EHS growth of -1.17% and REAL average hourly earnings YoY of -3.0% YoY. The REAL 30-year mortgage rate is -5.25%. That reveals how horrible inflation is in the US.
It is important to note that EHS numbers are lower in October than they were before Covid stimulypto (my name for the massive spending spree by Congress and massive injection of monetary stimulus by The Fed. Even the REAL 30-year mortgage rate is negative at -0.5254%.
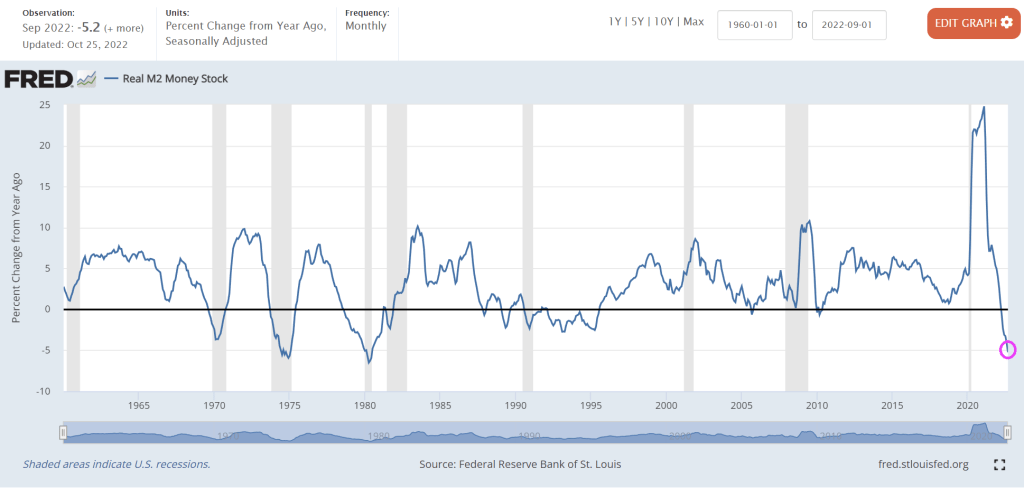
The Philadelphia Fed’s Business Outlook plunged to 1-9.40% YoY, the worst since 2012. Notice how the Philly Phed Plunge is related to M2 Money growth YoY.
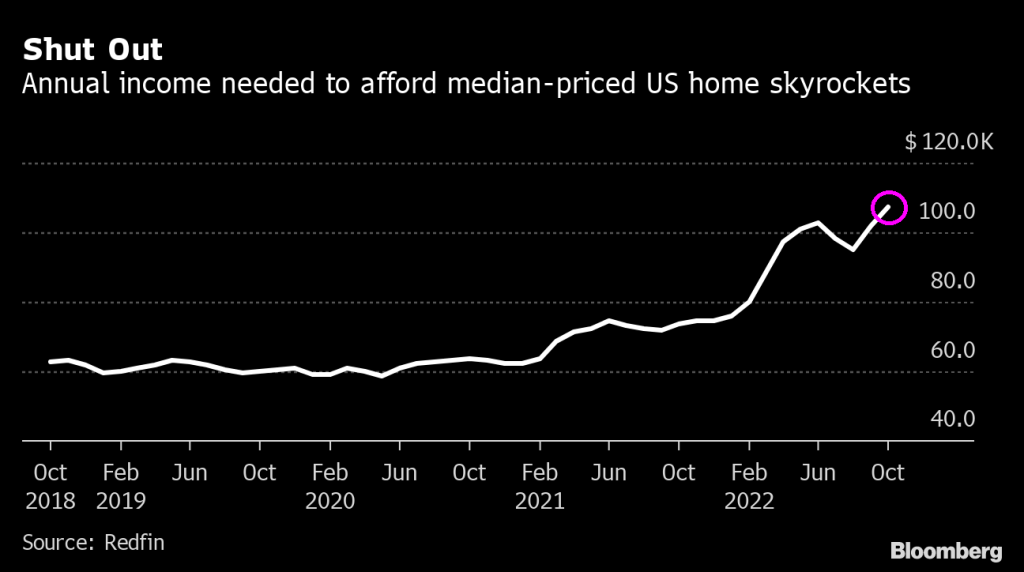
Of course, it is easy to blame the figure on rapidly rising mortgage rates and Federal Reserve tightening.
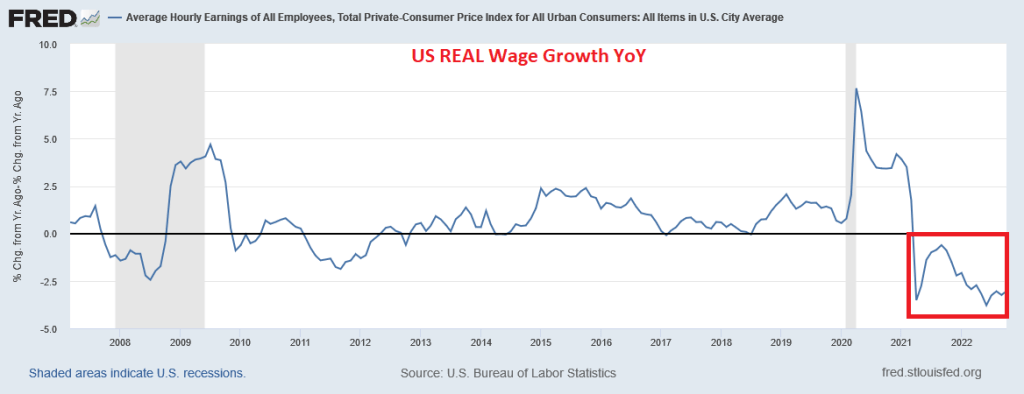
But the rest of the story (as Paul Harvey used to say) is that US REAL wage growth has been NEGATIVE for 19 straight months. This alone makes housing unaffordable for the middle class and low wage workers.
Again, why are Biden and Trudeau wearing Mao jackets in Bali? And why is Biden looking like a robot?? Biden does look like he is saying “Take me to my leader, Pei.”
US mortgage rates fell last week by the most since the end of July, slipping below 7% and helping generate a bounce in purchase applications that otherwise remain depressed, but only in the Seasonally Adjusted data. The NON-Seasonally Adjusted data show a hefty decline.
The contract rate on a 30-year fixed mortgage decreased 24 basis points to 6.9% in the week ended Nov. 11, according to Mortgage Bankers Association data released Wednesday. The group’s index of applications to buy a home rose 4.4% — the most since June — but is still near the weakest level since 2015.
But the bounce was in Seasonally Adjusted data only. The NON-seasonally adjusted data remained depressed.
Mortgage applications decreased -10.0 percent SA from one week earlier, according to data from the Mortgage Bankers Association’s (MBA) Weekly Mortgage Applications Survey for the week ending November 11, 2022. This week’s results include an adjustment for the observance of Veterans Day.
The Refinance Index decreased -11.44% percent from the previous week and was 88 percent lower than the same week one year ago.The unadjusted Purchase Index decreased -10 percent compared with the previous week and was 46 percent lower than the same week one year ago.
Mortgage purchase applications will continue to fall in NSA terms since it is the Winter and home buying season won’t really start until January. Refinancing applications actually dropped -11.44% even with the drop in mortgage rates.
The data. As my former students know, I like the “raw” data, better known as NON-seasonally adjusted (NSA) data and avoid seasonally-adjusted data (SA) since it hides what is going on.
And on The Fed Futures Front, The Federal Reserve is still looking a hiking their target rate from 4% to just under 5%.
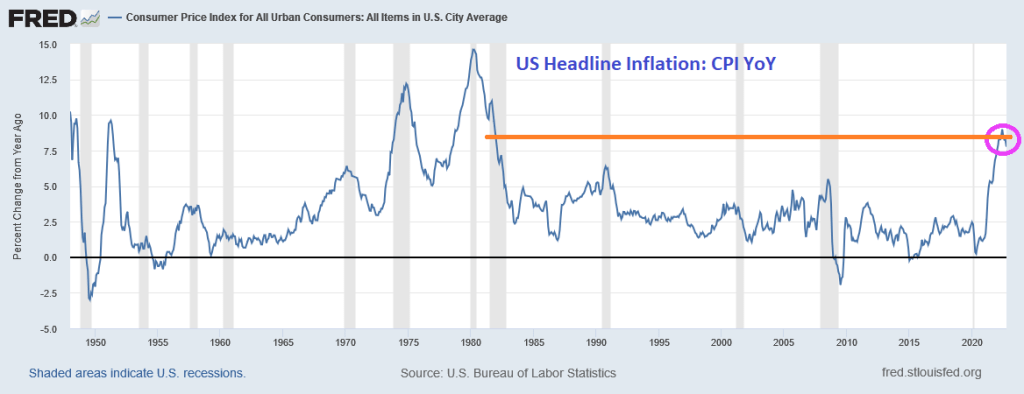
Between Biden’s green energy mandates and the spendathon by the Pelosi/Schumer led Keynesians in Congress (or Kongress), we saw a 40-year high in inflation.
But with roaring Bidenflation, we have the S&P 500 index experiencing, in real terms, the worst performance since 1872.
That is, the worst since President Ulysses Grant.
President Biden is dressed in his Mao outfit with Canada’s Justin Trudeau.
And the WEF’s Klaus Schwab.
At least Biden, Trudeau and Schwab are wearing different colored Mao jackets.
The evidence from the last thirty years is clear. Keynesian policies leave a massive trail of debt, weaker growth and falling real wages. Furthermore, once we look at each so-called stimulus plan, reality shows that the so-called multiplier effect of government spending is virtually inexistent and has long-term negative implications for the health of the economy. Stimulus plans have bloated government size, which in turn requires more dollars from the real economy to finance its activity.
As Daniel J. Mitchell points out, there is evidence of a displacement cost, as rising government spending displaces private-sector activity and means higher taxes or rising inflation in the future, or both. Higher government spending simply cannot be financed with much larger economic growth because the nature of current spending is precisely to deliver no real economic return. Government is not investing; it is financing mandatory spending with resources of the productive sector. Every dollar that the government spends means one less dollar in the productive sector of the economy and creates a negative multiplier cost.
When society decides to use a certain part of the resources generated by the productive sector for non-economic return activities, be it social spending or mitigation of threats, it can only do it by understanding how much of the productive capacity of the economy is able to sustain a larger cost. When costs are not considered as a burden, but considered as entitlements that can only grow, the productive capacity is not strengthened, but weakened.
The main problem of the past decades, but particularly since 2008, is that government spending and monetary policy have become solutions of first resort to any slump in economic activity, even if that decline was created by government decisions, such as shutting down the economy due to a health crisis. Furthermore, government spending increases and loose monetary policy continued even in growth periods. This, in turn, creates an unsustainable public deficit that needs to be monetized or refinanced. Both mean a larger harm for the productive sector as the debt increase leads to higher taxes for everyone but also a soaring cost of living coming from the destruction of purchasing power of the currency.
Government spending does not boost private sector activity, even less so when the entire budget is spent on non-investment outlays. It is even worse when citizens believe that infrastructure or real economic return investments should be conducted with taxpayers’ money. If an investment is productive and economically viable there is no need to involve the government. At best, the government should only participate as a co-investor, as the example of technology and defence shows, but never as a resource allocator for a simple reason. Public intervention is always aimed at perpetuating the existing inefficiencies and maximizing the budget. Efficient resource allocation cannot come from entities that have a core interest in expanding the budget and always perceive any inefficiency or poor result as the consequence of not having spent enough.
Yes, US public debt has exploded, particularly since the 2008 financial crisis and then again the Covid outbreak of 2020.
And inflation is near a 40-year high.
Then we have 19 consecutive months of negative wage growth in the US.
Biden is apparently doubling down on “Green Schemes” now that the US House of Lords (aka, Senate) remain under Keynesian control (aka, Democrat). So watch for inflation to start increasing again.
The Fed’s favorite yield curve measure, the implied yield on 3-month T-Bills in 18 months less the 3-month T-bill yield has inverted. Note that this curve inverts prior to a recession.
The new face of reckless Fed policy and Federal spending. 19 straight months of negative REAL earnings growth as America re-elects the same irresponsible fools that are turning the US into Venezuela.


You must be logged in to post a comment.