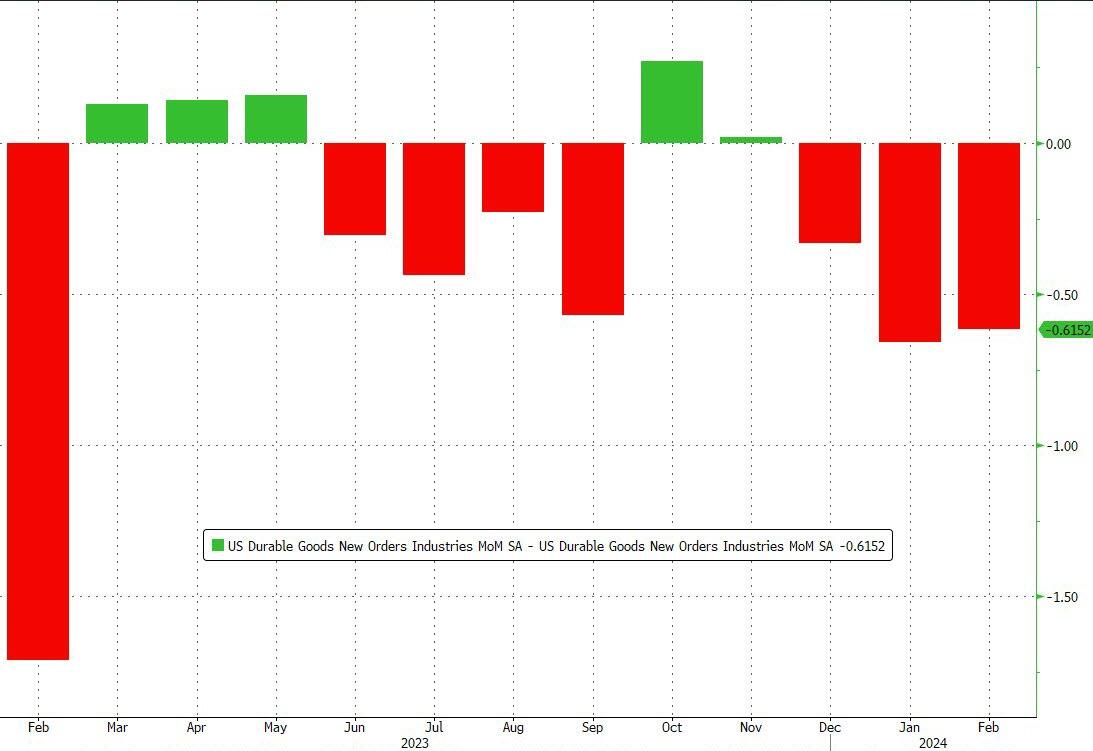
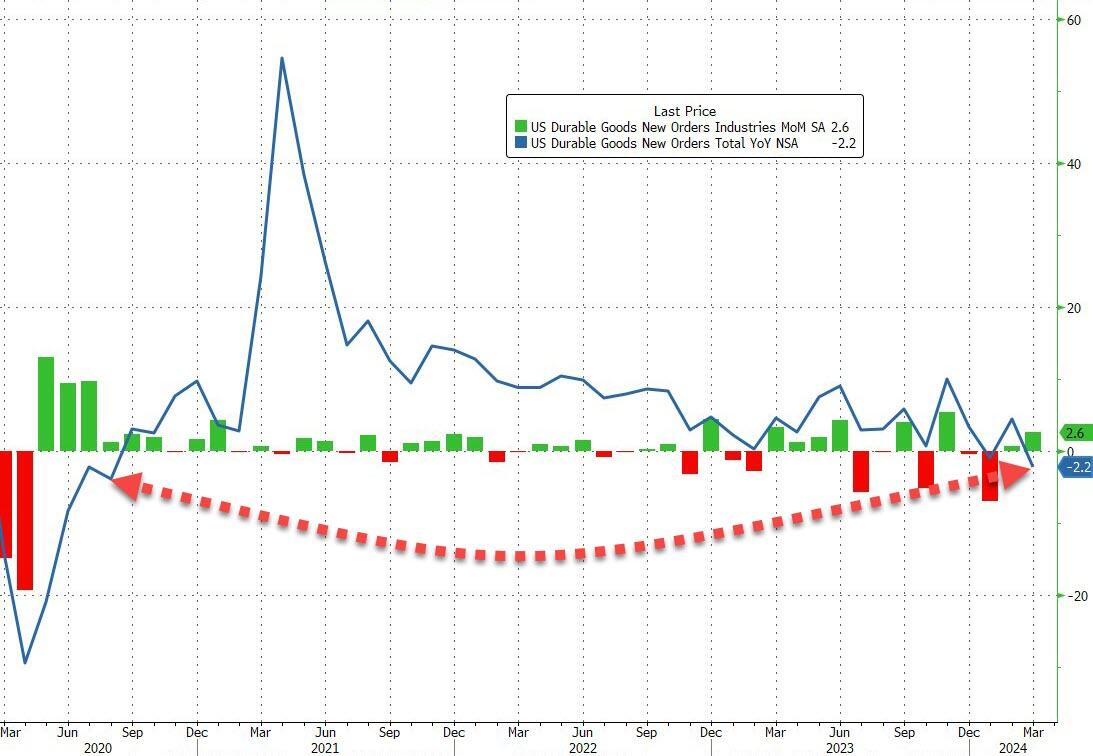
Manufacturer’s Durable Goods New Orders growth peaked in April 2021, thanks in part to M2 Money Growth peaking in February 2021. And its been all downhill since then.
This is the 8th downward revision of durable goods orders in the last year…
Source: Bloomberg
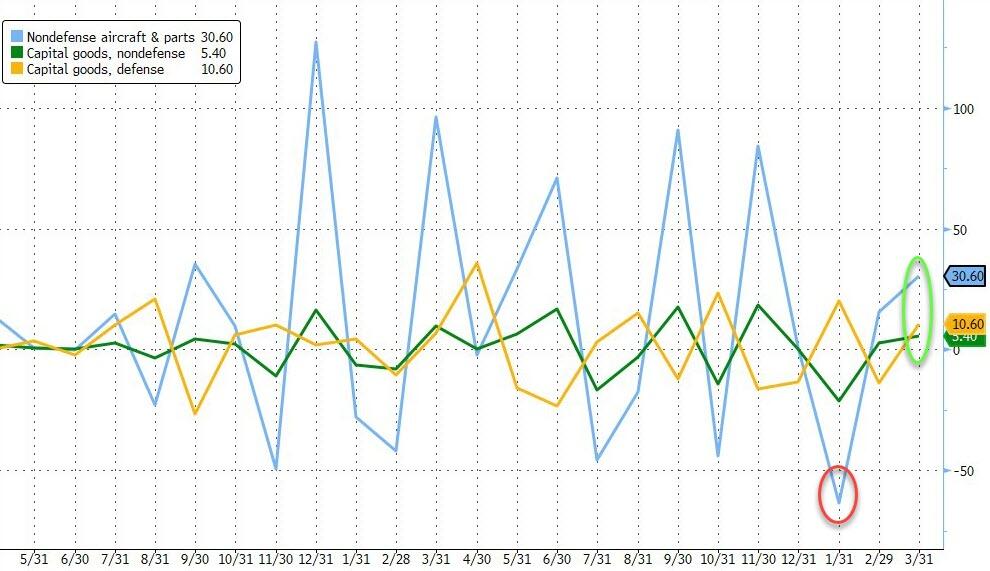
Under the hood, defense and non-defense capital goods orders rose with non-defense aircraft orders surging over 30% MoM…
Source: Bloomberg
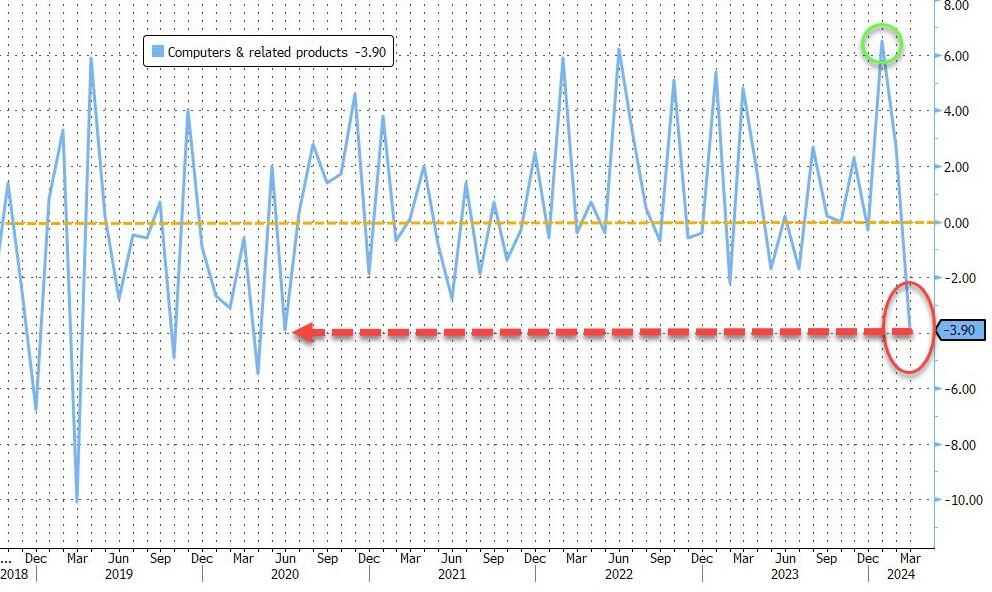
But… it looks like the AI bubble just burst as Computer & related Products orders plunged 3.9% MoM – the biggest drop since COVID lockdowns…
Source: Bloomberg
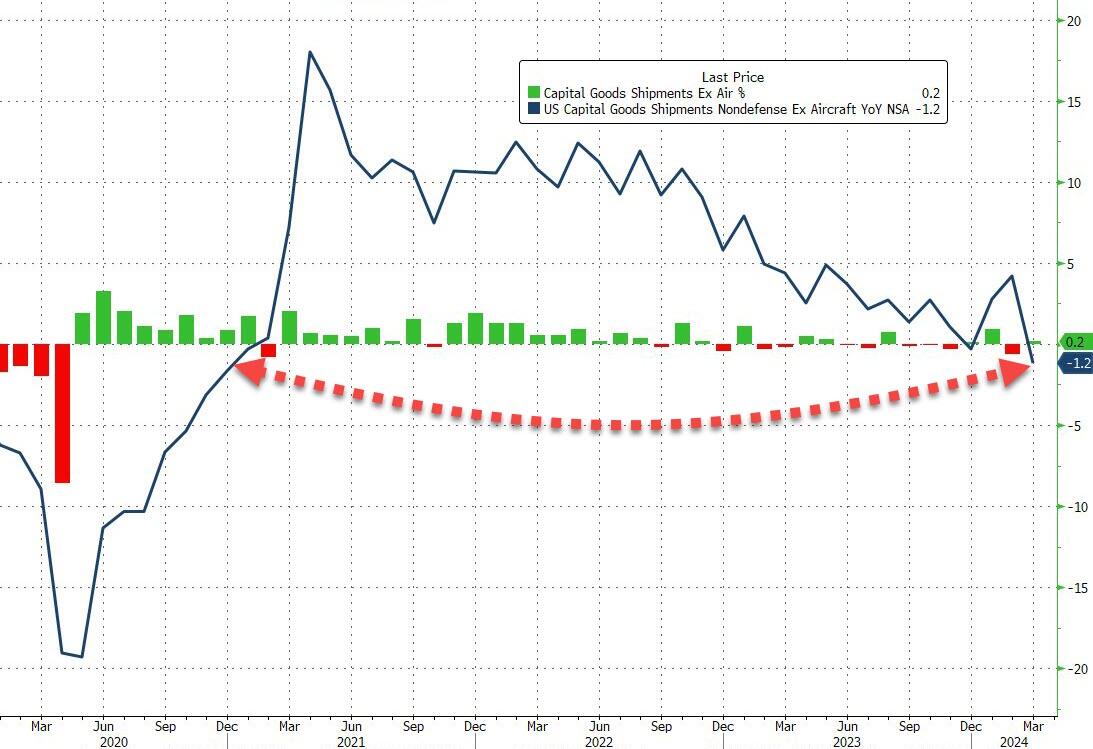
Finally, and more problematically, core capital goods shipments – a figure that is used to help calculate equipment investment in the government’s gross domestic product report – saw only a small 0.2% MoM rise, which left core shipments down 1.2% YoY – the biggest YoY drop since the COVID lockdowns…
Source: Bloomberg
Now that Biden is considering a NATIONAL CLIMATE EMERGENCY granting him 130 War-like powers, I shudder to think for much green spending he will initiate.
Biden: “How many times does Trump have to prove we can’t be trusted?”
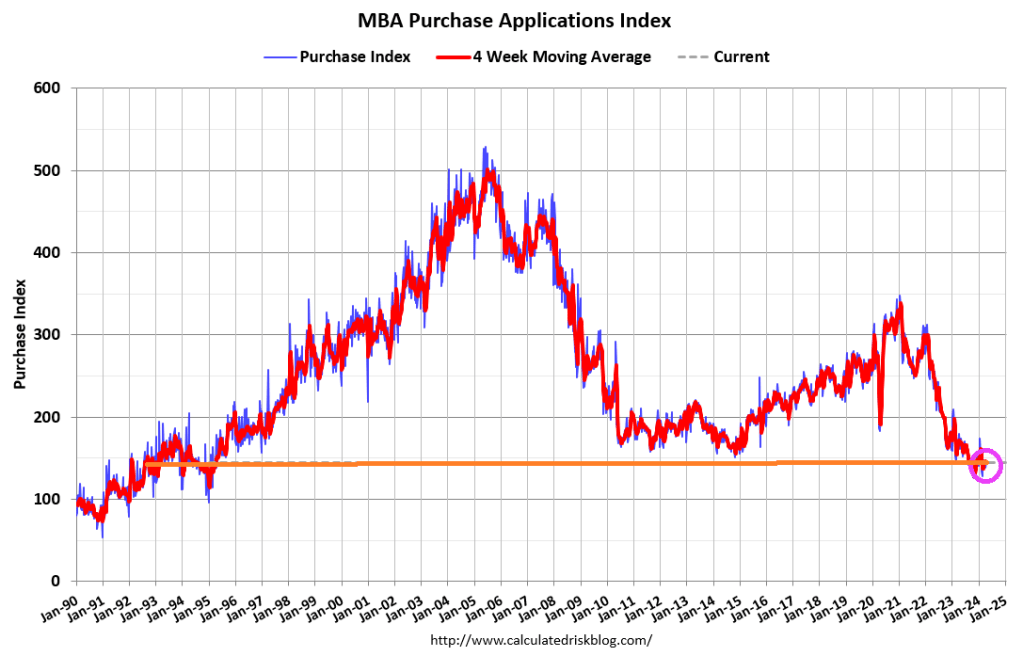
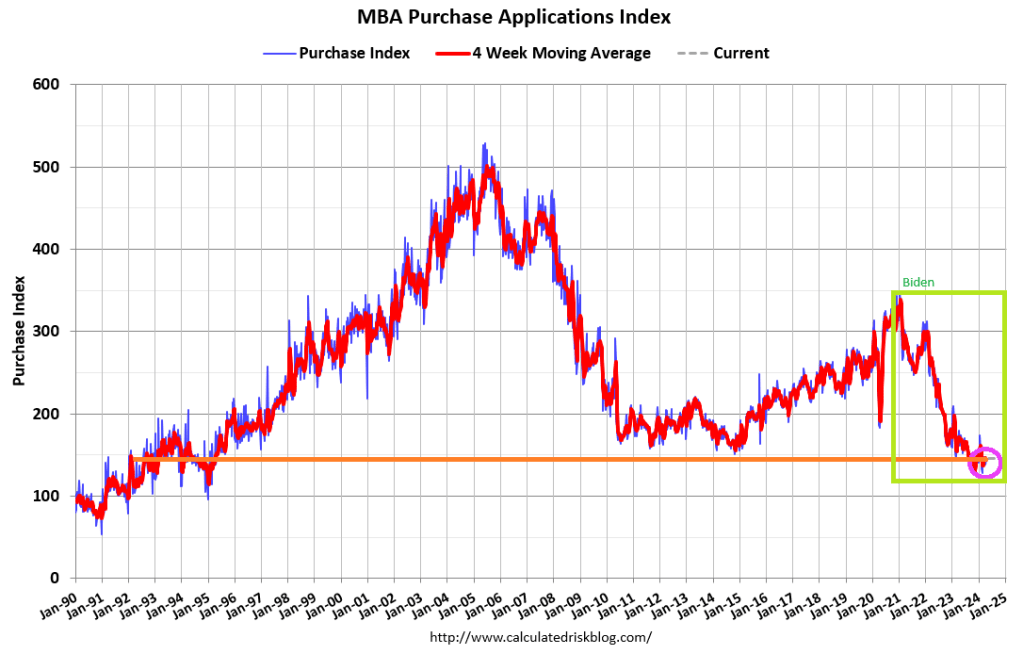
Mortgage applications decreased 2.7 percent from one week earlier, according to data from the Mortgage Bankers Association’s (MBA) Weekly Mortgage Applications Survey for the week ending April 19, 2024.
The Market Composite Index, a measure of mortgage loan application volume, decreased 2.7 percent on a seasonally adjusted basis from one week earlier. On an unadjusted basis, the Index decreased 2 percent compared with the previous week. The seasonally adjusted Purchase Index decreased 1 percent from one week earlier. The unadjusted Purchase Index increased 0.2 percent compared with the previous week and was15 percent lower than the same week one year ago.
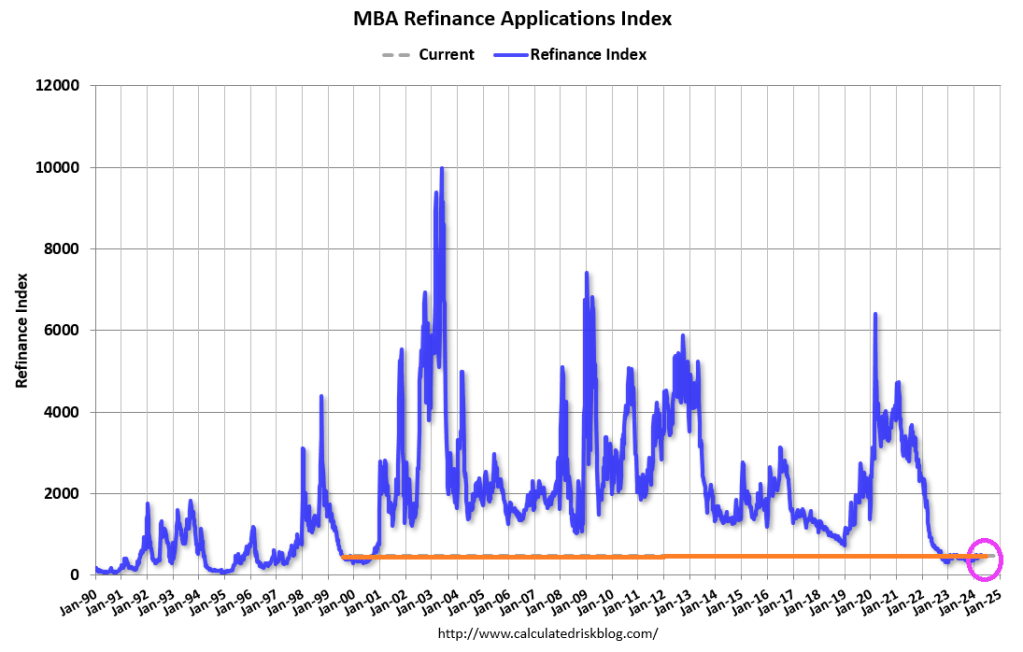
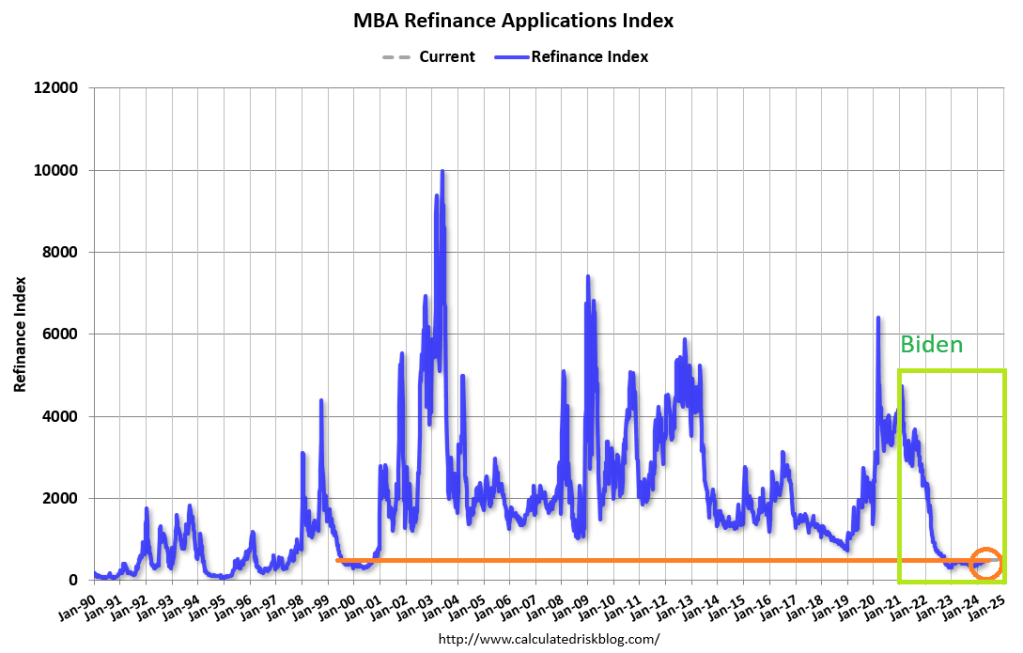
The Refinance Index decreased 6 percent from the previous week and was 3 percent higher than the same week one year ago.
The average contract interest rate for 30-year fixed-rate mortgages with conforming loan balances ($766,550 or less) increased to 7.24 percent from 7.13 percent, with points increasing to 0.66 from 0.65 (including the origination fee) for 80 percent loan-to-value ratio (LTV) loans.
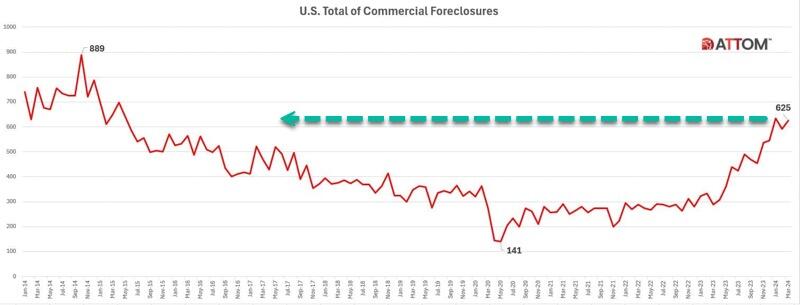
The latest report from real estate data provider ATTOM shows CRE foreclosures topped 625 in March, up 6% from February and 117% from the same period last year.
ATTOM has been tracking commercial foreclosures since 2014. The number of foreclosures is approaching the peak of 889 in October 2014.
“California began experiencing a notable rise in commercial foreclosures in November 2023, surpassing 100 cases and continuing to escalate thereafter,” the report said.
New York, Florida, Texas, and New Jersey also showed increases in CRE foreclosures last month.
Regional banks provide a bulk of the financing for the space. The ongoing mess in the lending space due to tighter conditions adds pressure to the CRE downturn. Banks are expected to set aside more money to cover potential CRE losses.
Last month, Federal Reserve Chair Jerome Powell testified on Capitol Hill, “We have identified the banks that have high commercial real estate concentrations, particularly office and retail and other ones that have been affected a lot,” adding, “This is a problem that we’ll be working on for years more, I’m sure. There will be bank failures, but not the big banks.”
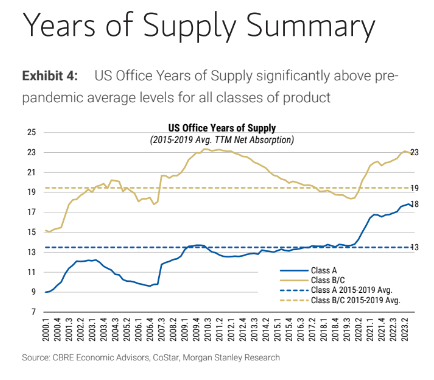
Data from a recent Treasury Department’s Financial Stability Oversight Council (FSOC) warned office vacancy rates have climbed sharply in recent years, reaching a record of 13.1% at the end of 2023.
CoStar analyst Phil Mobley recently noted the “reset in office demand has rocked US markets.”
Morgan Stanley warned earlier this year that office prices could plunge 30% due to sliding demand.
For those wondering why the excess supply of office towers can’t be converted into affordable housing, Goldman also noted that prices must drop 50% for housing conversions to make sense.
Powell has a rolling crisis on his hands. And the goal is to save the fireworks for after the election.
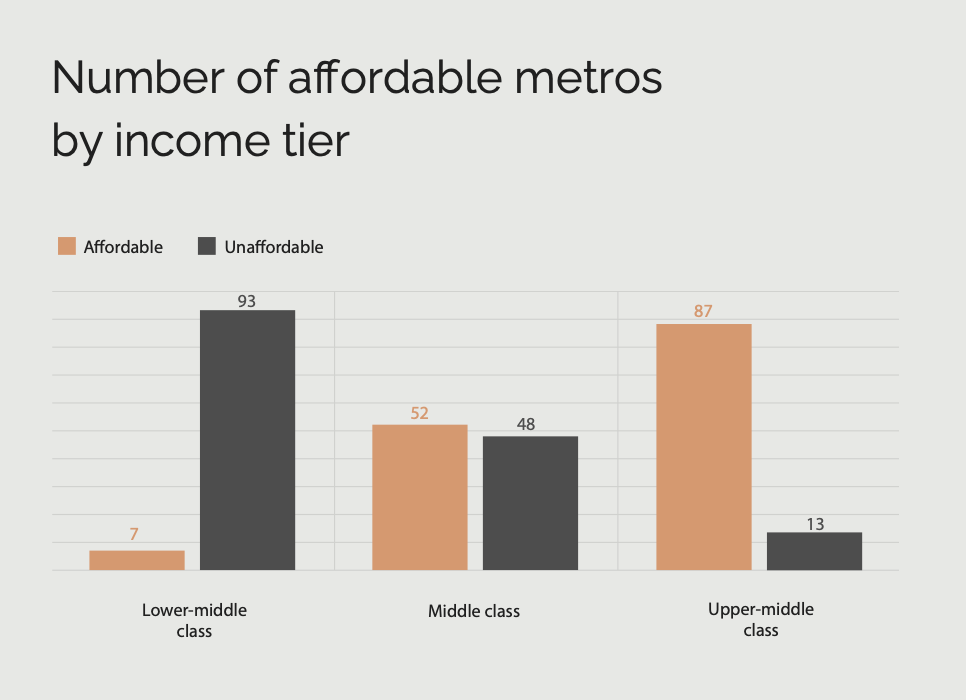
Housing is becoming an exclusively upper-class privilege in a growing number of cities.
According to a new study by Creditnews Research, in 2024, middle-class households could afford to buy an average home in just 52 of the country’s 100 largest metros.
Just five years earlier, they could afford a home in 91 of the top 100 metros.
The situation is far worse for lower middle-class households, as they can only afford a home in seven of the largest 100 metros.
In total, 41 out of the 100 metros require a gross annual income of $100,000 or more to qualify for an average home. In 13 metros, an average income of more than $155,000 is needed.
In those cities, even the upper-middle class doesn’t qualify for an average home.
The study determined affordability by looking at how much income households need to earn to afford a down payment, mortgage payment, and related fees for an average home.
A home is considered affordable if monthly housing and mortgage costs don’t exceed 28% of a household’s gross income.
“There’s no two ways about it: Housing affordability has worsened significantly since Covid,” the report said. Since the pandemic, 39 of the most populous metros have fallen below the affordability threshold.
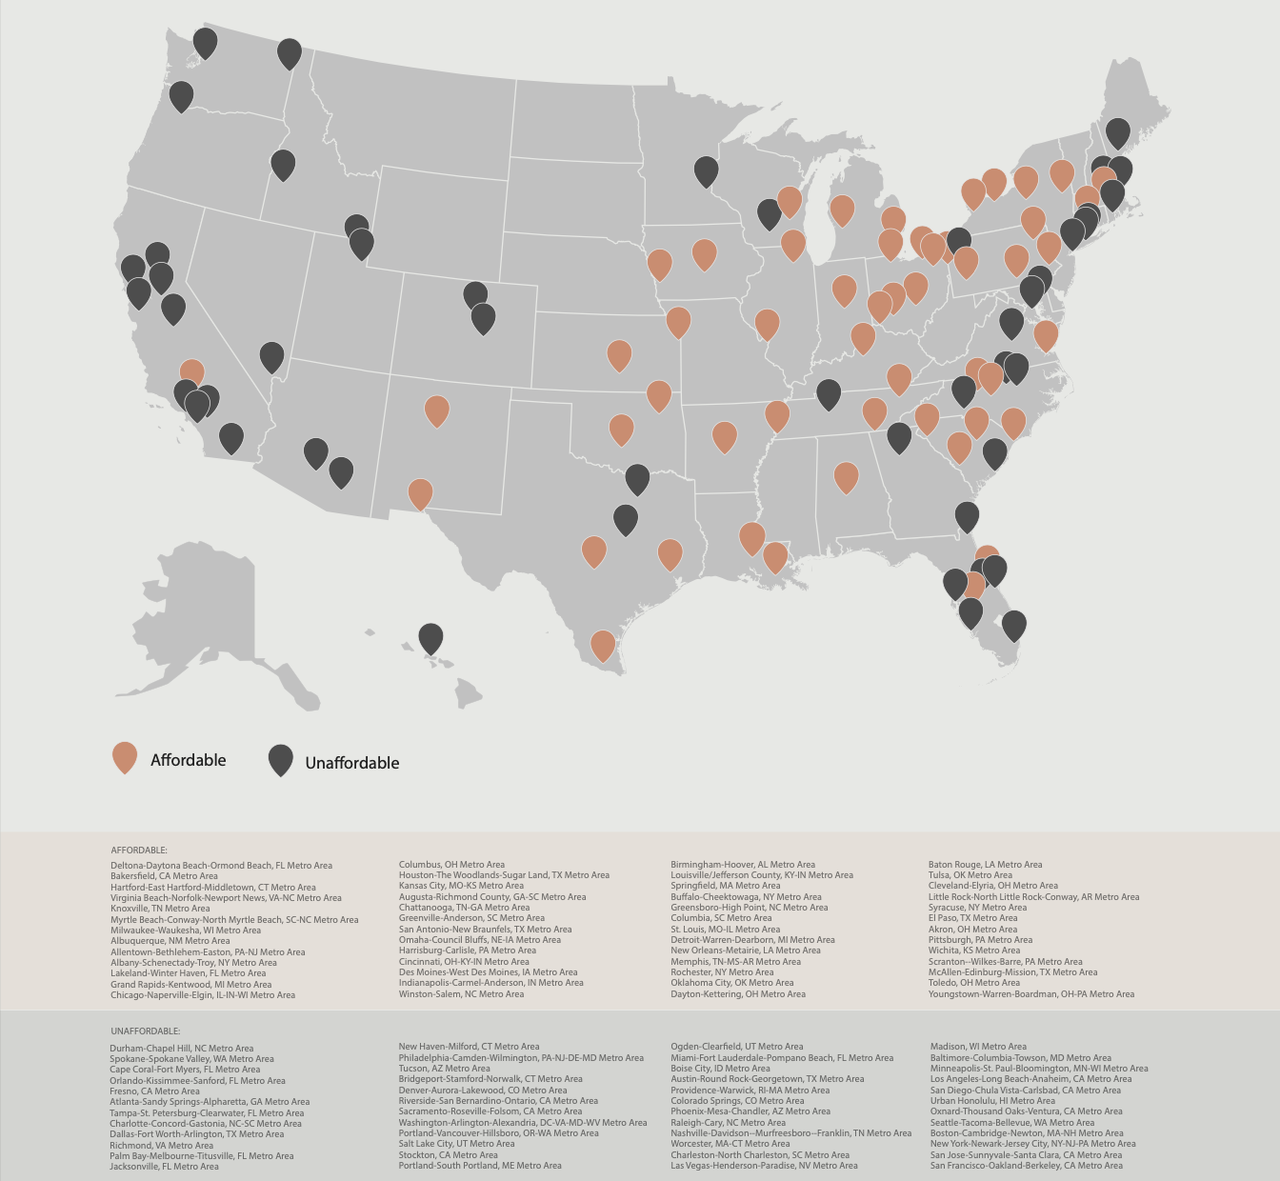
As expected, the most affordable areas for the middle class are located in the Midwest, Rust Belt, and parts of Texas, while the West Coast, Tri-State Area, and Hawaii are largely out of reach.
Affording a home is no longer a guarantee for the middle class
Being considered “middle class” doesn’t carry the same significance as it did just a few years ago.
“In the past, if you were middle class, it was almost assumed you would become a homeowner,” said Ali Wolf, chief economist of Zonda, a housing market research firm.
“Today, the aspiration is still there, but it is a lot more difficult. You have to be wealthy or lucky.”
That’s all thanks to a “perfect storm” of elevated mortgage rates, sky-high home prices, and a lack of inventory, making housing more unaffordable.
The result is that middle-income buyers, or those with an annual income of up to $75,000, could only afford about one-quarter of listings on the market last year.
According to Nadia Evangelou, the director of real estate research at the National Association of Realtors, “Middle-income buyers face the largest shortage of homes among all income groups, making it even harder for them to build wealth through homeownership.”
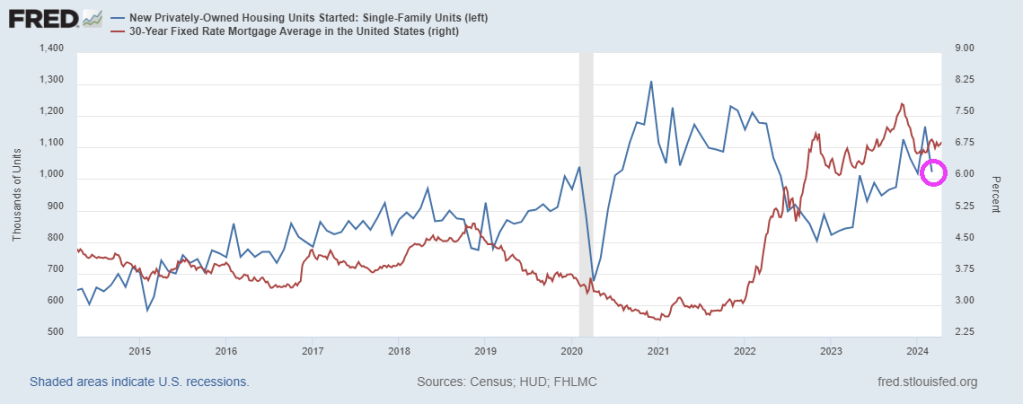
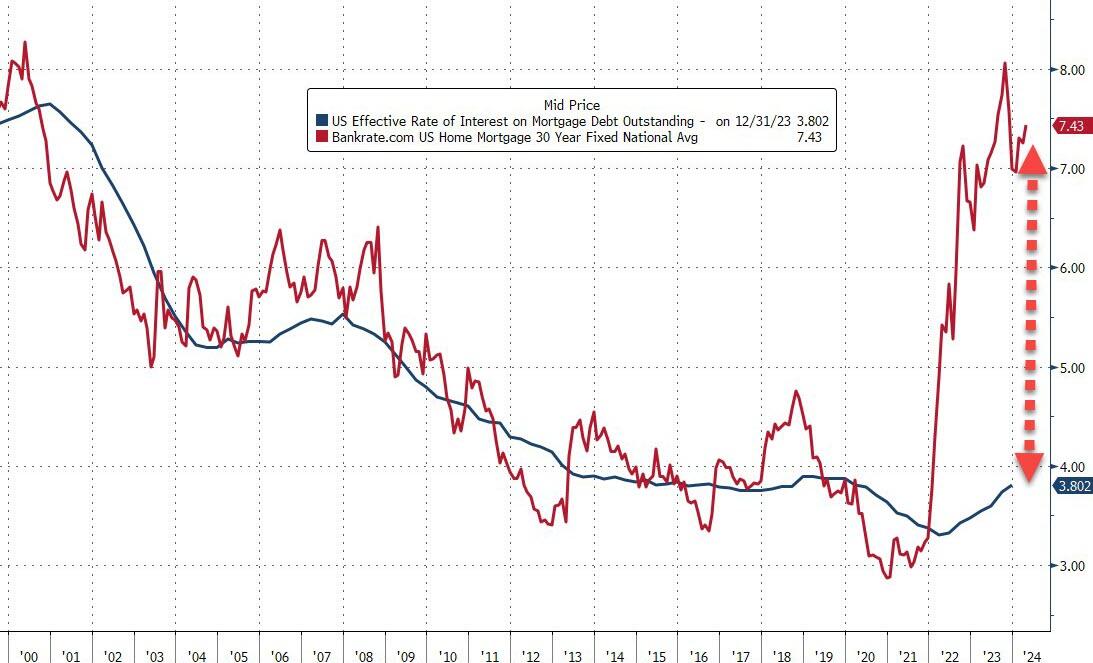
Mortgage rates (blue line) creep closer to 7%. Mortgage rates are UP 168% under Vacation Joe and home prices are up 32.5%.
After falling between November and January, mortgage rates are creeping back up.
According to Freddie Mac, 30-year fixed-rate mortgages reached 6.88% in the week of April 11 and at some point climbed well above 7%.
The reversal seems to be driven by a surprise spike in inflation, which has come out higher than expected for four consecutive months
“For homebuyers, the latest CPI report means mortgage rates will stay higher for longer because it makes the Fed unlikely to cut interest rates in the next few months,” said Chen Zaho, Redfin’s economic research lead.
“Housing costs are likely to continue going up for the near future, but persistently high mortgage rates and rising supply could cool home-price growth by the end of the year, taking some pressure off costs.”
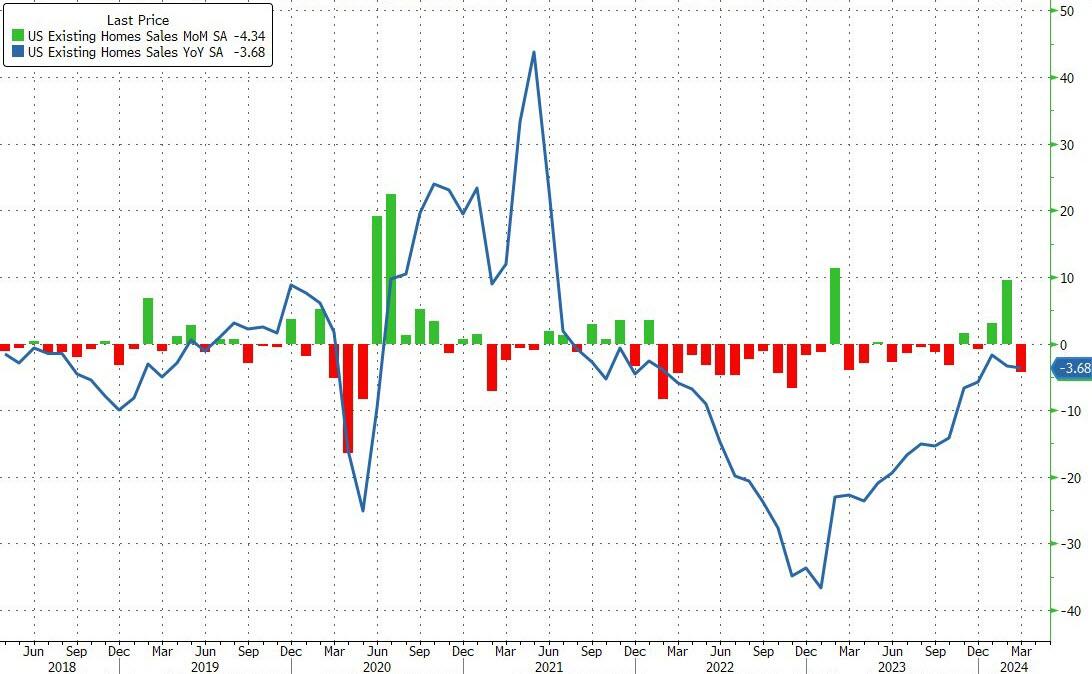
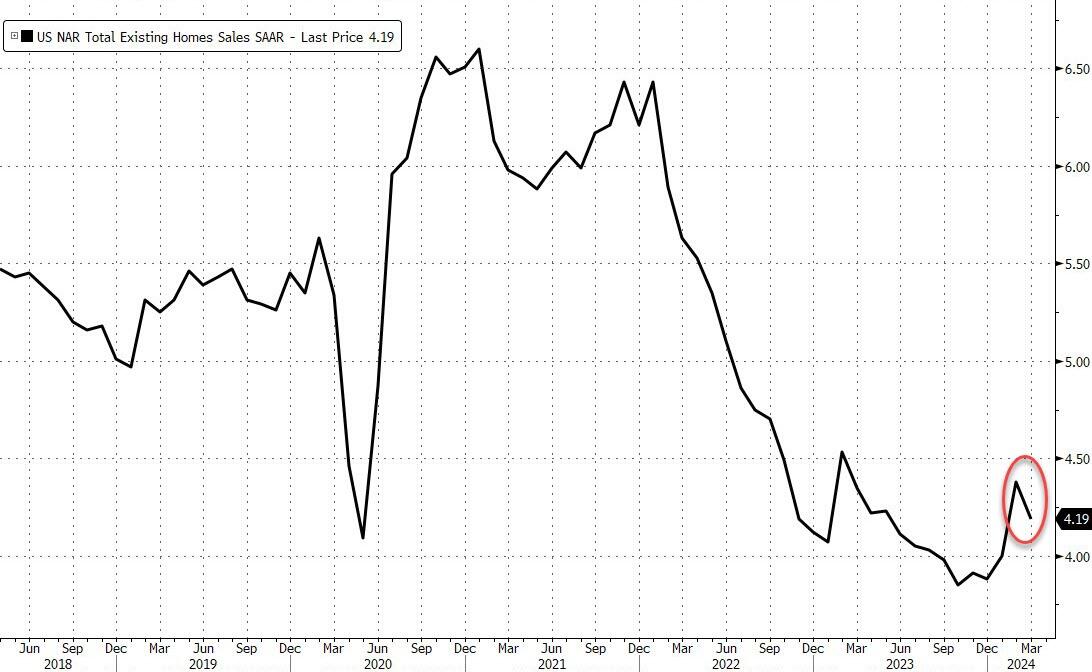
Sales were down almost 10% from a year earlier on an unadjusted basis, as sales of both single-family homes and condominiums and co-ops dropped.
Source: Bloomberg
This dragged total existing home sales SAAR back down to 4.19mm…
Source: Bloomberg
“Though rebounding from cyclical lows, home sales are stuck because interest rates have not made any major moves,” said NAR Chief Economist Lawrence Yun.
“There are nearly six million more jobs now compared to pre-COVID highs, which suggests more aspiring home buyers exist in the market.”
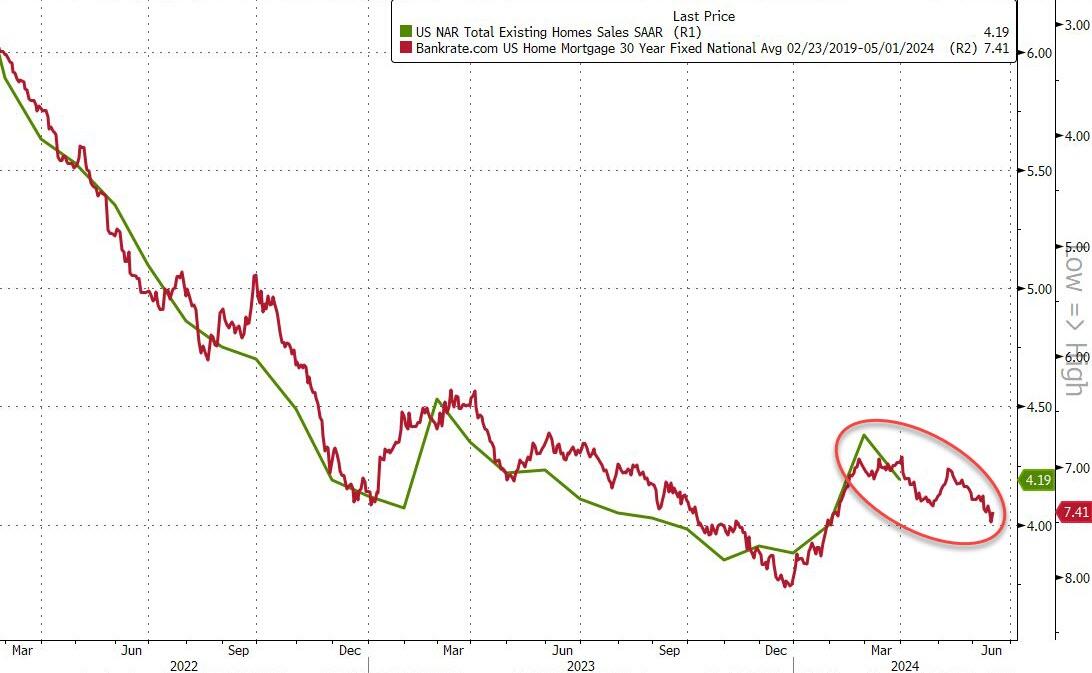
…and it’s about to get worse…
Source: Bloomberg
Total housing inventory registered at the end of March was 1.11 million units, up 4.7% from February and 14.4% from one year ago (970,000). Unsold inventory sits at a 3.2-month supply at the current sales pace, up from 2.9 months in February and 2.7 months in March 2023.
“More inventory is always welcomed in the current environment,” Yun said.
“It’s a great time to list with ongoing multiple offers on mid-priced properties and, overall, home prices continuing to rise.”
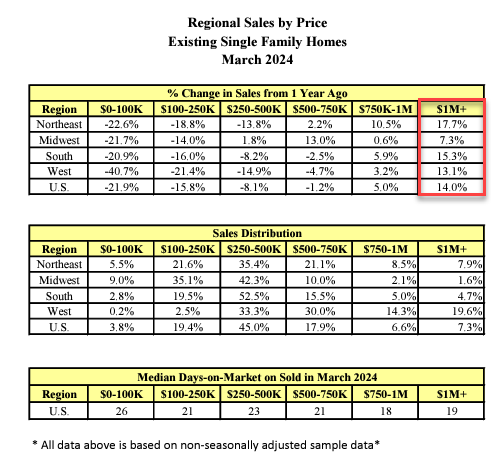
All price levels saw sales decline except $1mm+…
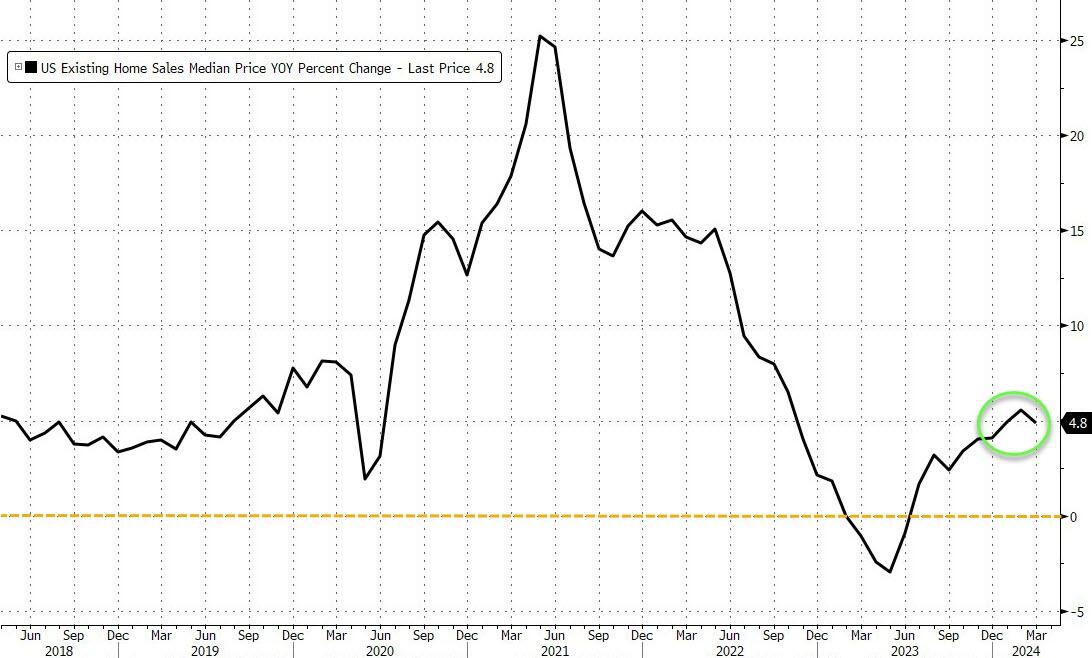
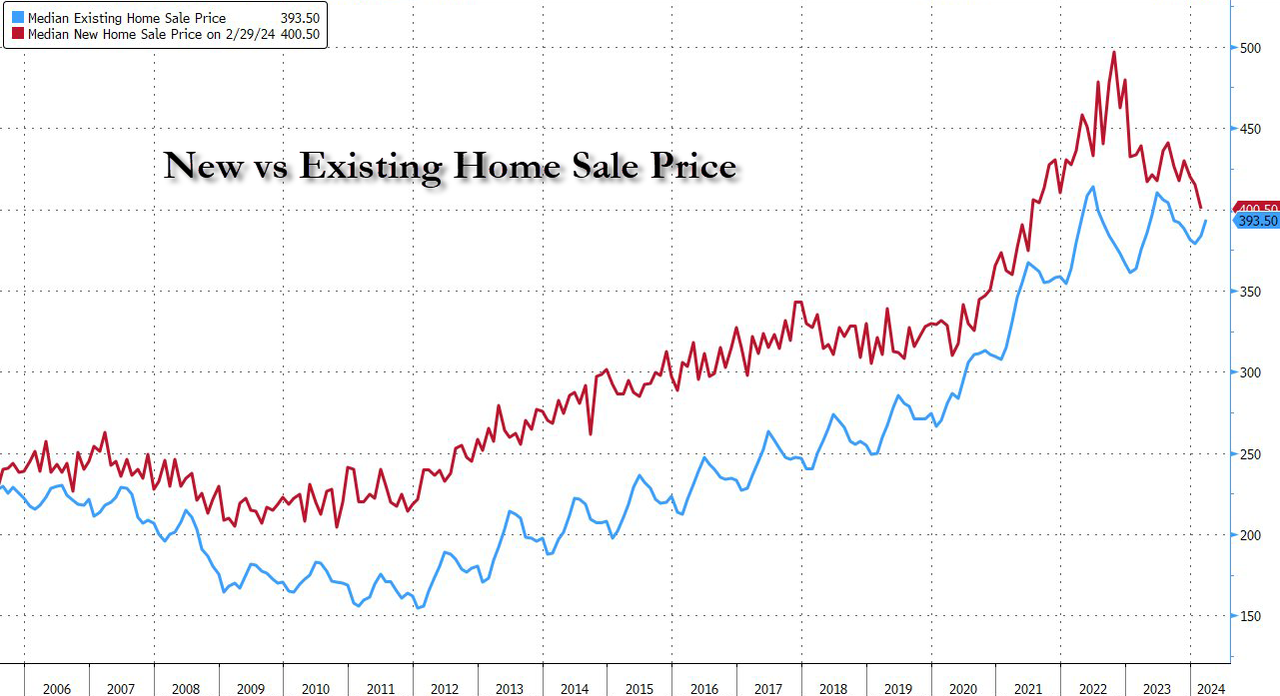
The median selling price increased 4.8% from a year ago to $393,500, the highest for any March on record.
Source: Bloomberg
…and existing home prices are about to top new home prices…
Source: Bloomberg
First-time buyers made up 32% of purchases in March, up from 26% a month earlier.
Somehow, I don’t think Biden will brag about this report.
President Obama selected Slow Joe Biden as his Vice President because 1) he was white and 2) an alleged foreign policy wizard in The Senate. Between Afghanistan, Ukraine, Israel, Taiwan and every other foreign policy disaster under his leadership, I am beginning to doubt Biden’s foreign policy acumen. For example …
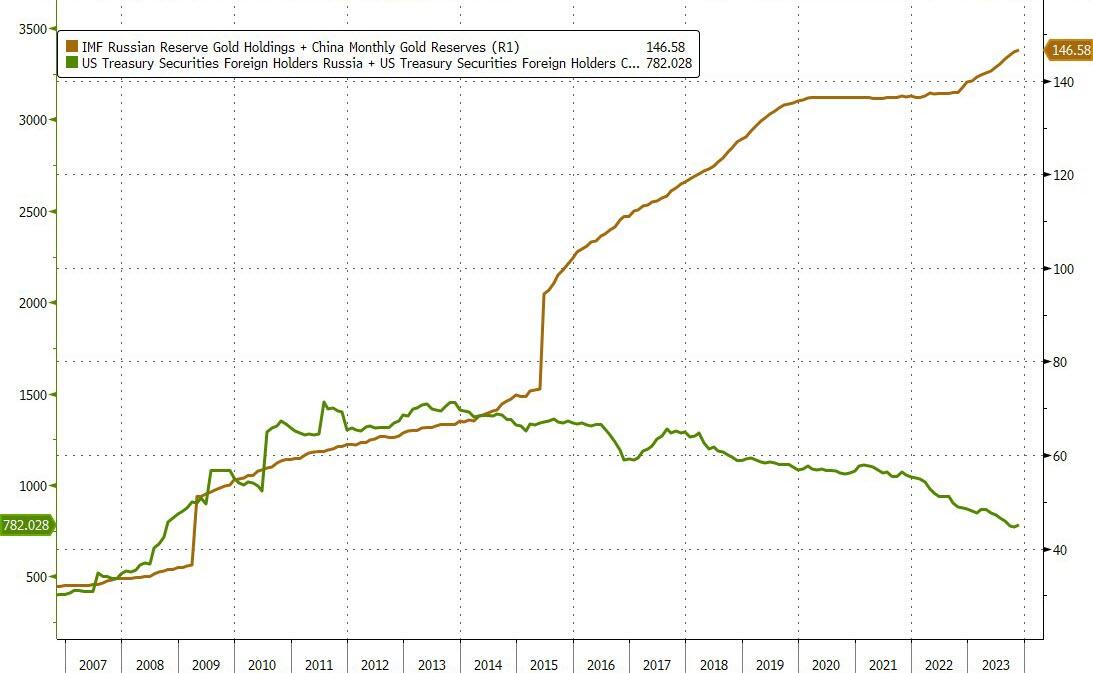
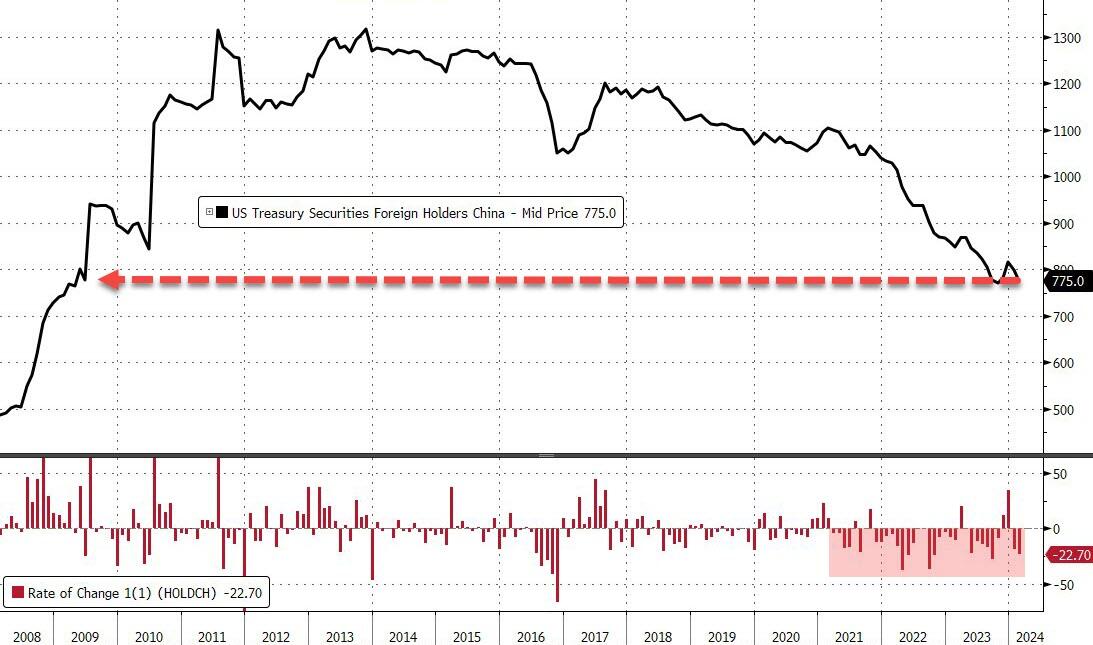
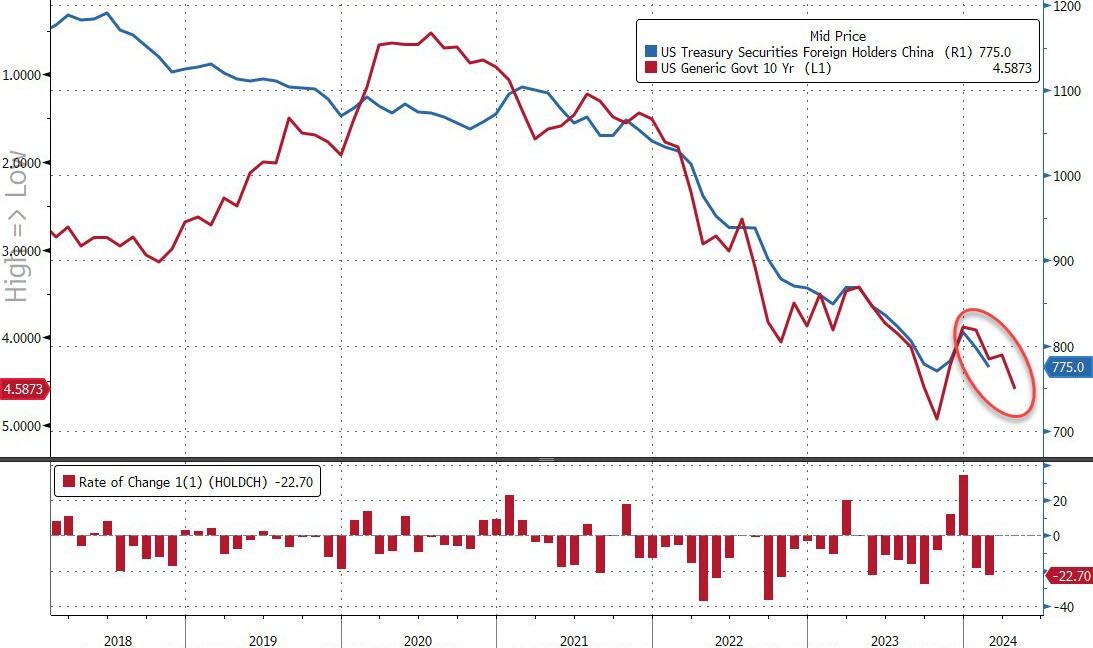
While we are acutely aware of the fact that ‘correlation is not causation’, one would find it hard to argue that the practically perfect concomitance of China’s Treasury holdings and the yield of the US 10Y Treasury note over the past three years makes us wonder (in our out-loud voices), if – away from The QT, The FedSpeak, the macro-economy, the geopolitical crises, the AI-hype, the growth scares – if it’s not just all a well-managed (slow and steady) liquidation of China’s (still massive) US Treasury holdings…
Source: Bloomberg
It’s hard to argue they don’t have an incentive to a) de-dollarize, and b) not liquidate it all at once, shooting themselves in the face.
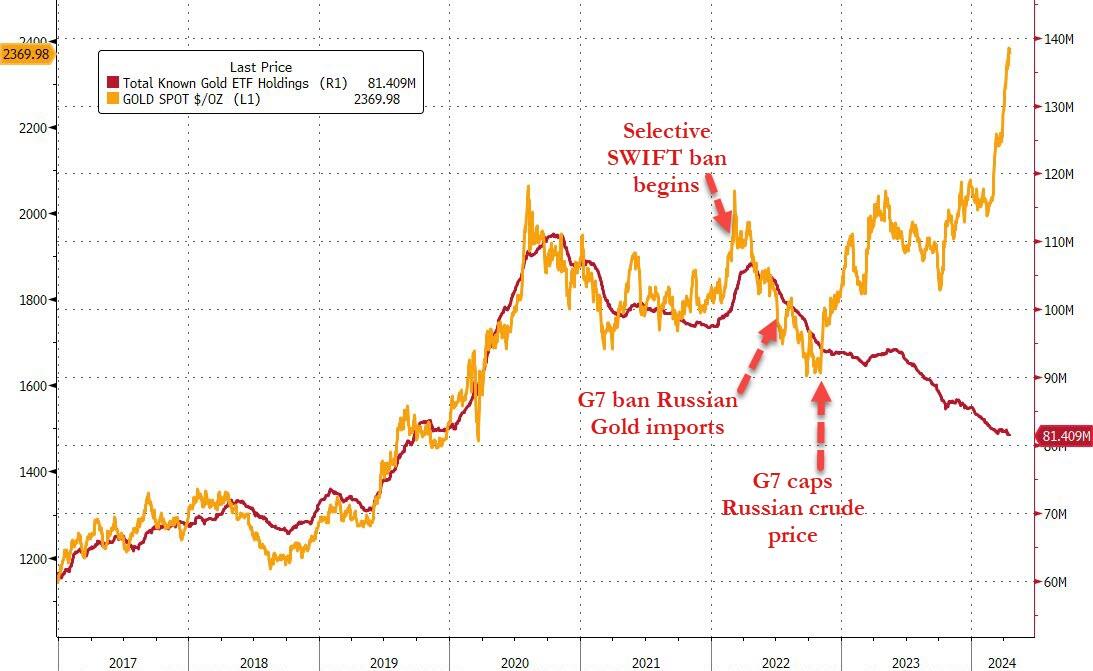
While the de-dollarizing has been steady in Treasury-land (enabled by a vast sea of liquid other players), things have been a little more ‘obvious’ in the alternative currency space – i.e gold.
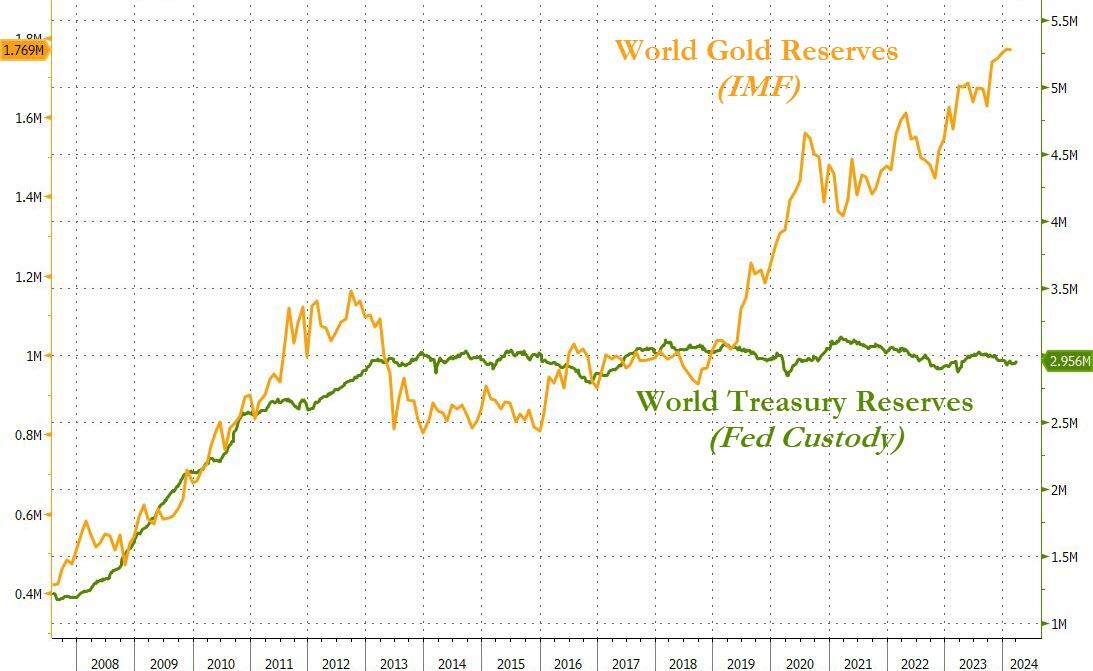
And in case you wondered, it’s not just China and Russia, world reserve Treasury holdings are ‘relatively’ flat (based on Fed’s custody data) while according to The IMF, the world’s sovereign nations have been buying gold with both hands and feet…
Source: Bloomberg
…happy to take whatever retail-ETF-sellers are offering into their physical vaults…
Source: Bloomberg
Finally, as we note in the chart, this all started to ‘escalate quickly’ when Washington really started to weaponize the dollar.
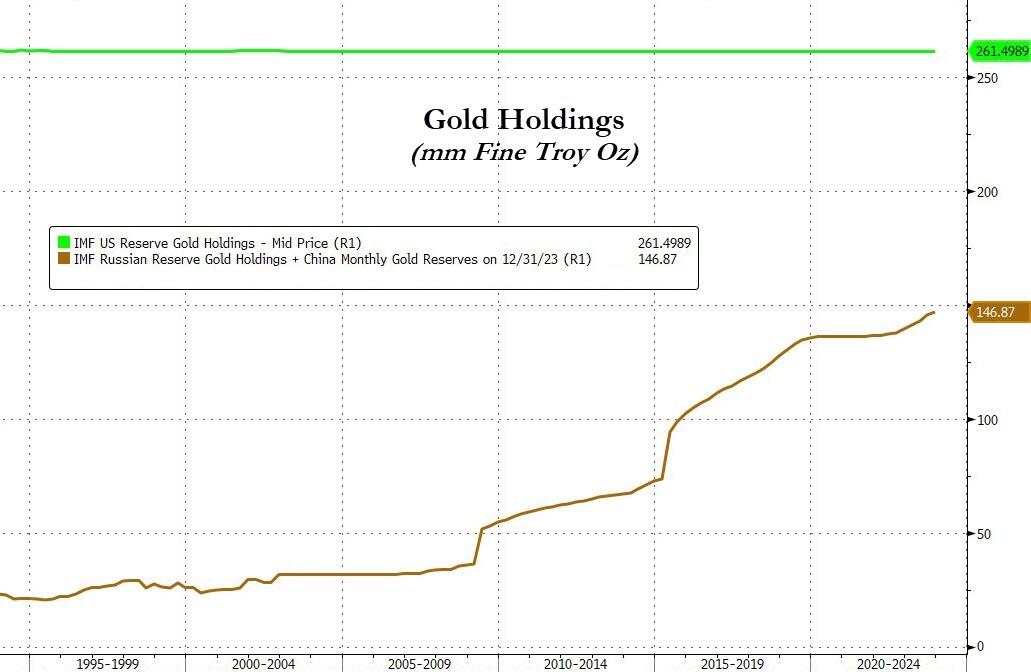
Assuming that all the US gold is still in Fort Knox (and assuming that China and Russia are honest about their holdings), the world’s ‘other superpowers’ are rapidly catching up to the US’ holdings…
Source: Bloomberg
Who could have seen that coming? With mortgage rates hitting 7.5%, the home price to median household income ratio just hit an all-time high.
The 10Y Treasury yield just hit 4.519%.
And we have The Federal Reserve posting record losses.
Did we REALLY elect this fool Biden as President??
Mortgage applications increased 3.3 percent from one week earlier, according to data from the Mortgage Bankers Association’s (MBA) Weekly Mortgage Applications Survey for the week ending April 12, 2024.
The Market Composite Index, a measure of mortgage loan application volume, increased 3.3 percent on a seasonally adjusted basis from one week earlier. On an unadjusted basis, the Index increased 4 percent compared with the previous week. The seasonally adjusted Purchase Index increased 5 percent from one week earlier. The unadjusted Purchase Index increased 6 percent compared with the previous week and was 10 percent lower than the same week one year ago.
The Refinance Index increased 0.5 percent from the previous week and was 11 percent higher than the same week one year ago.
Bidenomics, a massive subsidy to the political donor class, but heartless towards the middle class.
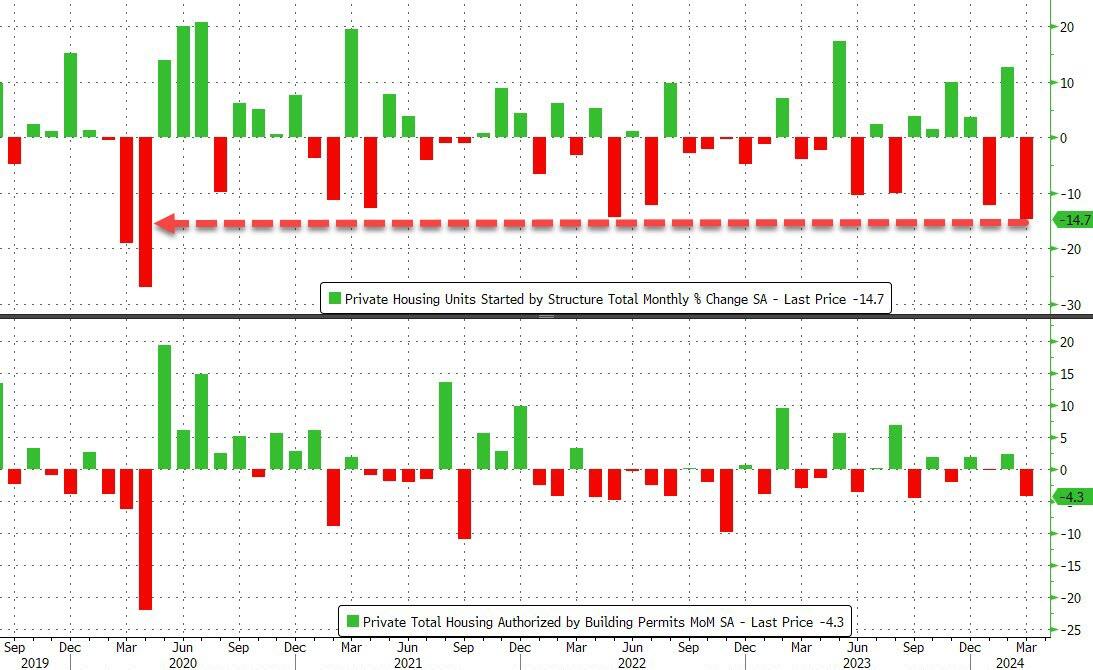
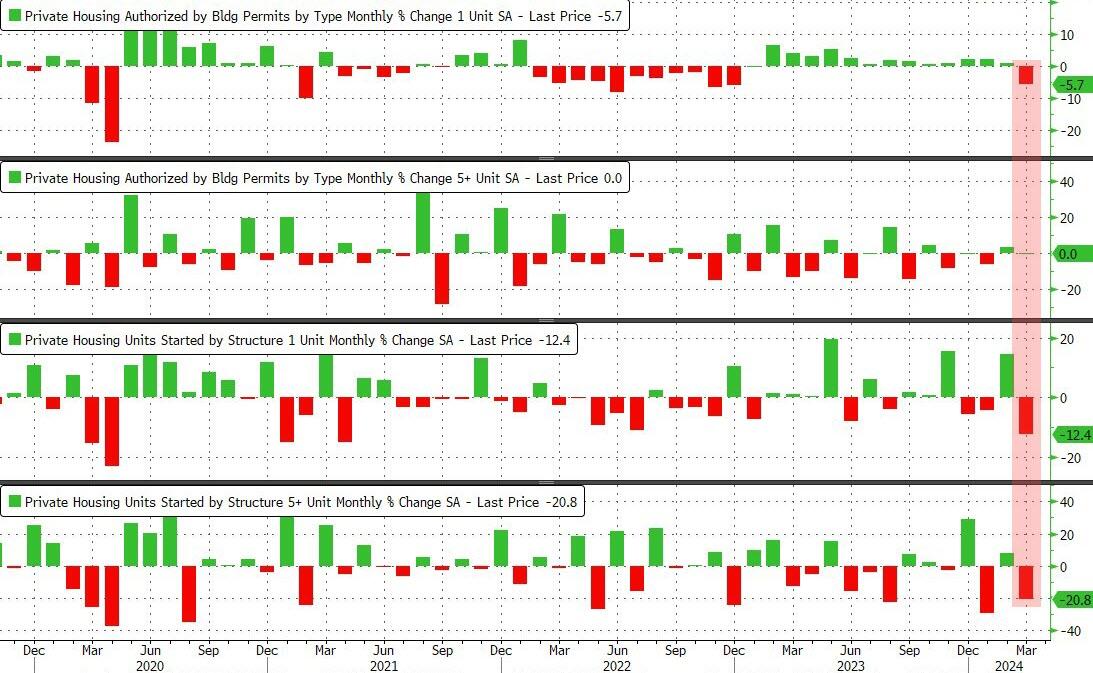
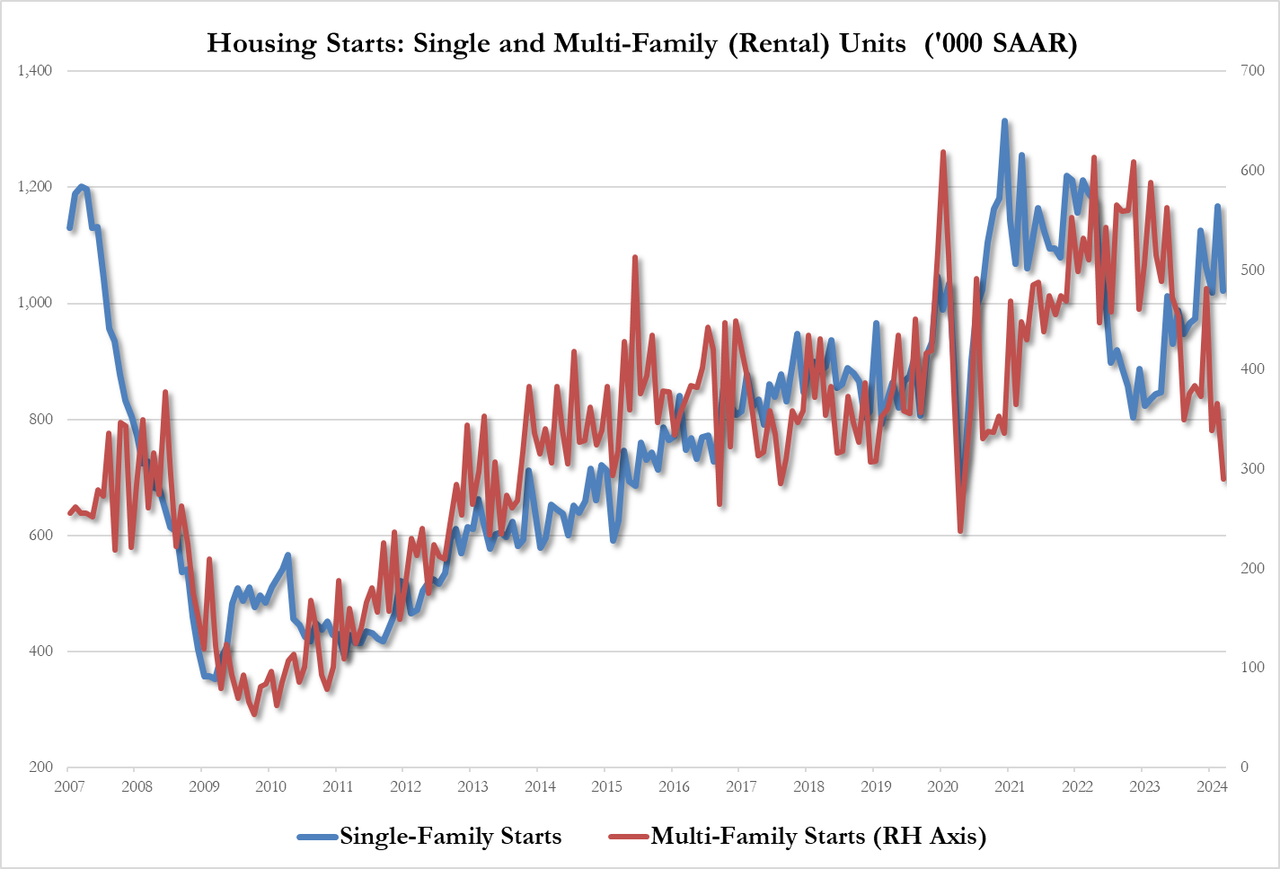
Come feel the noise! After steady growth in 1-unit housing starts under Trump, housing starts have been eratic under Biden despite the foreign invasion force of millions … of low wage workers.
For context, this is the largest MoM drop in housing starts since the COVID lockdowns…
Source: Bloomberg
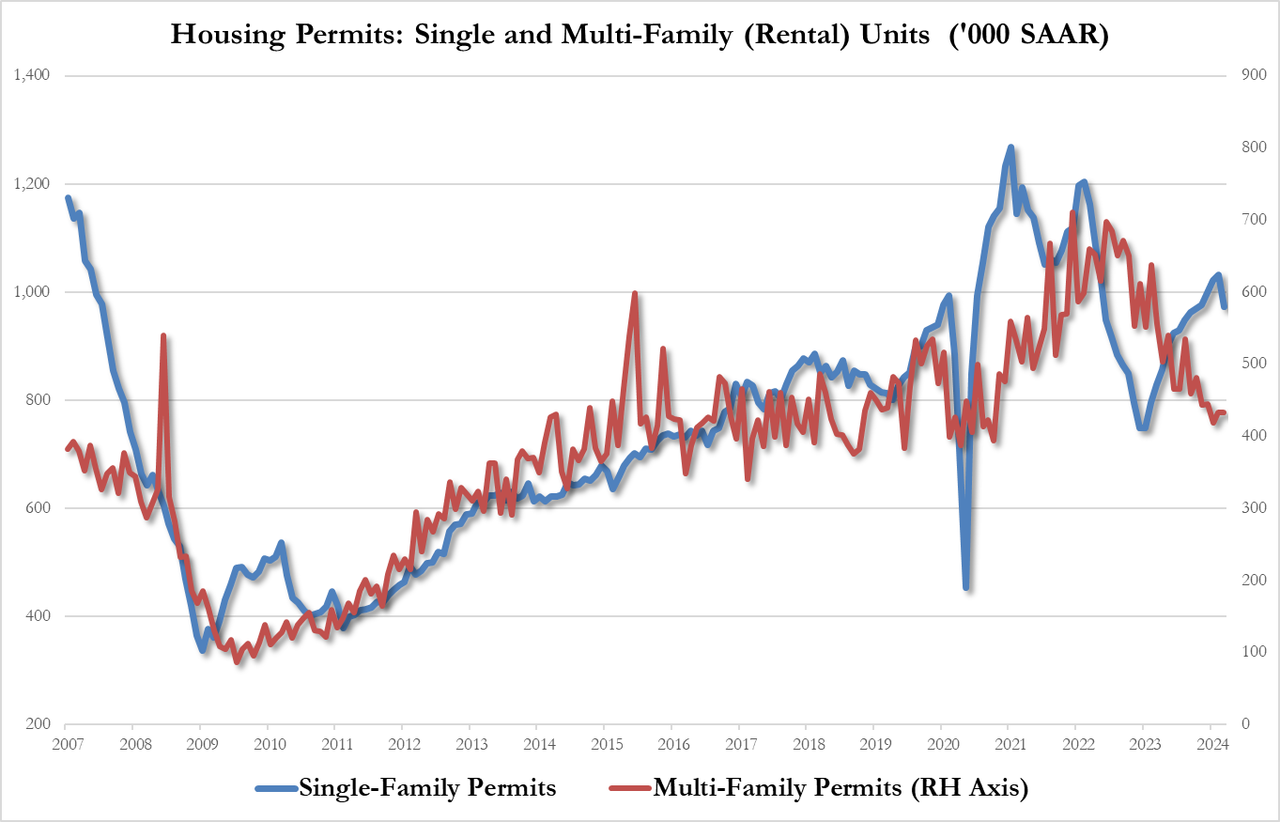
It was a bloodbath across the board with Rental Unit Starts plummeting 20.8% MoM…
Source: Bloomberg
That pushed total multi-family starts SAAR down to its lowest since COVID lockdowns…
The plunge in permits was less dramatic and driven completely by single-family permits down 5.7% to 973K SAAR, from 1.032MM, this is the lowest since October. Multi-family permits flat at 433K
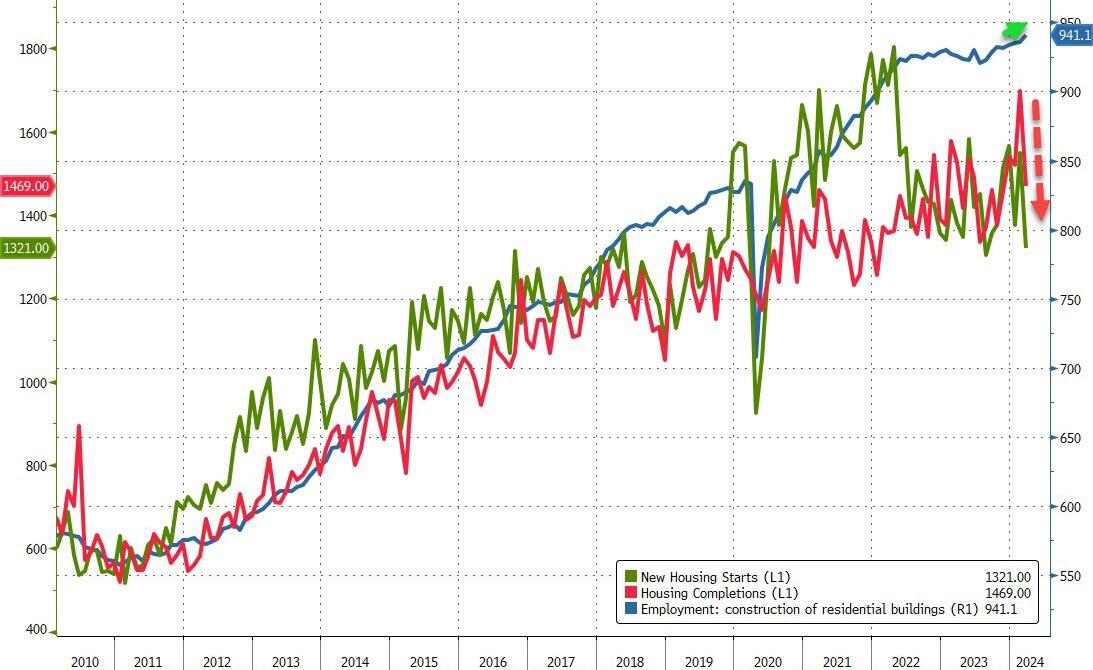
Intriguingly, while starts and completions plunged in March, the BLS believes that construction jobs surged to a new record high…
Source: Bloomberg
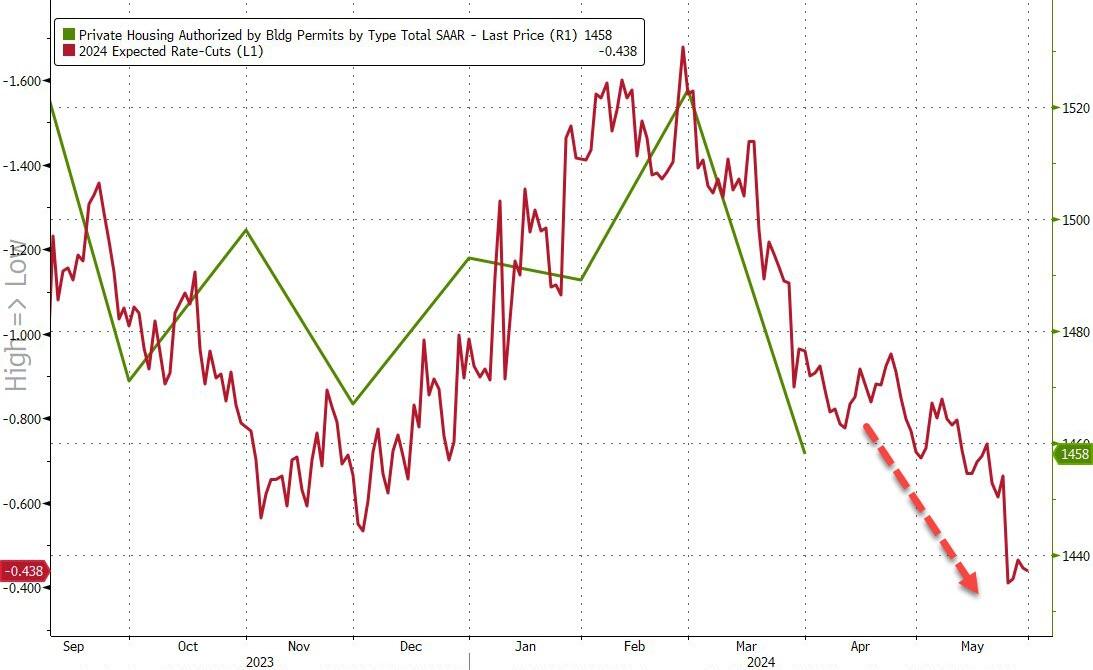
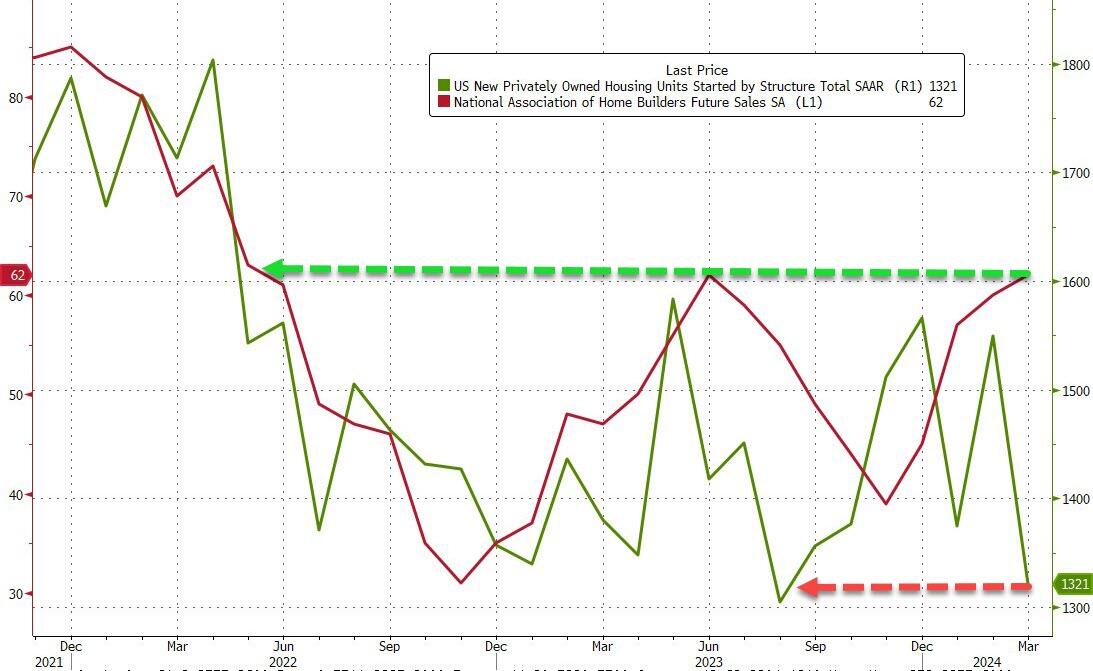
Finally, just what will homebuilders do now that expectations for 2024 rate-cuts have collapsed?
Source: Bloomberg
One thing is for sure – do not trust what homebuilders ‘say’ (as NAHB confidence jumped to its highest since May 2022 at the same time as housing starts crashed)…
Joe Biden likes to sell himself as “working class Joe” or “union Joe.” The truth is anything but. He is “Washington DC insider Joe” or “big corporate Joe.”
The US mortgage 30 year rate is down slightly today to 7.30%. That is a whopping 160% increase since Biden’s Presidency began.
Mortgage rates will continue to climb as the US Treasury 10-year yield climbs.
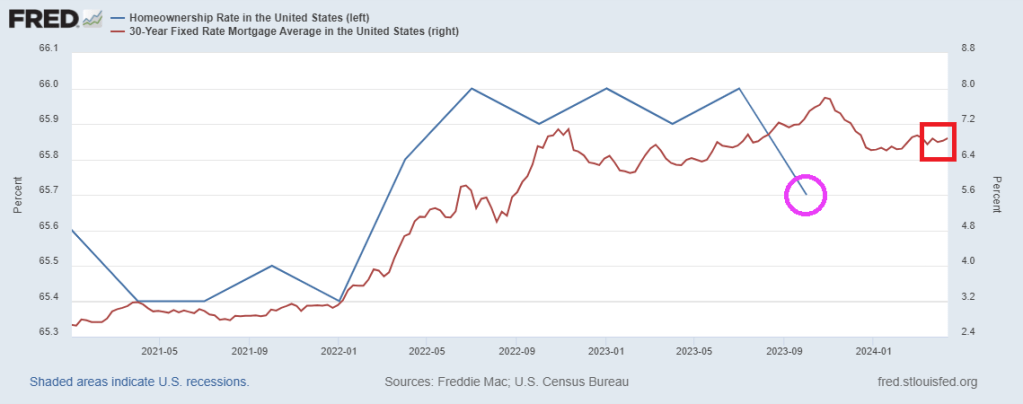
The US homeownership rate is falling as mortgage rates climb.
US CPI on trend for 4-5% at US election in November.
Source: BofA
Above 5%…?
Strong CPI raises market probability of YE25 rates above 5%.
Source: Goldman
Cyclical inflation remains too elevated
“Our measure of cyclical inflation–which should capture the impact of excess demand on prices–appears to be stuck at around 5%, which is too elevated”
Source: Safra
US alone
The US is the only economy in the G10 where the latest inflation print surprised to the upside.
Source: Goldman
200% of GDP
Under current policies, government debt outstanding will grow from 100% to 200% of GDP.
Source: Apollo
Close to $9 trillion in maturities
That’s a significant amount of government debt maturing within the next year.
Source: Apollo
Every year a deficit
OMB forecasts 5% budget deficit every year for the next 10 years.
Source: Apollo
A billion per day….is long gone
US government interest payments per day have doubled from $1bn per day before the pandemic to almost $2bn per day in 2023.
Source: Apollo
Biggest Story of 2020s…Ugly End of 40-year Bond Bull
Chart shows long-term US government bond (15+ year) rolling 10-year annualized returns, %.
Source: Flow Show
Highest yields in 15 years
The intermediate part of the yield curve still offers the highest yields in over fifteen years.
Source: Piper Sandler
Finally, electricity costs keeps rising, ESPECIALLY with the misnamed Inflation Reduction Act (IRA). The real name of the IRA should have been the Large Green Donor Increase Act (LGDIA).


You must be logged in to post a comment.