Jerome Powell and The Federal Reserve have to make a decision about tightening monetary policy or loosening it. It’s a Presidential election year and The Fed will probably do what is necessary to support The Biden Administration’s re-election. But let’s look at the various conflicting economic indicators that are causing confusion at The Fed.
First, the Federal Reserve’s preferred gauge of inflation wasn’t hotter than expected in February, which could keep a mid year interest rate cut on the table.
The year-over-year change in the so-called “core” Personal Consumption Expenditures index — which excludes volatile food and energy prices — clocked in at 2.8% for the month of February.
That was in line with economist expectations and down from 2.9% in January. Core prices rose 0.3% from January to February, which was also in line with expectations and down from 0.5% in the previous month.
The new PCE reading could be an encouraging development to some Fed officials who raised questions in recent months about the persistence of inflation after some hotter-than-expected numbers at the start of 2024.
“Core services inflation is slowing and will likely continue throughout the year,” Jeffrey Roach, chief economist for LPL Financial, said in a note.
“By the time the Fed meets in June, the data should be convincing enough for them to commence its rate normalization process. But where we sit today, markets need to have the same patience the Fed is exhibiting.”
Some Fed officials have been cautioning investors to be patient about the pace of rate cuts.
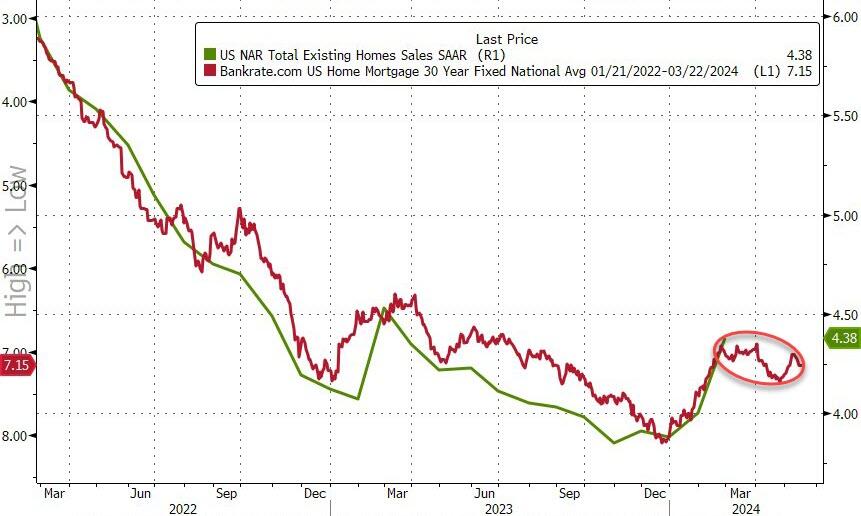
Fourth, on the housing front, the 30-year mortgage rate is up 156% under Biden’s Reign of Error. Rate cuts would be helpful for reducing mortgage rates.
Fifth, commercial real estate. The NBER states that approximately 44% of office loans may have negative equity. They estimate that a 10% to 20% default rate on commercial real estate (CRE) loans, similar to levels seen during the Great Recession, could result in additional bank losses of $80 to $160 billion. They emphasize the impact of interest rates, noting that none of these loans would default if rates returned to early 2022 levels. With around $1 trillion in maturing CRE loans this year, higher interest rates could lead to challenges in refinancing, especially for office spaces facing high vacancy rates and declining valuations.
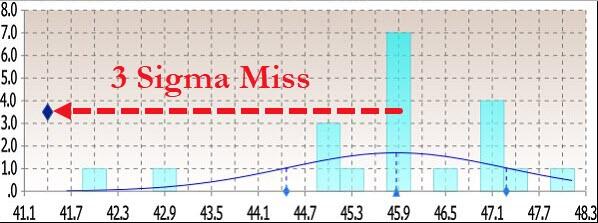
Finally, we have Citi’s economic surprise index (blue line) which is positive at 30.70 despite The Fed already having raised their target to the highest level since 2000 before the Iraq War/9-11 recession.
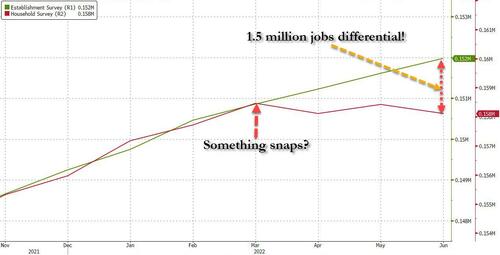
Something has snapped in the labor market: that’s when a staggering discrepancy emerged between the number of Payrolls (as measured by the BLS’ Establishment Survey, a far more crude and imprecise, yet much more market-moving data series), and the number of actual Employed Workers (as measured by the BLS’ far more accurate Household Survey). As we showed at the time, after the two series had tracked each other tick for tick, a gap opened in March 2022 which quickly grew to 1.5 million jobs in just 3 months…
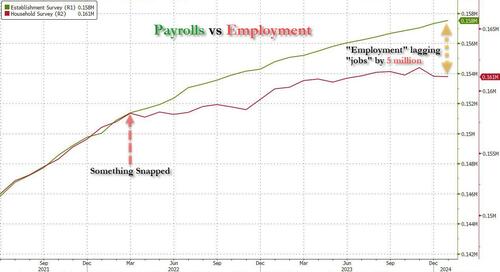
… and has since exploded to a whopping gap of 5 million “jobs” that apparently do not exist.
And while some of this discrepancy could be explained with the record surge in multiple jobholders, which increased by 1 million since March 2022 to an all time high of 8.6 million at the end of 2023 (as a reminder, the Establishment Survey counts 1 worker have 2 or 3 (or more) multiple jobs as, well, 2 or 3 (or more) separate jobs, even if it is just one worker trying to make ends meet under the roaring inflation of Bidenomics), most of the gap remained unexplained.
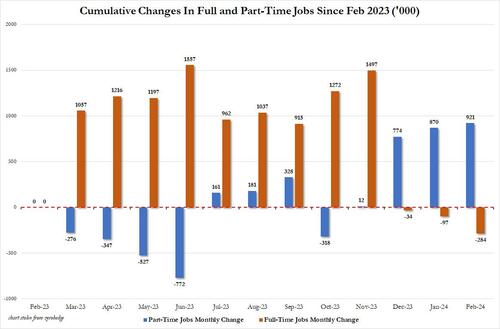
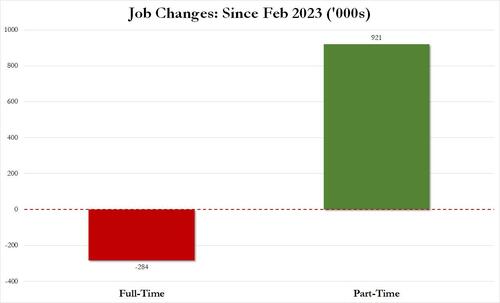
There was more: it was around the summer of 2022 that the Biden labor department – in its zeal to show job growth no matter the cost, or quality of jobs – also started fooling around with the composition of the labor market, with most of the monthly gains going to part-time workers, even as full-time workers stagnated or declined. The culmination, as we reported earlier this month, is that in February 2024, the US had 132.9 million full-time jobs and 27.9 million part-time jobs. Which is great… until you look back one year and find that in February 2023 the US had 133.2 million full-time jobs, or more than it does one year later! And yes, all the job growth since then has been in part-time jobs, which have increased by 921K since February 2023 (from 27.020 million to 27.941 million).
In other words, starting in 2022 and accelerating to present days, less and less full-time jobs were added, until we got to the absurd situation that all the new jobs in the past year have been part-time jobs!
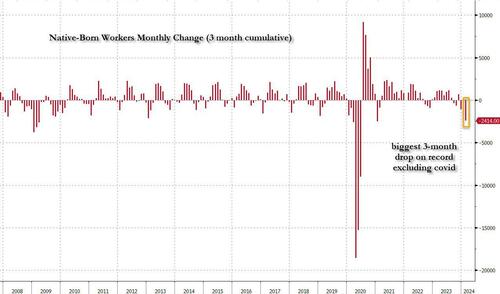
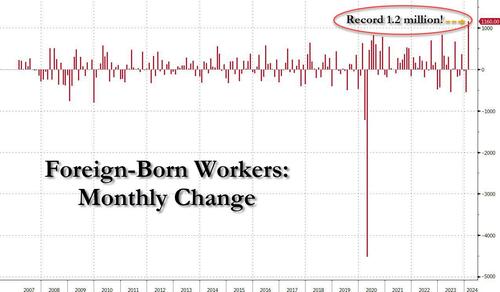
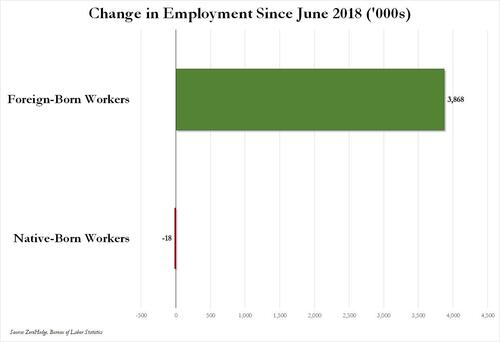
And then there was, of course, the great jobs replacement theory, only as we first showed well over a year ago, it wasn’t a theory but practice, and following countless months in which native-born workers lost their jobs, including a near-record 3-month plunge to start 2024…
… offset by a record 1.2 million foreign-born (read immigrants, both legal and illegal but mostly illegal) workers added in February…
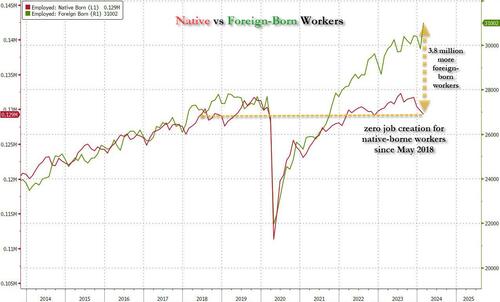
Or, as we first pointed out several months ago, not only has all job creation in the past 6 years – since May 2018 – has been exclusively for foreign-born workers…
… but there has been zero job-creation for native born workers since June 2018!
Ok fine, but all of the above are really just example of the Biden admin Labor Department playing around with statistics and trying (and succeeding) to fool the greatest number of people. There is really nothing about outright data rigging and fabrication… and also while we realize that the Household survey shows a far uglier labor market – one where part-time jobs, illegal immigrants, and multiple jobholders dominate – what about the Establishment survey, which is behind the actual payrolls number, the only number that matters as far as the market is concerned?
All good points, and to address them, we first have to go back to December 2022, when it reported something shocking: as part of its data analysis of the “more comprehensive, accurate job estimates released by the BLS as part of its Quarterly Census of Employment and Wages (QCEW) program“, the Philadelphia Fed found that the BLS had overstated jobs to the tune of 1.1 million! This is what the Philadelphia Fed wrote in its quarterly Early Benchmark Revision of State Payroll Employment report at the time:
Our estimates incorporate more comprehensive, accurate job estimates released by the BLS as part of its Quarterly Census of Employment and Wages (QCEW) program to augment the sample data from the BLS’s CES that are issued monthly on a timely basis. All percentage change calculations are expressed as annualized rates. Read more about our methodology. Learn more about interpreting our early benchmark estimates.
So what did this “more accurate”, “more comprehensive” report find? It found that…
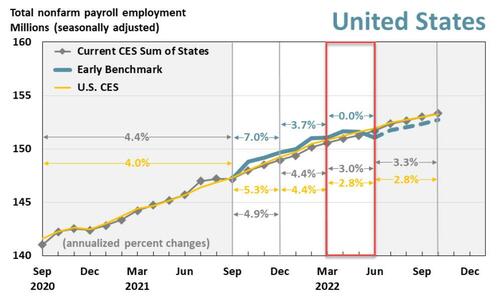
In the aggregate, 10,500 net new jobs were added during the period rather than the 1,121,500 jobs estimated by the sum of the states; the U.S. CES estimated net growth of 1,047,000 jobs for the period.
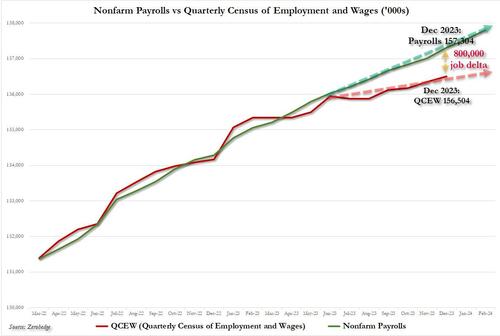
This is shown graphically in the chart below: specifically, the analysis looks at the quarter in the red box, where the green line, or the more accurate “early benchmark” revision of official data, dipped decidedly below the CES trendline (i.e., the nonfarm payrolls).
Alas, since the far more accurate Quarterly Census of Employment and Wages (QCEW) numbers would not be actually incorporated into BLS benchmarks for well over a year after we wrote our analysis in Dec 2022, neither we nor the market would know just how manipulated the data was until early 2024. Which, of course, is now, and as we already know, the BLS had been consistently downward revising virtually all initial job prints in 2023 (ten of the eleven jobs reports heading into Dec 2023 were revised lower) to make the economy more realistic but only in retrospect…
… however, even though we do know now that the jobs data in 2022 was far weaker than anyone thought at the time, nobody really cares: after all there are part-time jobs and illegal immigrants to plug any and all historical holes, plus we are talking about ancient history.
Plus, we have all those great recent jobs reports to fall back on: the ones that confirm that Bidenomics is doing such a great job.
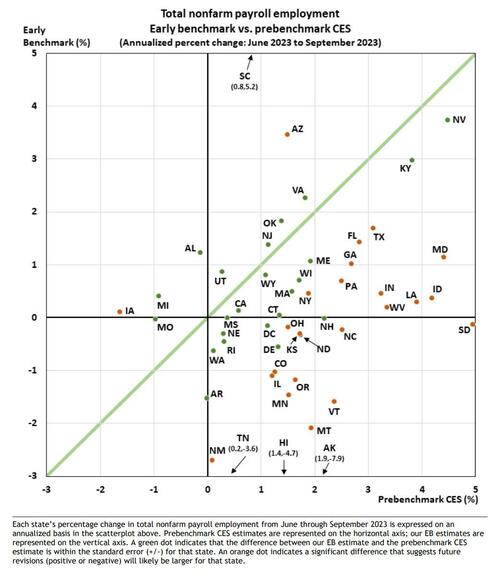
Only… that’s not true either.Presenting Exhibit A: the latest Philadelphia Fed quarterly report on Early Benchmark Revisions of State Payroll Employment. It shows that once again, the BLS has been fabricating jobs, and not just any jobs but those that make up the all-important (if highly inaccurate) payrolls reported by the Biden Bureau of Goalseeked Statistics.
The primary purpose of this analysis, in the Philly Fed’s own words, is “to produce timely estimates of state payroll jobs that closely predict the annual benchmark revisions released by the BLS each March. To do so, we incorporate more comprehensive job estimates released by the BLS as part of its Quarterly Census of Employment and Wages (QCEW) program.” This is more or less a replica of the analysis which the Philly Fed performed back in December, when it found that 1.1 million jobs were unexpectedly “missing.”
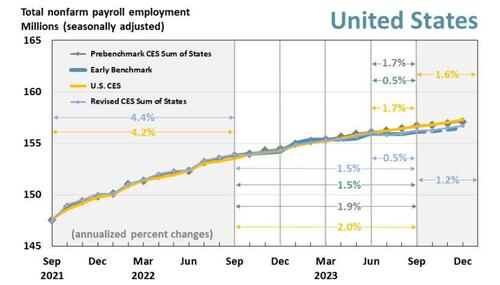
So what happened this time? Well, the analysis, which looked at state-level data, “found that “the employment changes from June through September 2023 were significantly different in 27 states compared with prebenchmark state estimates from the Bureau of Labor Statistics’ (BLS) Current Employment Statistics (CES).” Specifically, “early benchmark (EB) estimates indicated lower changes in 24 states, higher changes in three states, and lesser changes in the remaining 23 states and the District of Columbia.“
Some more details from the report:
Over the full year ending with this 2023 Q3 vintage — which includes additional QCEW data changes affecting the prior three quarters — payroll jobs in the 50 states and the District of Columbia grew 1.5 percent.
Based on the pre-benchmark CES sum of states and the U.S. CES, payroll jobs grew 1.9 percent and 2.0 percent, respectively.
The revised CES sum-of-states growth rate is 1.5 percent.
For 2023 Q3, payroll jobs in the 50 states and the District of Columbia rose 0.5 percent, after adjusting for QCEW data.
Based on both the prebenchmark CES sum of states and the U.S. CES, payroll jobs grew 1.7 percent.
The revised CES sum-of-states growth rate is 0.5 percent
We’ll go back to the chart above in a second, but first we wanted to show this scatter of state-level employment comparing the St Louis Fed’s more accurate early benchmarking process vs the BLS’ Prebenchmarking CES process: it found that most states’ labor data would be revised lower, in many substantially so.
Ok… but what does all of that mean in English?
Well, to make some more sense of the data, we went through the Early Benchmark state-level data excel spreadsheet provided by the Philly Fed (link), and simply added across the various states to obtain aggregate, country-level data so that we could compare the far more accurate QCEW data with what the BLS had been peddling for the past year.
The result was – again – shocking, and as shown in the chart below, a little over a year after we, or rather the Philly Fed, found that the BLS had overstated payrolls in 2022 by 1.1 million, here we go again, only this time the BLS had overstated payrolls by 800,000 through Dec 2023 (and more if one were to extend the data series into 2024). It’s truly statistically remarkable how every time the data error is in favor of a stronger, if fake, economy.
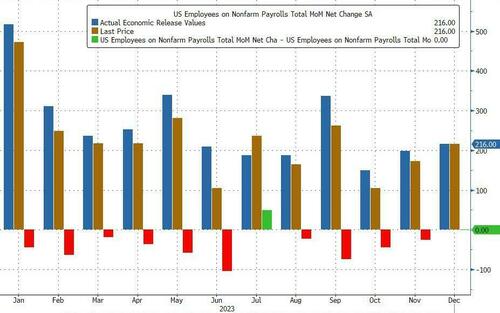
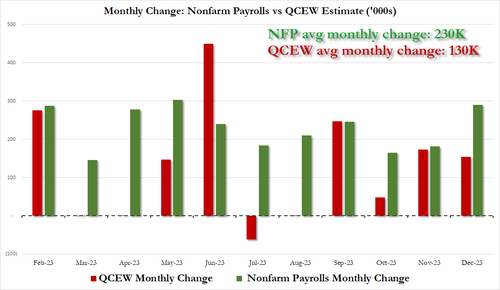
it also means that far from the stellar 230K average monthly increase in payrolls in 2023, which the White House would spin time and again as direct evidence of the benefits of Bidenomics, the true average monthly payroll increase in 2023 was only 130K! The full monthly change in payrolls as originally reported by the BLS (in green) and the actual monthly number, as per the QCEW (in red) is shown below.
Putting it all together, we now know – as the Philly Fed reported first – that the labor market is far weaker than conventionally believed. In fact, no less than 800,000 payrolls are “missing” when one uses the far more accurate Quarterly Census of Employment and Wages data rather than the BLS’ woefully inaccurate and politically mandated payrolls “data”, and if one looks back the the monthly gains across most of 2023, one gets not 230K jobs added on average every month but rather 130K.
Of course, none of that paints Bidenomics in a flattering picture, because while one can at least pretend that issuing $1 trillion in debt every 100 days to add 3 million jos per year is somewhat acceptable, learning that that ridiculous amount buys 800,000 jobs less is hardly the endorsement that the White House needs.
Which is also why nobody in the mainstream media – which is now nothing more than the PR smokescreen for the Biden puppetmasters, the government and the deep state – will ever mention this report.
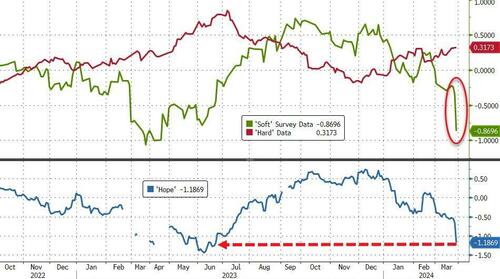
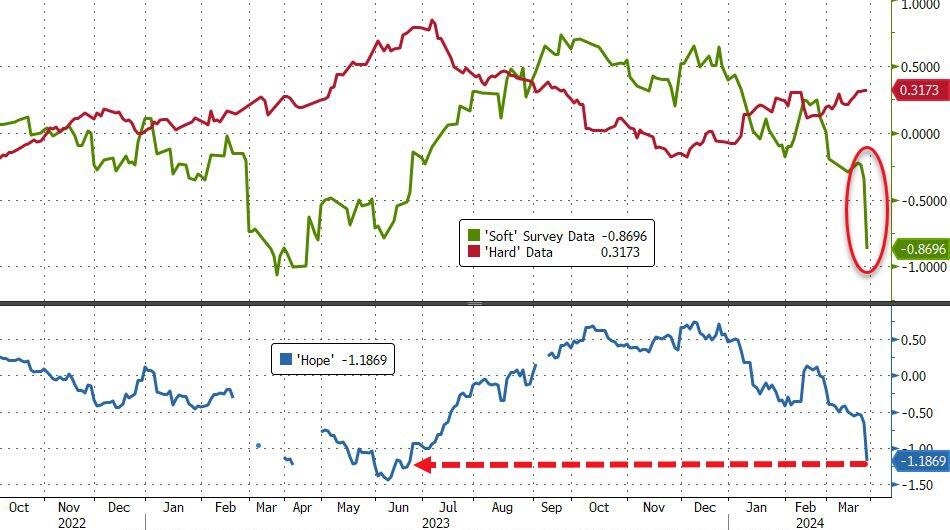
That smashed ‘hope’ – the spread between hard and soft data – back to cycle lows…
Source: Bloomberg
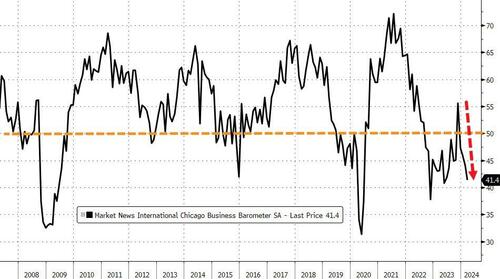
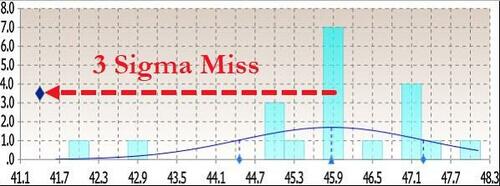
Today’s Chicago PMI plunged to 41.4 – its lowest since May 2023 – from 44.0 (and well below the expected bounce to 46.0)…
Source: Bloomberg
That was below all analysts expectations for the second month in a row…
Source: Bloomberg
Under the hood was even more problematic:
New orders fell at a faster pace; signaling contraction
Employment fell at a slower pace; signaling contraction
Inventories fell at a faster pace; signaling contraction
Supplier deliveries fell and a faster pace; signaling contraction
Production fell at a faster pace; signaling contraction
Order backlogs fell at a slower pace; signaling contraction
Worse still, Prices paid rose again!
So, in summary: slower growth, declining production, shrinking orders, falling employment… and accelerating inflation – is it any wonder that ‘soft survey’ data is collapsing – not exactly election-winning headlines.
Biden asking Zelenskyy for a loan so he can fix the bridge….
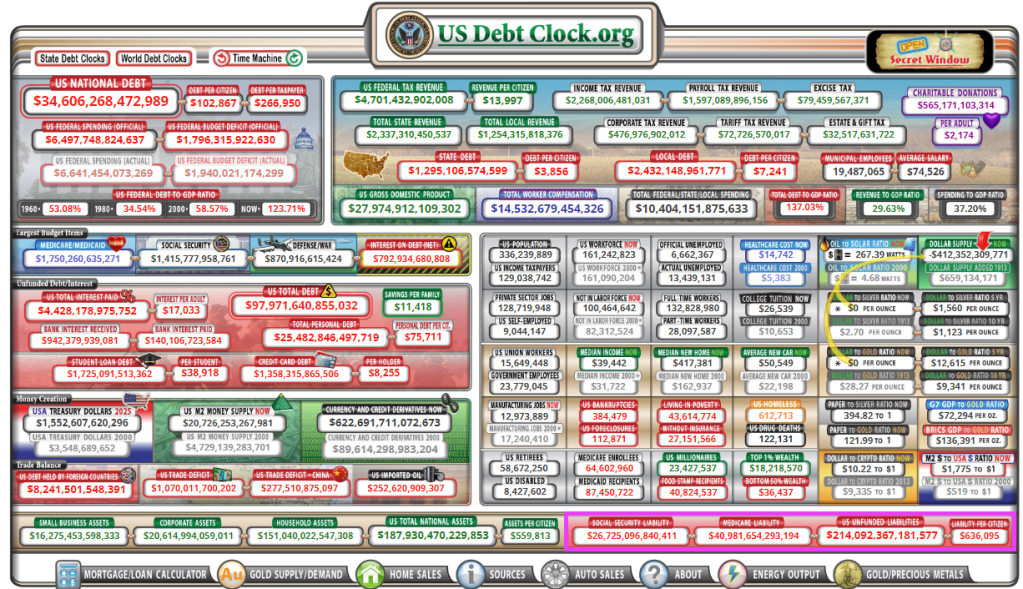
Part of the Bidenomics “plan” is not only green-energy spending, but plenty of freebies to gather voters from the masses. Like the $214 TRILLION in unfunded liabilities promised to the masses in the form of entitlements like Social Security, Medicare and Medicaid (why did they demand that all US citizens be forced to buy healthcare insurance, then give free healthcare to illegal immigrants??). In any case, each citizen is on the hook for $636,000!
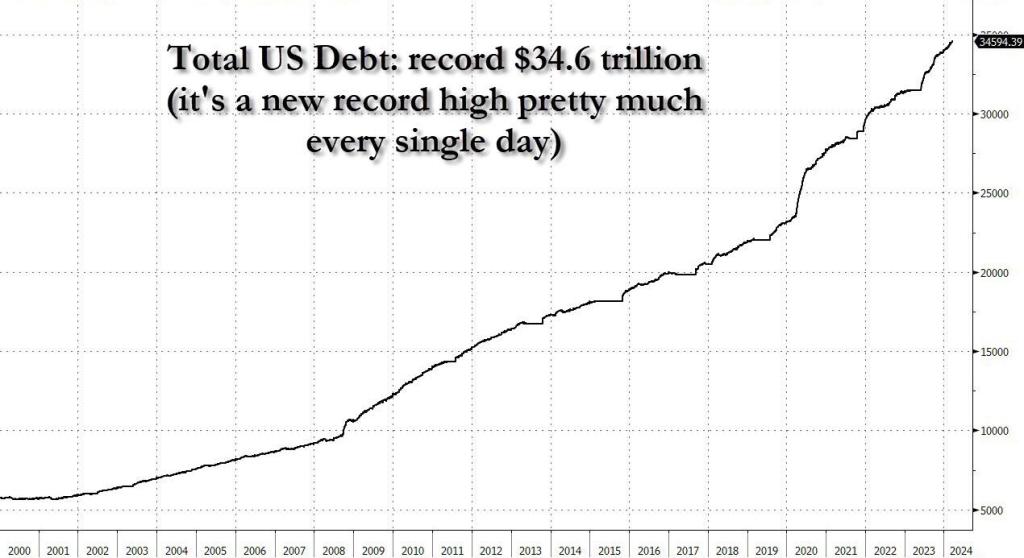
What about the national debt with Ice Cream Joe at the helm? It has exploded in growth.
Not only has it gotten boring to be ahead of the curve by almost half a year, but pretty much every possible warning that could be said about the exponential increase in the US debt has been – well – said.
And yet, every now and then we are surprised by the latest developments surrounding the unsustainable, exponential trajectory of US debt. Like, for example, the establishment admitting that it is on an unsustainable, exponential trajectory.
That’s precisely what happened overnight when in an interview with the oh so very serious Financial Times (which has done everything in its power to keep its readers out of the best performing asset class of all time, bitcoin), the director of the Congressional Budget Office, Phillip Swagel, issued a stark warning that the United States could suffer a similar market crisis as seen in the United Kingdom 18 months ago, during former Prime Minister Liz Truss’s brief stint leading Britain – which briefly sent yields soaring, sparked a run on the pound, led to an immediate restart of QE by the Bank of England and a bailout of various pension funds, not to mention the almost instant resignation of Truss – citing the nation’s “unprecedented” fiscal trajectory.
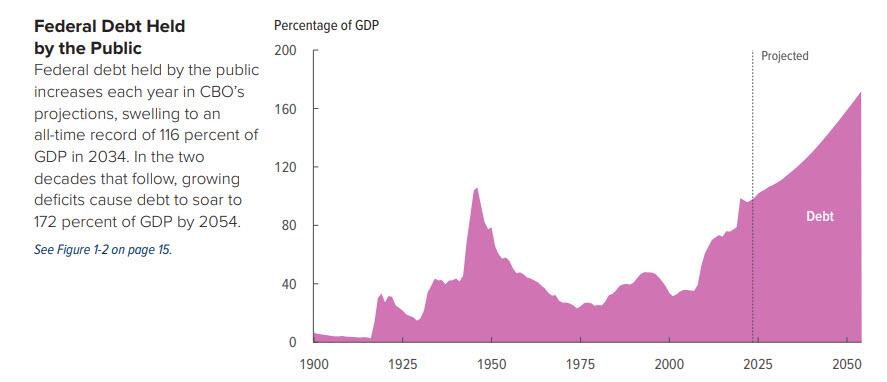
The striking words from the head of the CBO, best known perhaps for publishing doomer debt/GDP projection charts such as this one…
… warned of the dangers of the U.S. facing “what the U.K. faced with former prime minister Truss — where policymakers tried to take an action, and then there’s a market reaction to that action”, comes as US government debt continues to break records, fueling concerns about the burden that places on the economy and taking a toll on America’s credit rating.
As a reminder, in September 2022, Truss roiled markets as she pressed for significant tax cuts, including changes lessening the tax burden on wealthier individuals without offsets, as well as other economic measures. The budget proposal spurred a major selloff of British debt, forcing U.K. interest rates to decades-long highs and causing the value of the pound to tank. While Truss defended her agenda as a means to spur economic growth, she stepped down as prime minister after less than two months on the job following the market revolt to her administration.
Meanwhile, it was up to the Bank of England to bail everyone out: the central bank intervened in the market, pledging to buy gilts on “whatever scale is necessary” with Dave Ramsden, a senior official at the central bank, saying at the time that “were dysfunction in this market to continue or worsen, there would be a material risk to UK financial stability.”
Needless to say, by bringing up the catastrophic rule of Truss, who for at least a few days tried to impose a regime of fiscal and monetary austerity which immediately blew up the UK bond market and led to an instant market crisis, Swagel is admitting that there is nothing that can be done to reverse the growth of US debt and to make what is already an exponential chart less exponential. Quite the opposite, in fact.
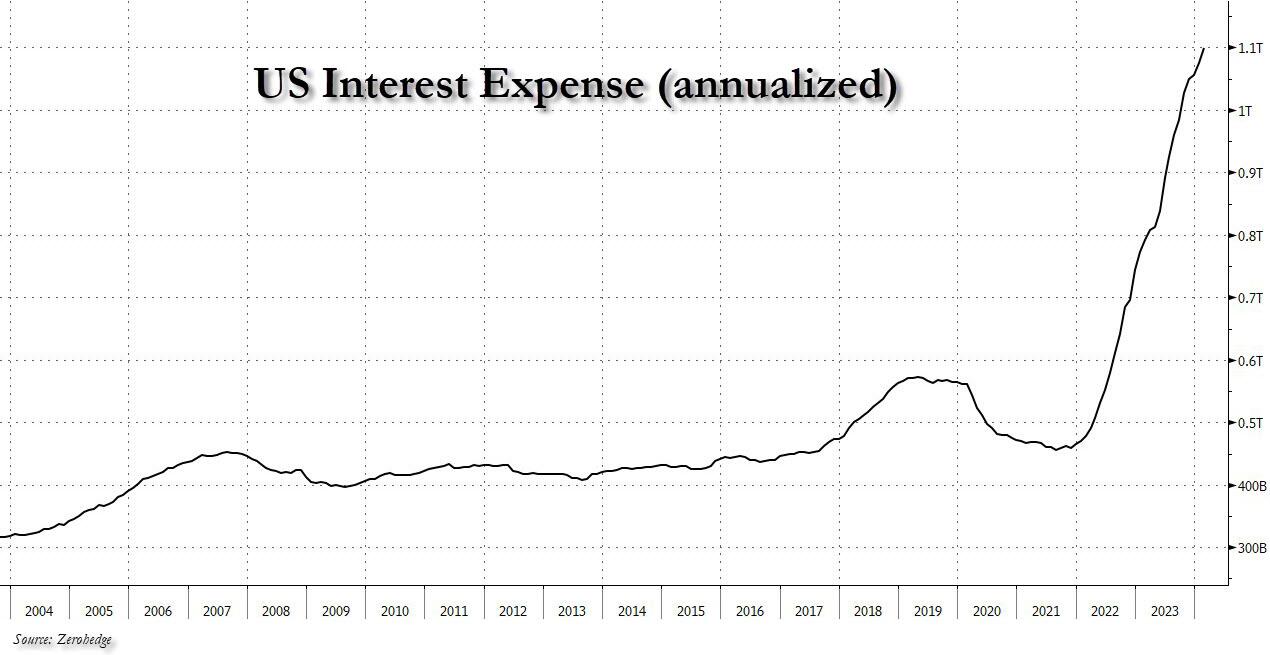
And while Swagel said the U.S. is “not there yet,” he raised concerns of how bond markets could fare as interest rates have climbed. Specifically, he warned that as higher interest rates raise the cost of paying its creditors, on track to reach $1 trillion per year in 2026, bond markets could “snap back.”
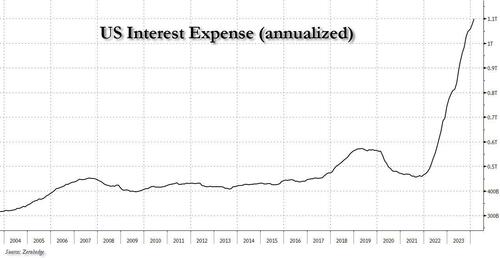
Well, we have some bad news, because if one calculates total US interest on an actual, annualized basis… we don’t have to wait until 2026, we are there already and then some.
Indeed, it seems like it was just yesterday when everyone was talking about US debt interest surpassing $1 trillion (and more than all US defense spending). Well, hold on to your hats, because as of this month, total US interest is now $1.1 trillion, and rising by $100 billion every 4 months (we should probably trademark this before everyone else steals it too).
According to the CBO, US government debt is set to keep rising. “Such large and growing debt would slow economic growth, push up interest payments to foreign holders of US debt, and pose significant risks to the fiscal and economic outlook,” it said in a report last week. “It could also cause lawmakers to feel more constrained in their policy choices.”
Only that will never happen, because a politician who is “constrained” in their policy choices – one who doesn’t feed the entitlements beast in hopes of winning votes (while generously spreading pork for friends and family) – is a politician who is fired.
Perhaps afraid he would sound too much like ZeroHedge, the CBO director left a glimmer of hope, saying that the nation has “the potential for some changes that seem modest — or maybe start off modest and then get more serious — to have outsized effects on interest rates, and therefore on the fiscal trajectory.” But we doubt even he believes it.
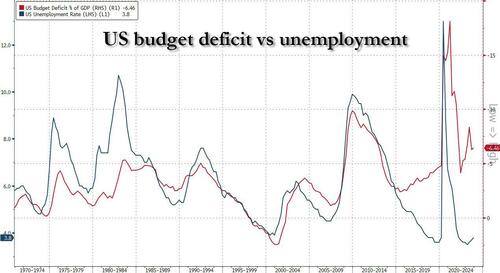
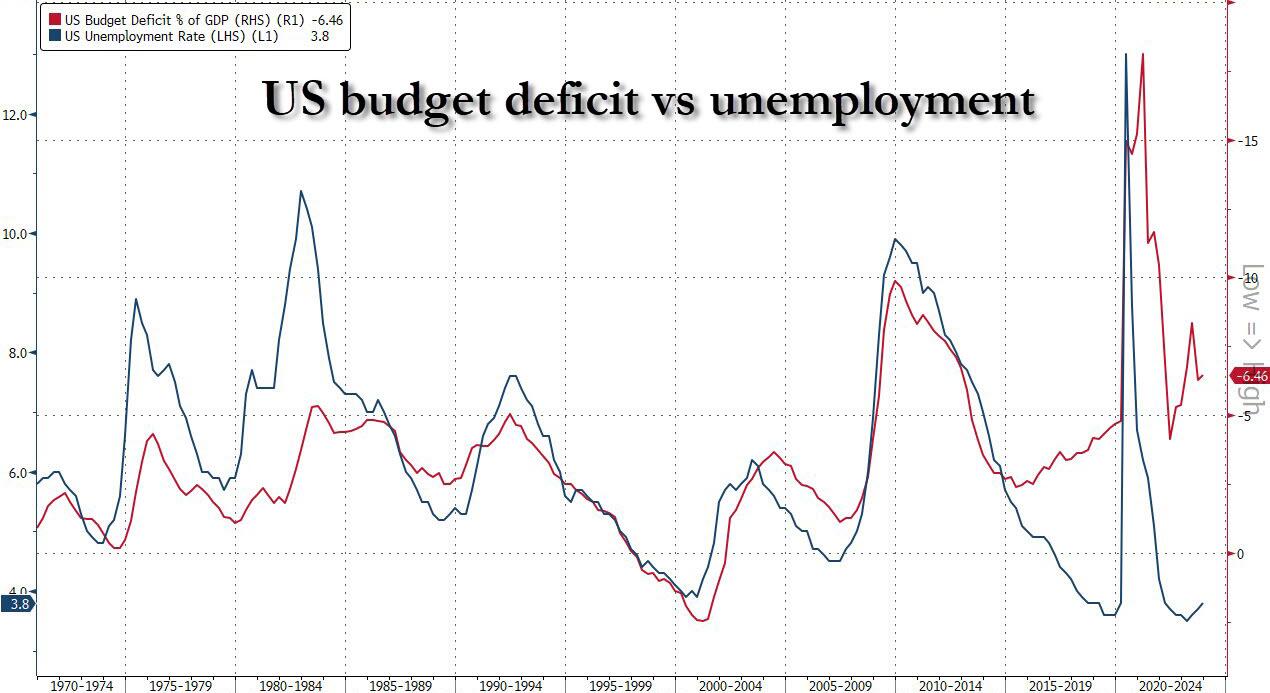
In the CBO’s long-term budget outlook report released last week, the budget agency projected the national deficit would rise “significantly in relation to gross domestic product (GDP) over the next 30 years, reaching 8.5 percent of GDP in 2054.” Which of course, is laughable: the US deficit is already at 6.5% of GDP – a level that traditionally implied there is a major economic crisis – and yet here we are, with unemployment *reportedly* at just 3.8%. Said otherwise, the US deficit will – with 100% certainty – hit 8.5% of GDP during the next recession which will likely be triggered as soon as Trump wins the November election.
The budget scorekeeper attributed the projected growth to rising interest costs, as well as “large and sustained primary deficits, which exclude net outlays for interest.” In short, everything is already going to hell to keep “Bidenomics” afloat, but when you also throw in the interest on the debt, well.. that’s game over man.
Socialists, and other liberals who are only good at spending other people’s money and selling debt until the reserve currency finally breaks, quickly sprung to defense of the debt black hole that the US economy has become.
Bobby Kogan, senior director of federal budget policy at the communist-leaning Center for American Progress think tank, pointed to improved deficit projections in recent years, as well as forecasts from the CBO he said “don’t project anything that looks like a panic.”
“If someone were thinking about, ‘Should I panic or should I not panic?’ I would just say, ‘hey, the underlying situation has gotten better, right?’” Kogan said, adding “there’s been lower, long-term projected deficits in the Biden administration.”
Instead of responding, we will again just show the latest CBO debt forecast chart and leave it up to readers to decide if they should panic or not.
What Kogan said next, however, was chilling: “You either should have been worried a long time ago, or you should be less worried now,” he said. “Because we’ve been on roughly the same path for forever, but to the extent that it’s different, it’s better.”
Actually no, it’s not better. It much, much worse, and the fact that supposedly “serious people” are idiots and make such statements is stunning because, well, these are the people in charge!
But he is certainly right that “you should have been worried a long time ago” – we were very worried, and everyone laughed at us, so we decided – you know what, it’s not worth the effort, may as well sit back and watch it all sink.
And now bitcoin is at a record $72,000 on its way to $1 million and gold is at a record $2,200 also on its way to… pick some nice round number…. in fact the number doesn’t matter if it is denominated in US dollars because very soon, the greenback will go the way of the reichsmark.
And just to make sure that nothing will ever change, even after the US enters the infamous Minsky Moment, shortly after the close we got this headline::
*UNITED STATES AA+ RATING AFFIRMED BY S&P; OUTLOOK STABLE
Because when nobody dares to tell the truth, why should anything change?
When asked about disastrous out of control spending and debt, Biden and Schumer broke into song: “Let it ride!”
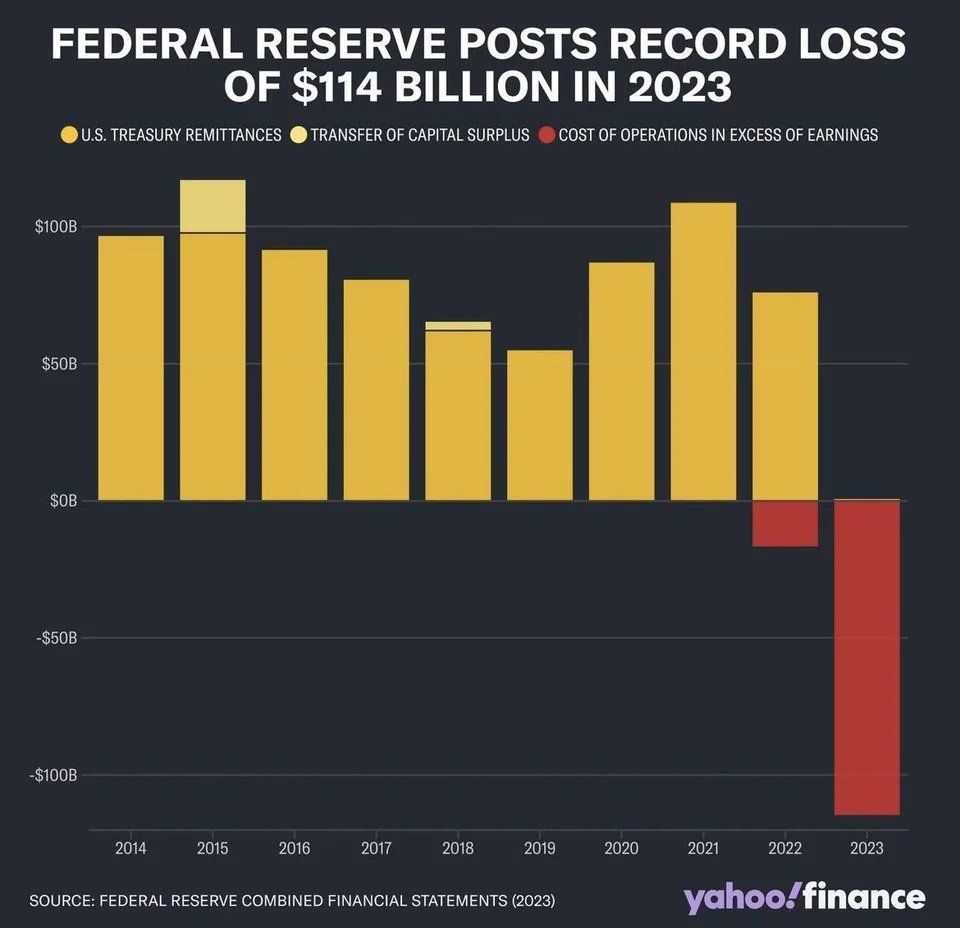
As The Federal Reserve continues to support bad Bidenomics policies, they … like millions of Americans … are suffering catestrophic losses.
The #Fed said on Tuesday that it officially saw a net negative income of $114.3 billion in 2023, a record loss tied to expenses related to managing the U.S. central bank’s short-term interest rate target. The loss last year follows $58.8 billion in net income in 2022, the Fed said.
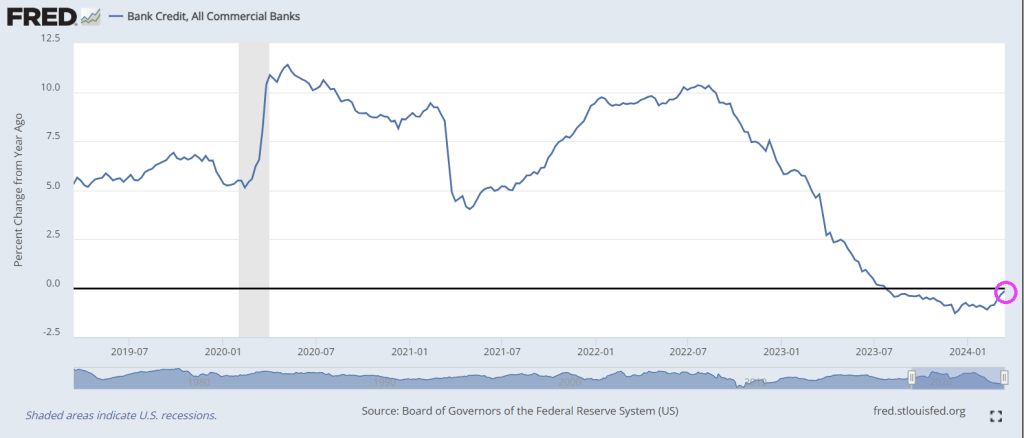
The good news? Bank credit growth is ALMOST back to 0%!
I wonder if KJP or Jared Bernstein will tout almost 0% credit growth as a sign that economists were wrong about Bidenomics?
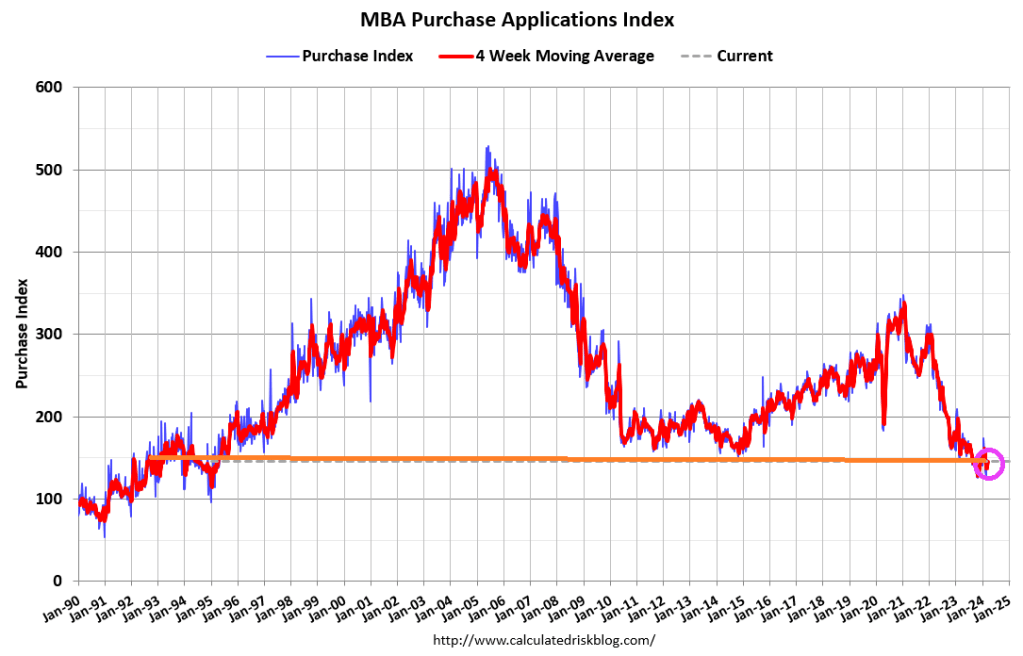
The cargo ship craashing into and collapsing the Key bridge in Baltimore is emblematic of Bidenomics: an ongoing wreck. And the mortgage market is the Key bridge collapse over a longer period. Specifically, from the start of Biden’s Regime in 2021.
Mortgage applications decreased 0.7 percent from one week earlier, according to data from the Mortgage Bankers Association’s (MBA) Weekly Mortgage Applications Survey for the week ending March 22, 2024.
The Market Composite Index, a measure of mortgage loan application volume, decreased 0.7 percent on a seasonally adjusted basis from one week earlier. On an unadjusted basis, the Index decreased 0.4 percent compared with the previous week. The seasonally adjusted Purchase Index decreased 0.2 percent from one week earlier. The unadjusted Purchase Index increased 0.2 percent compared with the previous week and was 16 percent lower than the same week one year ago.
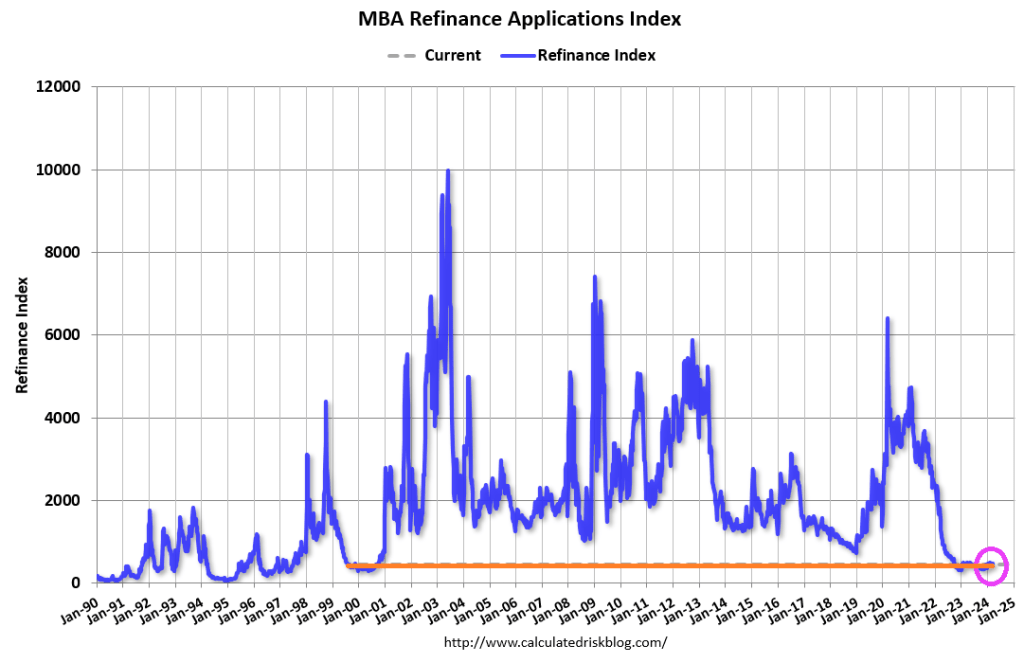
The Refinance Index decreased 2 percent from the previous week and was 9 percent lower than the same week one year ago.
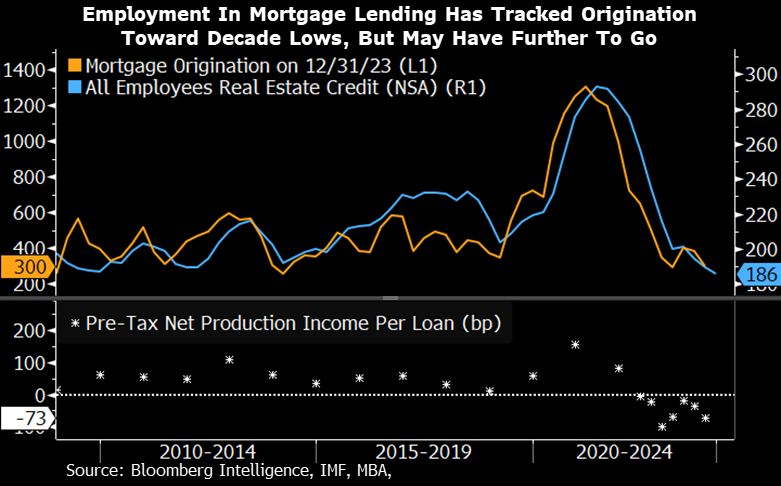
Employment in mortgage lending has shrunk along with collapsing mortgage originations under Biden.
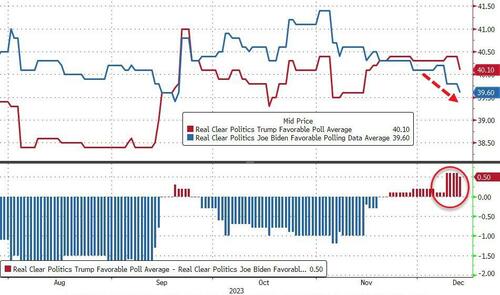
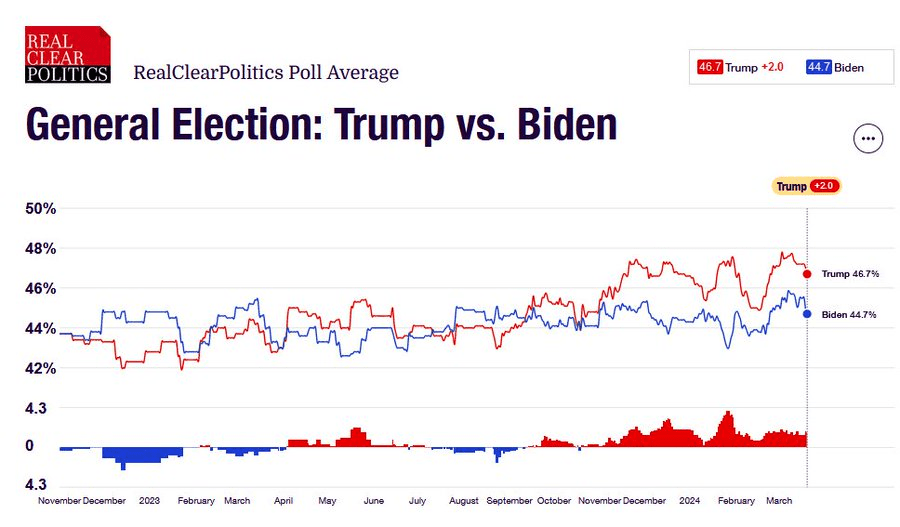
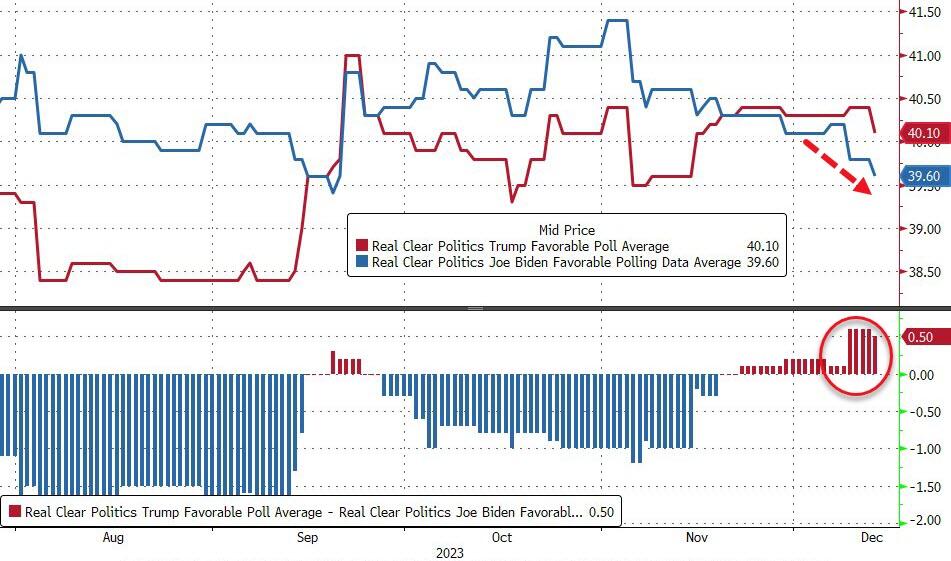
… in the process, sparking the biggest market meltup in a decade, we explained that there was no mystery behind the Fed’s sudden change of heart: it had everything to do with Biden’s woeful performance in the polls.
… maybe what that happened in the past two weeks had nothing to do with economic data, the state of the US consumer, or how hot inflation is running and everything to do with… phone calls from the increasingly angry White House, the same White House which after seeing the latest polling data putting Biden at the biggest disadvantage behind Trump despite the miracle of “Bidenomics” decided to pull its last political level, and had a back room conversation with the Fed Chair, making it very clear that it is in everyone’s best interest if the Fed ends its tightening campaign and informs the market that rate cuts are coming. It certainly would explain why despite keeping the 2026 projected fed funds rate unchanged at 2.875%, the Fed just as unexpectedly decided to pull one full rate cut out of the non-election year 2025 and push it into the pre-election 2024.
I don’t know why @federalreserve is in such a hurry to be talking about moving towards the accelerator. We’ve got unemployment, if anything, below what they think is full capacity. We’ve got inflation, even in their forecast, for the next two years above target. We’ve got GDP growth rising if anything faster than potential. We have financial conditions, the holistic measure of monetary policy, at a very loose level.
… to which we again replied that there is a very simple reason why the Fed is “moving toward the accelerator” and it again had to do with the fact that Biden approval rating is now imploding, so much so that even Time magazine has stepped in with an intervention.
But while once upon a time such a cynical, hyperbolic, and apocryphal view would have been relegated to the deep, dark corners of the financial blogosphere (duly shadowbanned and deboosted by the likes of such Democratic party stalwarts as Google, of course), that is no longer the case and in his latest note, SocGen’s in-house permaskeptic, Albert Edwards confirmed our view that the biggest driver behind the Fed’s decision making in recent months is neither the economy, nor the market, but rather the November presidential election, to wit:
The widening inequality chasm in this US election year will be a real issue for policy makers. What will the Fed do? Traditionally, the Fed would not pivot rates policy to cushion inequality, which is usually addressed by fiscal policy. But growing inequality has been a key issue ever since the 2008 Global Financial Crisis triggered a backlash against ‘The Establishment’ – most evident in the rise in popularism (although many, including myself, believe that the loose money/tight fiscal policy mix was primarily responsible).
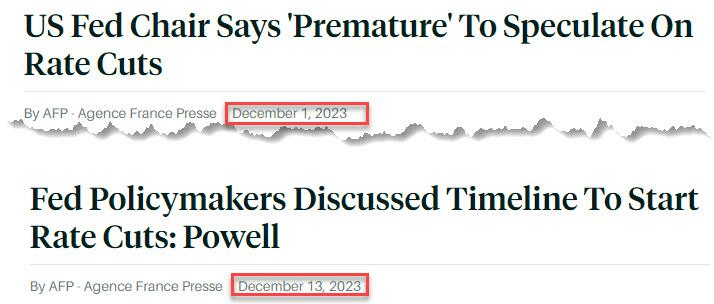
Might the unfolding inequality crisis force the Fed to bow to intense political pressure to cut rates faster and deeper? I think that is entirely plausible. Indeed we on these pages have previously observed, somewhat cynically, that Powell’s recent ‘surprise’ December 2023 dovish pivot came exactly at a time when Donald Trump was pulling ahead in the polls – link. But it would be a diehard cynic who could contemplate that the Fed, as part of ‘The Establishment’, would balk at the thought of Trump winning in November and juice up the economy to try and lower the odds of such an outcome. (I am that cynic.)
To be fair, we find it remarkable that Edwards – a long-tenured and respected veteran of the SocGen macro commentariat – would confirm our own observations. We doubt he is the only one, of course, but the others are far more afraid of losing their jobs, at least for now.
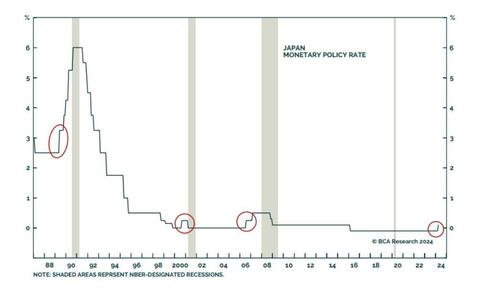
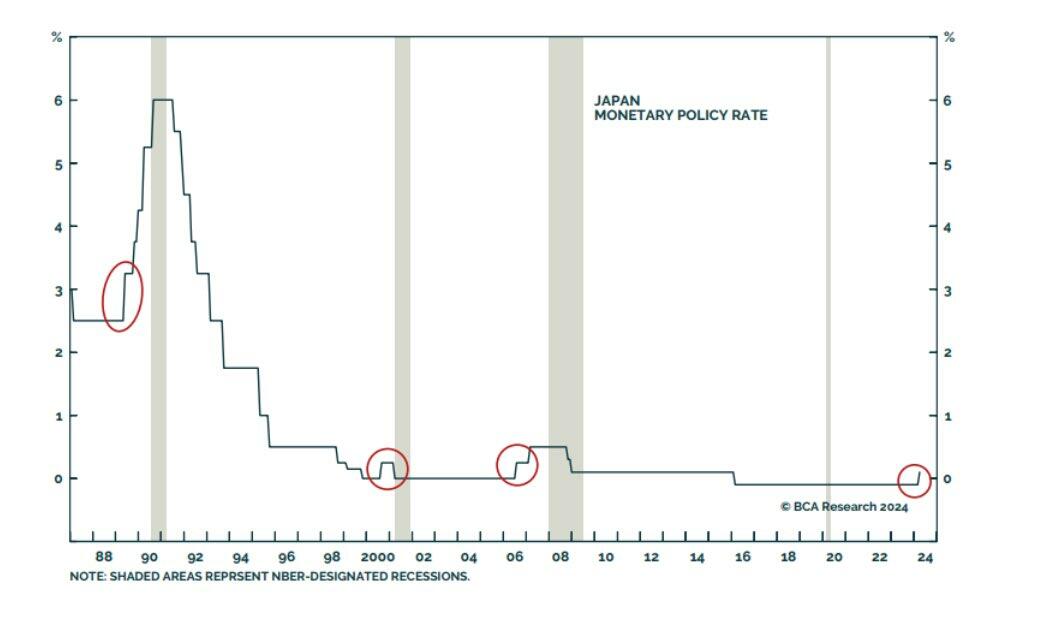
What we find less remarkable is that Edwards – whose job is to track down gruesome and painful ways for the market to die a miserable death – has done just that again and this time, in the aftermath of the BOJ’s long overdue exit from NIRP, ETF buying and Yield Curve Control, predicts that it is now only a matter of time before the YCC that was spawned in Japan will soon shift to the west.
Edwards starts off by observing what has long been a “foolproof” signal of imminent recession: BOJ tightenging:
Market sentiment is now especially vulnerable to weak economic data because, as we pointed out last week, it seems everyone (and their dog) has left their recessionary worries far behind. But as my favorite bear, David Rosenberg, pointed out this week, recent weak retail sales, housing starts, and industrial production data might be setting us up for a negative US Q1 GDP print. Let’s see how the Fed reacts to that. And if you want one reliable predictor of a global recession, @PeterBerezinBCA notes that “In the history of modern finance, no single indicator has done a better job of predicting when the next global recession will start than when the Bank of Japan starts raising rates. Foolproof!”
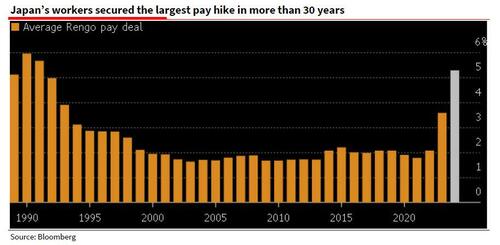
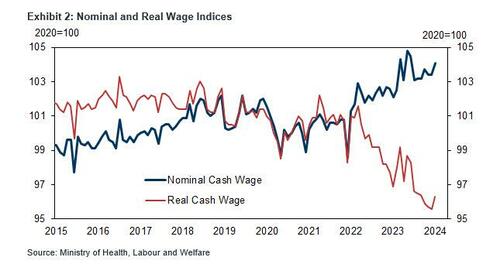
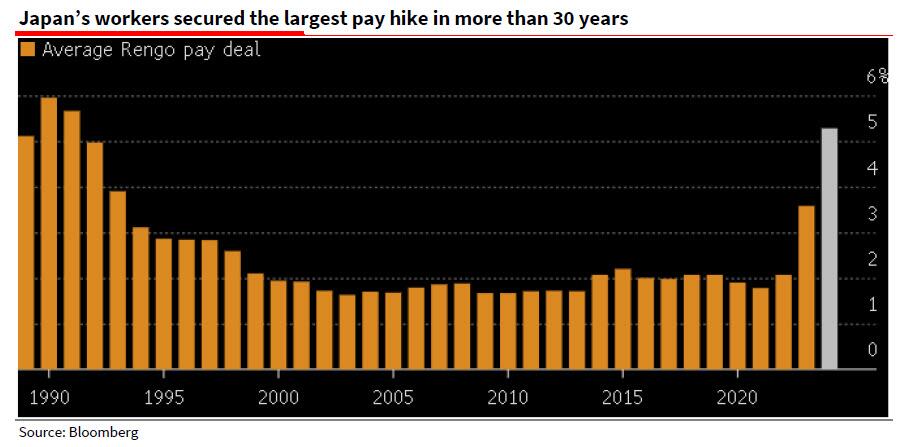
He then recaps last week’s main event, namely that after almost a decade, Japan finally exited negative interest rates and Yield Curve Control (YYC), primarily on the back of soaring (nominal, not real) wage gains: “Rengo, Japan’s largest trade union confederation, announced last Friday that its members have so far secured pay deals averaging 5.28%, far outpacing the 3.8% squeezed out a year ago — itself the highest gain in 30 years (see Bloomberg here and SG Economist Jin Kenzaki’s analysis of this data and the BoJ’s move here).“
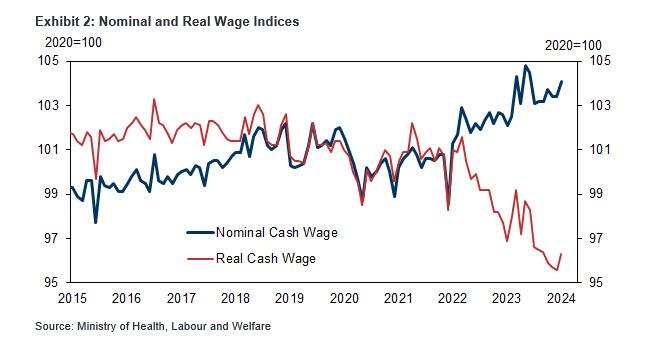
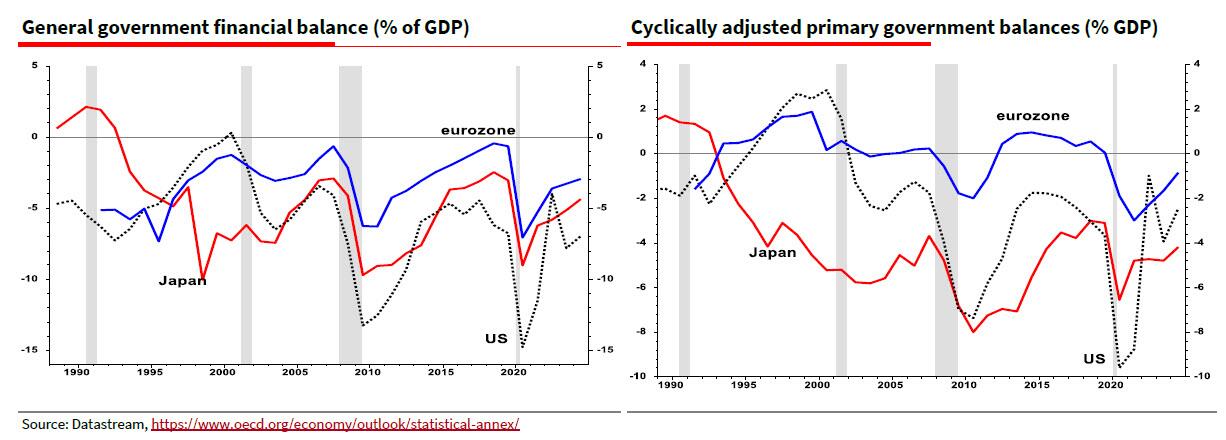
Of course, the problem in Japan is not that nominal wages are surging: it is that in real terms they are crashing, as the next chart clearly shows, and is why the BOJ will have to dramatically tighten – certainly much, much more than the laughable “dovish hike” it delivered last week which sent the yen plunging to a multi-decade low and inviting even more imported inflation – to avoid total collapse in Japan’s economy as it gradually accelerates toward hyperinflation:
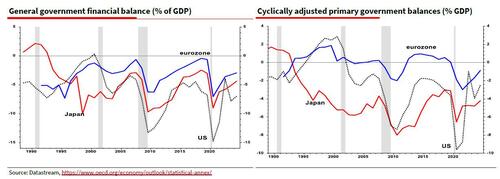
Of course, Japan can not actually tighten as that would instantly vaporize the economy and the bond market of a country whose central bank owns Japanese JGBs accounting for well more than 100% of GDP. But at least Japan has something goign for it: as Edwards notes, “the OCED estimates that interest on US debt amounts to 4½% of GDP, compared to only 0.1% of GDP for Japan (link). Hence the cyclically adjusted primary (ex-interest) deficit data show Japan as the most profligate borrower (see right hand chart). But the US still has to pay that interest somehow.” In other words, when adding interest payment, “it is the US that has been running the largest deficits since the 2008 GFC – bigger than even Japan (see left hand chart).”
Which brings us to Edwards’ punchline: “decades of excessively loose monetary policy has allowed governments to ruin their fiscal situations to the point that public debt to GDP ratios are on wholly unsustainable trajectories. Just look at the CBO’s projections for the US here. Yet with an ever-intensifying populist backlash against high levels of inequality, I can only see one way out of this mess for western economies. Nothing less than Financial Repression including Yield Curve Control – yes, the very same YCC that Japan has just abandoned.”
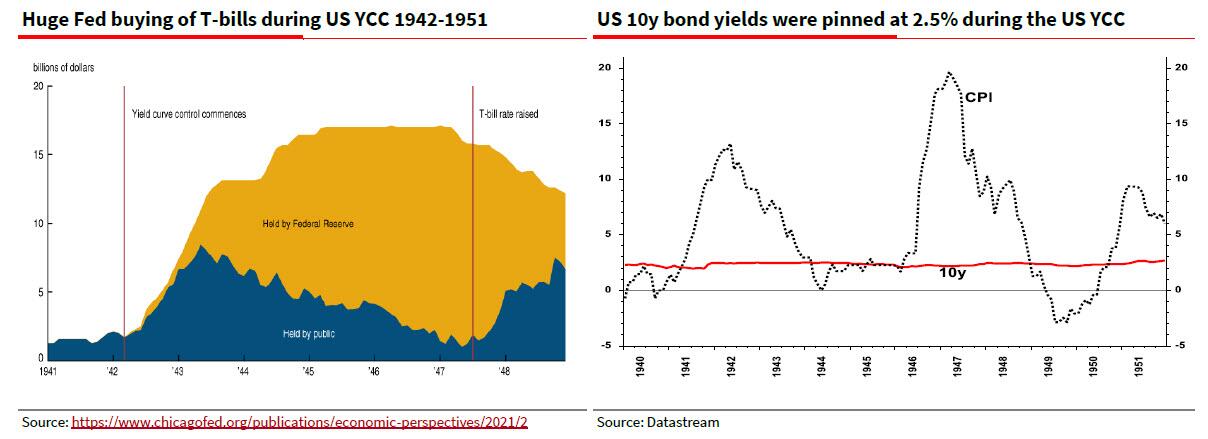
For those who may not have been around back in the 1940s when the US – and the Federal Reserve – was the first developed nation to utilize YCC to kickstart the US economy at a time of record debt to GDP, here is a quick primer from the SocGen strategist: “Financial Repression essentially entails holding interest rates below the rate of inflation for a lengthy period to allow debt to be ‘burned off’. This is a tried and trusted way for governments to wriggle free from excessive debt (eg the US after WW2). The leading economic historian Russell Napier explained how this works in an informative 2021 interview with The Market NZZ – link.”
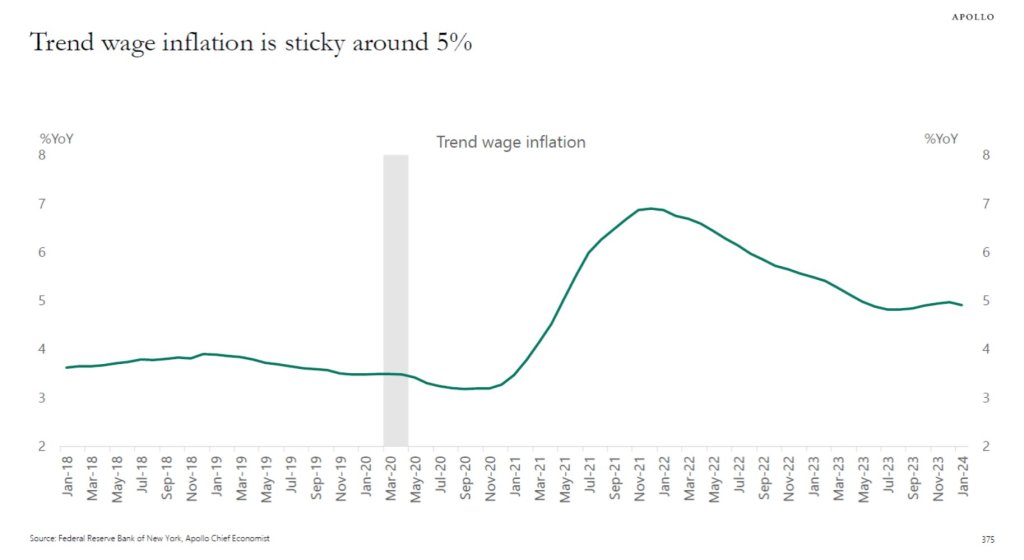
And indeed, it was only a few years ago, just before the pandemic sparked a stimulus flood of epic proportions, that western policy makers were switching to average inflation targeting and stating that they would run economies hot to create that higher inflation (they got it but not because of AIT). That was the first notable attempt to shift toward Financial Repression, but as Edwards notes, “unfortunately they were too successful and let the rampant inflation cat out of the bag.”
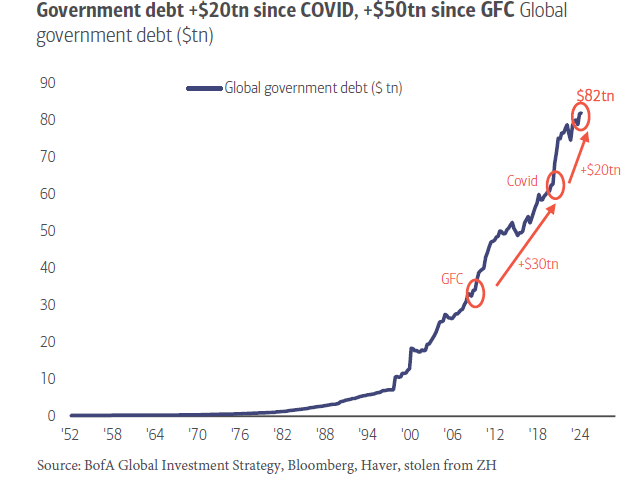
Which brings up the $64 trillion question: “Do the Fed and ECB really want inflation to return to pre-pandemic inflation lows?” Well, with global debt now about 7x higher in just the 21st century, and fast approaching $100 trillion, meaning it will all have to be inflated away somehow…
… Edwards’ answer is: “Not in my view.” And so while western economists deride Japan for its YCC policies, Albert says “that is where I think the US and Europe are heading as intractable government deficits drive up bond yields. During the next crisis, don’t be surprised to see yet more Japanification of western central bank policy. Plus ça change.” And don’t be surprised if the dollar – while appreciating against the rest of the world’s doomed currencies in the closed fiat-system loop – hyperdevalues against such finite concepts which mercifully remain out of the fiat system, such as gold and crypto.
Face it. The Federal government is broken. Congress and the Biden Administration are addicted to spending money and running up massive debts. There is no attempt at fiscal restraint because they will always argue that “More money must be spent!” On what exactly? Usually pet projects (aka, pork) like the LGBTQ retirement home in Boston for $850 thousand and $15 million for Egyptian college tuition.
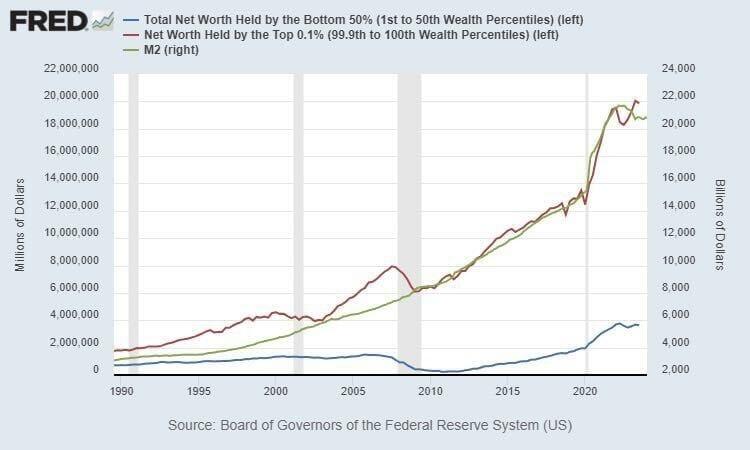
How does “broken money” work? Badly. Without any fiscal restraint, politicians can just give away thousands/millions of dollars to the donor class (donate $1, get $1,000 in return). As you can see, the net worth of the top 0.1% has exploded with each ensuing “crisis.” There was the 2008/2009 financial crisis and the 2008 Covid crisis. With each crisis, the top 0.1% get richer and richer. You will note that net worth for the top 0.1% is closely related to M2 Money printing. Like, who gets the money printed by Uncle Spam? The 0.1%, of course!
Broken money leads people to store their value in sub optimal vehicles like housing. This drives the cost of real estate up unnaturally and increases the gap between the “haves” and the “have nots”. Sowing seeds of animosity. Seeds that, when left to germinate and grow via the further degradation of the money people use, blossom into ugly flowers of Anarcho Tyranny.
This has manifested in the trend of people claiming other’s houses by squatting in them when they are left unattended for an extended period of time. The preferential treatment that has been given to squatters over homeowners in recent years can be seen as the regime which controls the money printers throwing the plebs a bone as they struggle to get by, an attempt to push the productive class to violence against a state unwilling to respect private property rights, or a combination of the two.
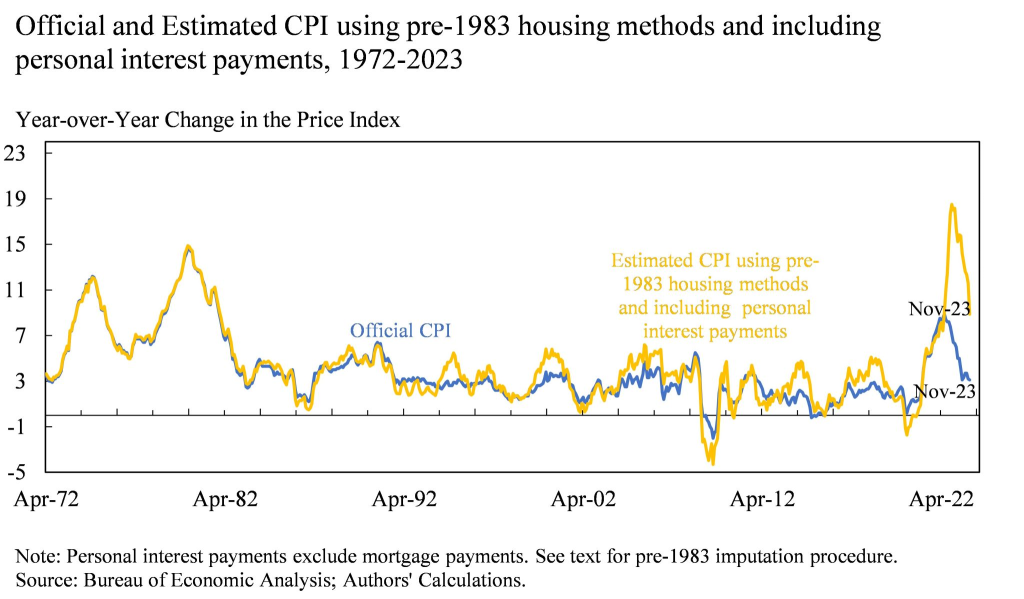
Look at inflation if we use pre-1983 methods. Inflation is still roaring at 18%!
Broken money incentivizes governments to allow their borders to be bum rushed by cheap laborers who will take low paying jobs that enable the systemically fragile economy to keep chugging along while simultaneously increasing the chaos that already exists and diluting the values that the natives of this country believe in.
The excess and decadence enabled by a world run on broken easy money allows people to live in a detached reality that leads them to push objectively false narratives. This is why there are running debates about gender and a retreat from merit based compensation.
All of this stems from broken money.
The chart above should act as a reminder to you all that the biggest problem in the world right now is the money. The chart above should also prove to you that the most powerful people throughout the economy are going to fight tooth and nail to protect the broken money because they benefit massively from the fact that it is broken.
Keep this in mind as the chaos increases and narratives begin to form around using bitcoin as money. But we will never see inflation “normalizing” as long as Congress and Biden keep spending money.
Here are 3 of the BIG SPENDERS, Obama, Biden and Insider trader pro Pelosi. Do any of them look like the care about the bottom 50% of net worth or inflation??
A new $1.2 trillion government spending package Congress is trying to ram through faces significant headwinds in the House, where members are expected to vote on it later this morning.
The 1,012-page bill was introduced at around 3am Thursday morning – just 48 hours before a midnight Friday funding deadline. It must pass both the House and the Senate, after which President Biden will sign it (with crayons at the ready, we’re sure).
The package accounts for approximately 70% of discretionary government spending – and consists of six out of twelve total bills that Congress must pass each fiscal year to fund the government. The six others, around $460 billion in spending, were passed earlier this month.
According to Fox News, multiple GOP sources, two GOP lawmakers and one senior GOP aide think the package will pass, but by a tight margin.
On Thursday afternoon, however, the bipartisan deal hit turbulence – with one GOP lawmaker citing absurd pork contained within – including funding for LGBTQ centers and facilities that provide late-term abortions.
Pork City
As usual, Democrats slipped in as much pork as possible, including:– $850k for a gay senior home- $15 million to pay for Egyptian’s college tuitions- $400k for a gay activist group to teach elementary kids about being trans- $500k for a DEI zoo- $400k for a group to gives clothes to teens to help them hide their gender
$60,000,000,000 for Ukraine (of course). NOTHING for US border.
$1,140,000,000,0000 for pork barrelling
1.2 trillion in inflation, an increase of the money supply by 2% in a single spending bill.
The US Dollar’s purchasing power is down -16% under Gaslight Joe.
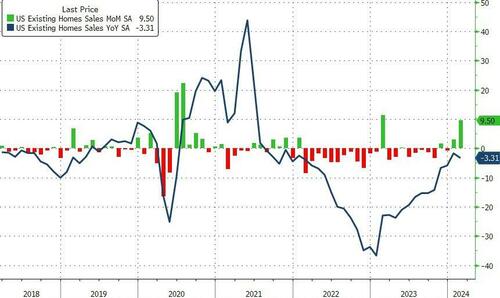
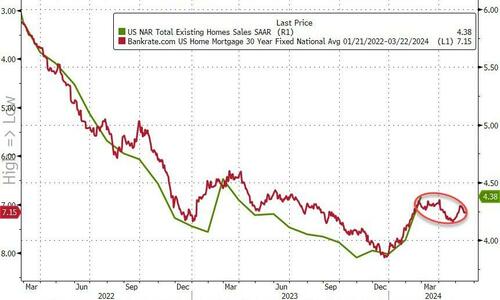
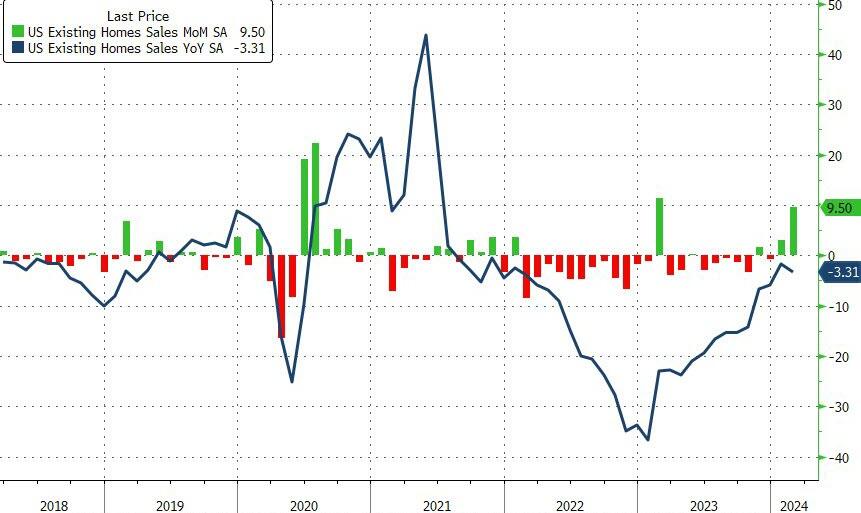
February’s existing home sales are like a scoop of cottage cheese. Seemingly satisfying until you look more closely at the data (or get hungry 30 minutes later).
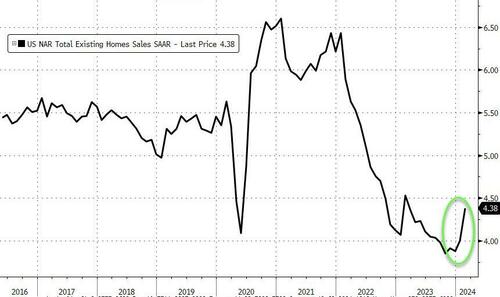
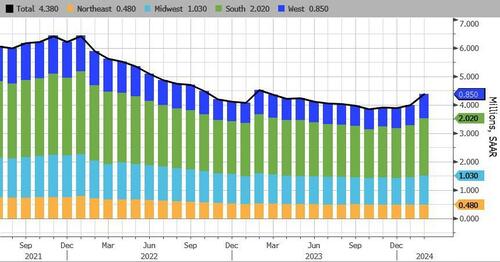
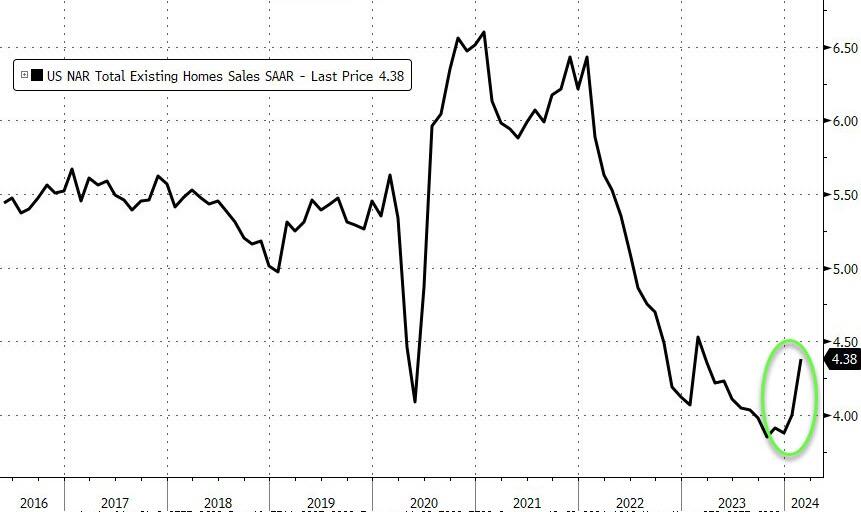
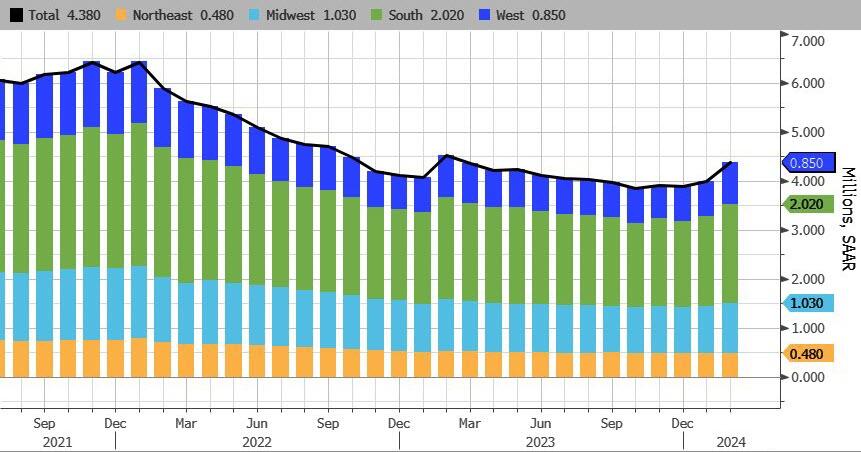
Total existing home sales SAAR surged to 4.38mm – a 12 month high…
Source: Bloomberg
Homeowners may be accepting that mortgage rates are settling into a new normal and can’t delay moving any longer, NAR Chief Economist Lawrence Yun said on a call with reporters.
“Additional housing supply is helping to satisfy market demand,” Yun said in a statement.
“Housing demand has been on a steady rise due to population and job growth, though the actual timing of purchases will be determined by prevailing mortgage rates and wider inventory choices.”
With a 2-month lag, we can see why existing home sales may have risen, but with mortgage rates rising since then, we suspect the fun and games may come to an end again soon (even if the NAR economist thinks otherwise)…
The number of previously owned homes for sale climbed to about 1.07 million last month, and Yun said he expects that will continue to go up. At the current sales pace, selling all the properties on the market would take 2.9 months, the lowest in about a year.
Realtors see anything below five months of supply as indicative of a tight market.
Even with greater inventory, strong demand put upward pressure on prices. The median selling price advanced 5.7% to $384,500 from a year ago, the highest for any February in data back to 1999.
Sales rose in three of four regions, led by a 16.4% surge in the West
First-time buyers made up 26% of purchases in February, matching the lowest on record.


You must be logged in to post a comment.