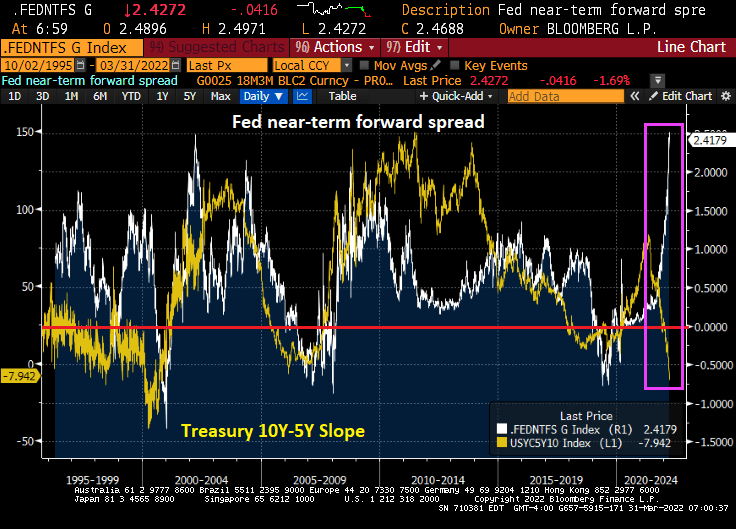
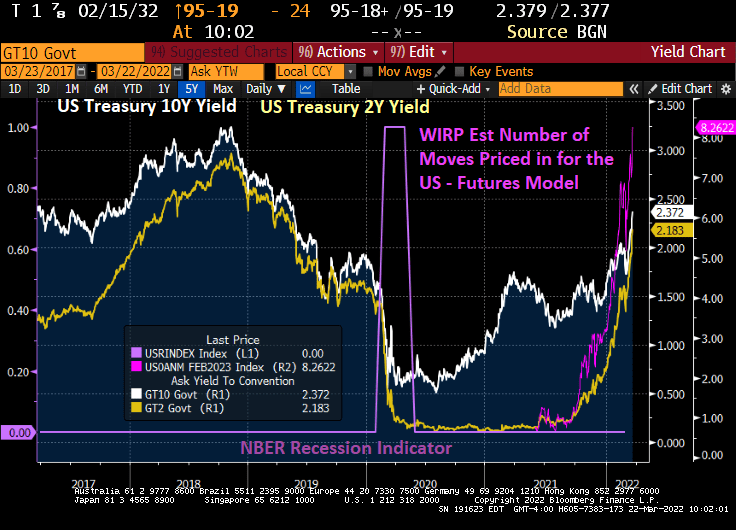
There is a massive divergence between the collapsing US Treasury 10Y-2Y yield curve and the near-term forward spread. The near-term forward spread is the difference between the implied interest rate expected on a three-month Treasury bill six quarters ahead and the current yield on a three-month Treasury bill.
As we already know, the 10Y-5Y yield curve has inverted signaling a coming recession.
This divergence between the Treasury yield curves and the near-term forward spread is occurring as US inflation hits the highest rate in 40 years.
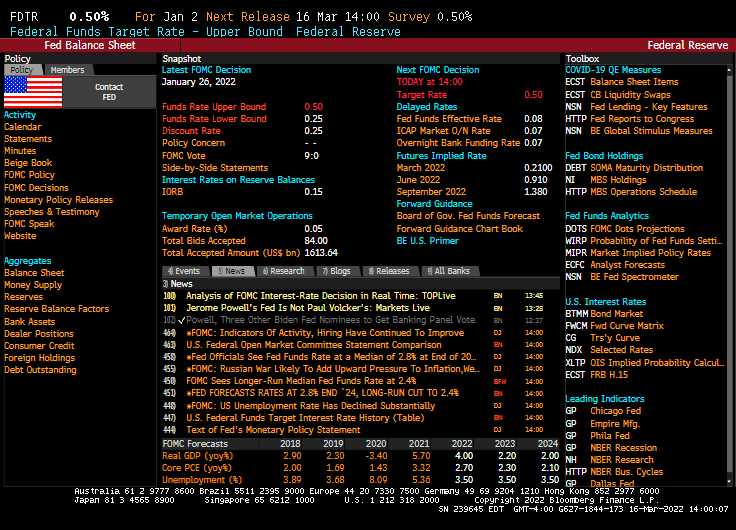
As of today, Jerome “Nero” Powell and The Gang at The Federal Reserve have not trimmed the Fed’s balance sheet and have only raised their target rate once under President Biden.
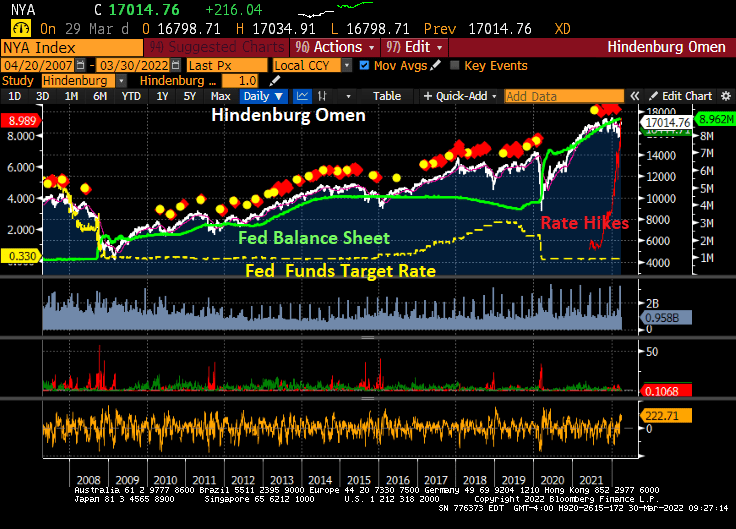
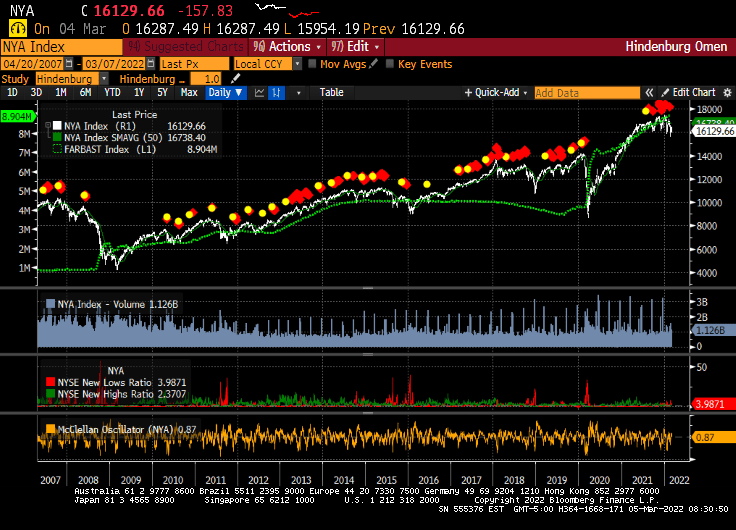
Here is the Hindenburg Omen, named for the catastrophic explosion on May 6, 1937 at Lakehurst Naval Air Station in New Jersey. The Hindenburg Omen was flashing red before the stock market correction of late 2007-2009. But, the Hindenburg Omen has flashed red repeatedly since the financial crisis, yet the S&P 500 index has kept rising. The reason? Repeated policy errors by The Fed leaving monetary stimulus in place for too long leading to a bubble forming in the stock market.
The Shiller CAPE (Cyclically-adjust price-earnings) ratio is at the second highest level since the 1800s. The highest point was the infamous Dot.com bubble and bust in 2000/2001.
Since The Fed continues to say “We have a plan!” to slow/shrink The Fed’s balance sheet and raise their target rate … it has not done anything yet (other than a 25 basis point bump at the March meeting).
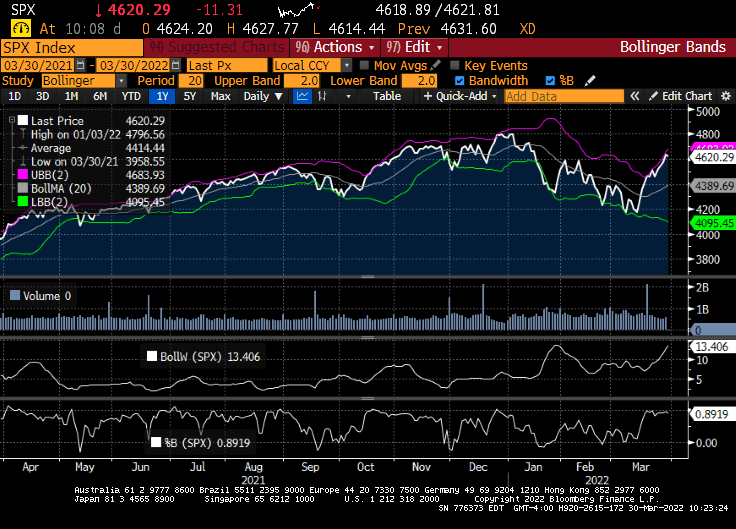
I am not advocating technical analysis for stocks, but the Bollinger Band analysis for the S&P500 index is showing the S&P 500 index near the top band indicating that a decline in likely.
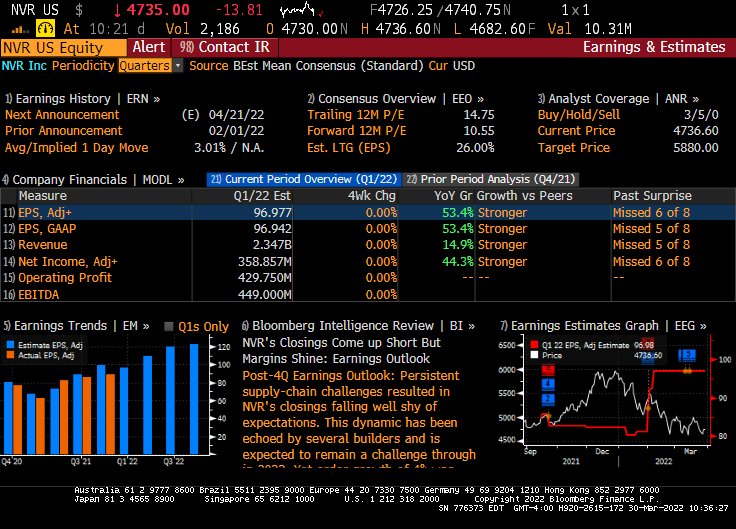
Today, the US equity market in essentially flat given the massive uncertainty about the Russia/Ukraine situation and whether the US economy is slipping into darkness. But this morning, Federal government blessed companies (healthcare, solar energy and Blackrock) are doing quite well, while homebuider NVR is taking it on the chin thanks to hints that The Fed will raising rates.
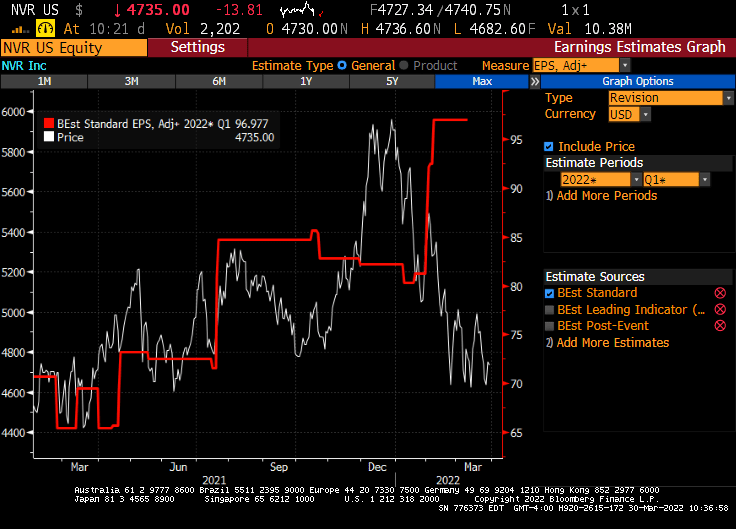
Now, NVR (Northern Virginia Homes, Ryan Homes) had explosive earnings growth in their February 1, 2022 report.
But the market is pricing in the crushing Fed rate hikes that are expected.
So, will Foul Powell pull a Volcker and raise rates and crush the economy (and stocks)? Or will Foul Powell And The Fed gang let inflation burn out of control, but preserve the massive asset bubbles?
So, The Federal Reserve raised their target rate by … as expected … 25 basis points to 50 basis points.
The Taylor Rule suggests that the target rate should be 11.96%. So, Powell and The Gang are getting closer! /sarc
The short-term reaction to the measly rate increase? The Dow declined (but still in positive territory for the day) and the benchmark 10-year Treasury yield spiked to 2.23%.
On Powell’s surrender to inflation, the US Treasury 10Y-2Y curve continued to flatten.
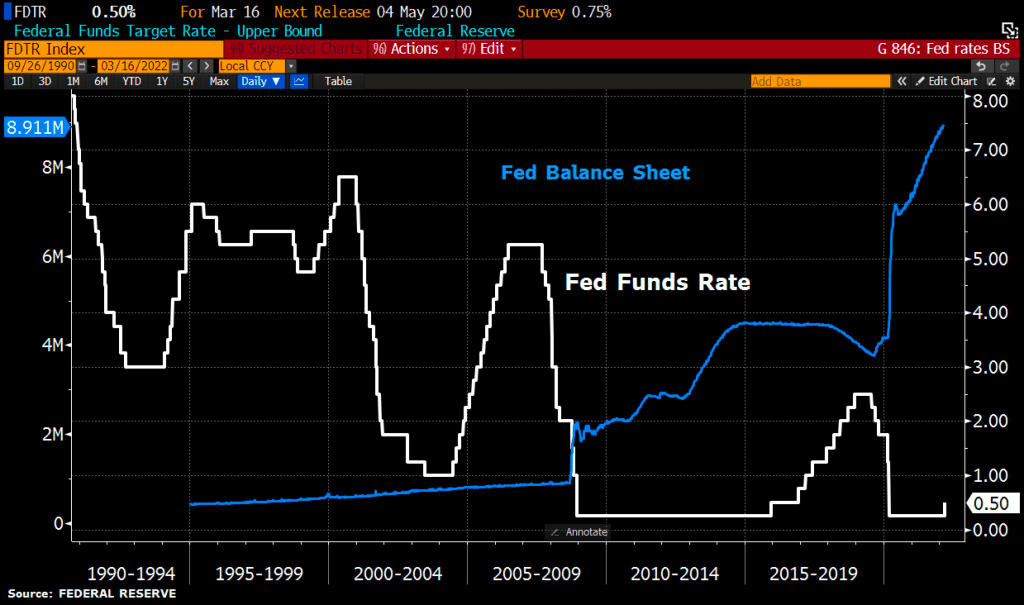
You can see The Fed’s sloth-like response to blood-curdling inflation in the lower right-hand part of the chart.
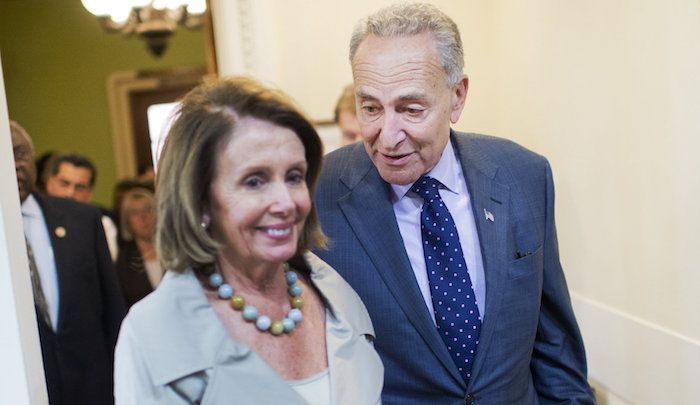
US Speaker of the House and American Oligarch Nancy Pelosi together with Senate Majority Oligarch Charles Schumer passed yet another massive spending bill that seemingly benefited them and not the American middle class.
This legislation would provide $774.4 million for the Members Representational Allowance, known as the MRA, which funds the House office budgets for lawmakers, including staffer salaries. This $134.4 million, or 21 percent, boost over the previous fiscal year marks the largest increase in the MRA appropriation since it was authorized in 1996, according to a bill summary by the House Appropriations Committee. For paid interns in member and leadership offices, the House would get $18.2 million.
This is especially unfortunate given at inflation is growing at 7.9%. If we remove food and energy (two important categories for consumers and retirees), core inflation is growing at 6.4% YoY. As such, Social Security COLA doesn’t even keep pace with CORE inflation, let alone food and energy costs.
In August, Speaker Nancy Pelosi announced staffers’ salaries could exceed those of lawmakers. Members in both the House and Senate, with the exception of leadership, make an annual salary of $174,000. Staffers can make up to $199,300.
After an 11-year drought, congressional earmarks are back with vengeance.
The $1.5 trillion, 2,741-page omnibus spending package is loaded with funding for lawmaker pet projects, some of which could help incumbents in this fall’s elections.
The legislation includes more than 4,000 earmarks, according to a list of projects provided to The Hill by a Senate Republican aide that spanned 367 pages.
One of the biggest winners was New York — thanks to Senate Majority Leader Charles Schumer (D-N.Y.), who is up for reelection this year.
Schumer’s name is attached to 59 earmarks totaling nearly $80 million in the omnibus’s transportation and housing and urban development (HUD) section alone, according to a review by The Hill. He successfully requested funding for the projects either individually or with other lawmakers from his home state.
Is wild-spending Pelosi actually “The Bride of Chucky (Schumer)”?
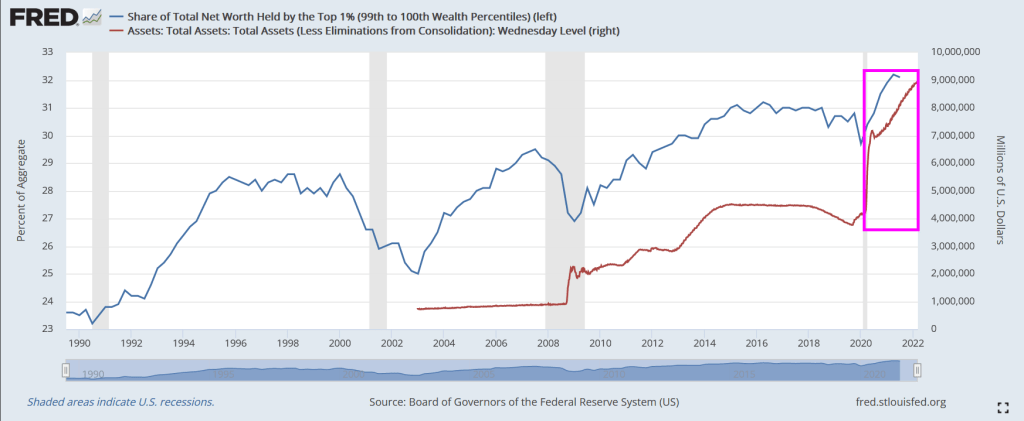
Following the financial crisis of 2008/2009, The Federal Reserve began their dramatic purchase of assets such as Treasuries and Agency mortgage-backed securities (AgencyMBS). And then Covid struck and The Fed went berserk with asset purchases.
So, who benefited the most? The top 1% or the bottom 50%?
Answer? The top 1%. The share of total net worth spiked dramatically after the Fed infusion.
Even the bottom 50% benefited with The Fed’s Covid stimylpto, but no where near how the top 1% benefited.
World Economic Forum’s elitist Klaus Schwab approves of this message!
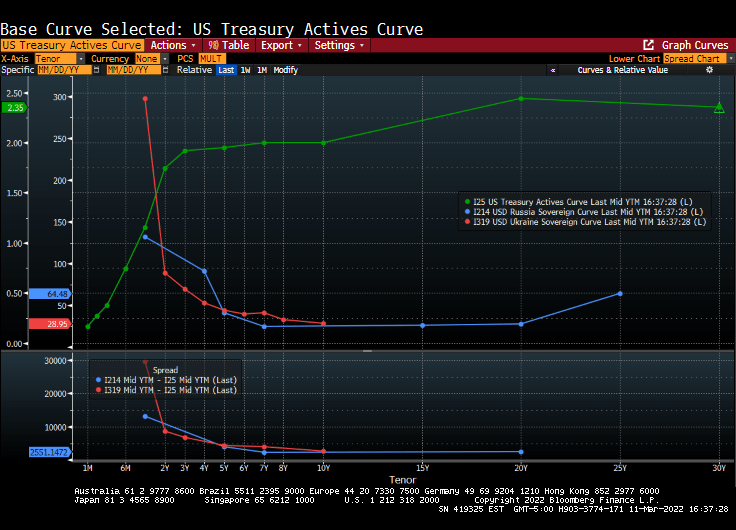
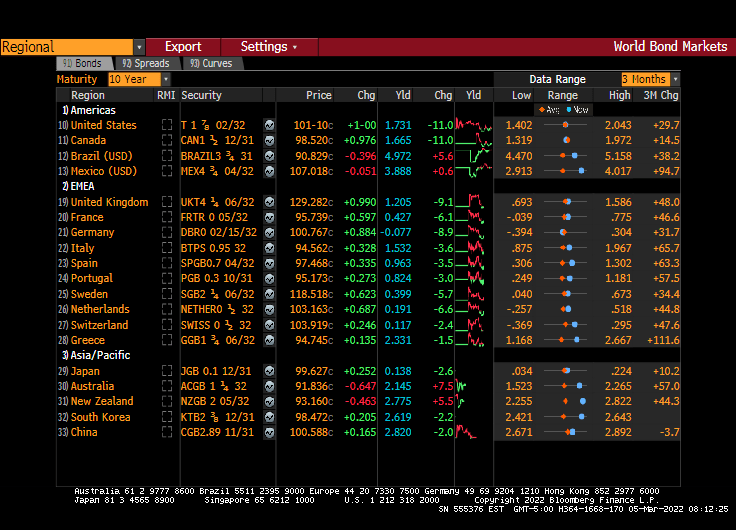
On an unrelated note, the US Treasury yield curve is strongly UPWARD sloping, while Russia’s and Ukraine’s yield curves are inverted and collapsing.
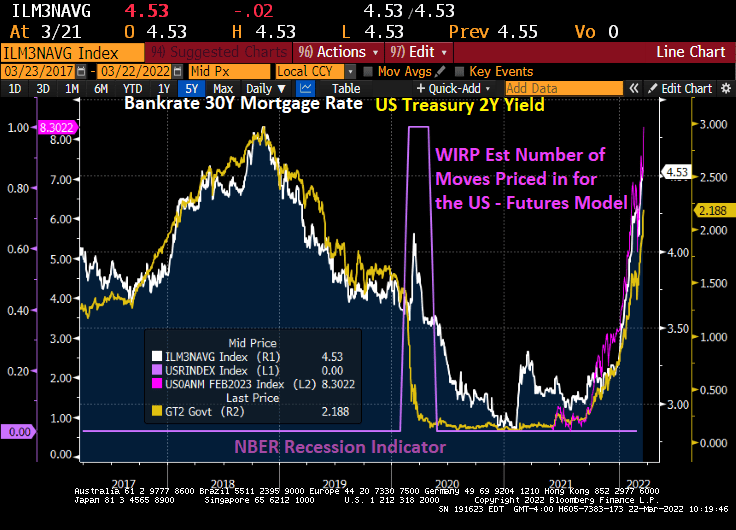
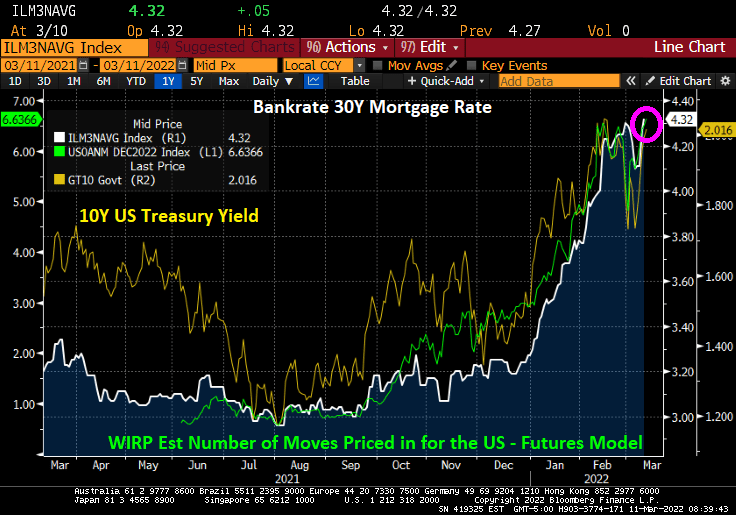
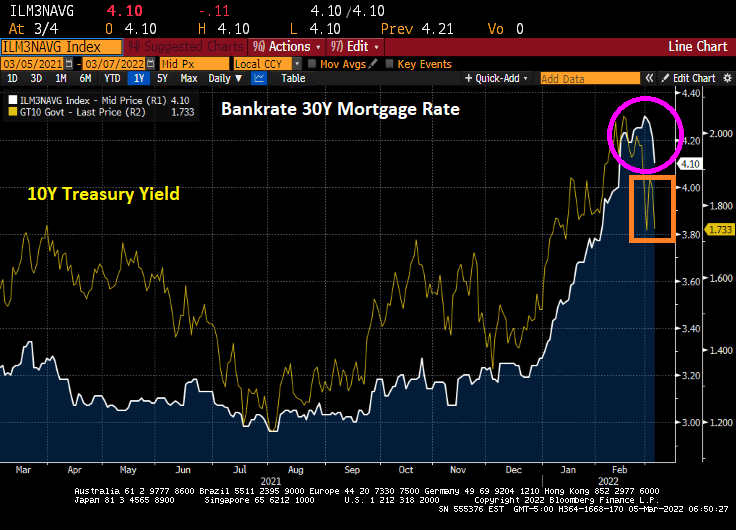
US 30-year mortgage rates rose to 4.32% (Bankrate) as the 10-year Treasury yield broke through the 2% barrier. This is happening as Fed Funds Futures are pointing toward 6+ rate increases over the coming year.
Actually, Fed Funds Futures are pricing in 7 rate increases over the coming year.
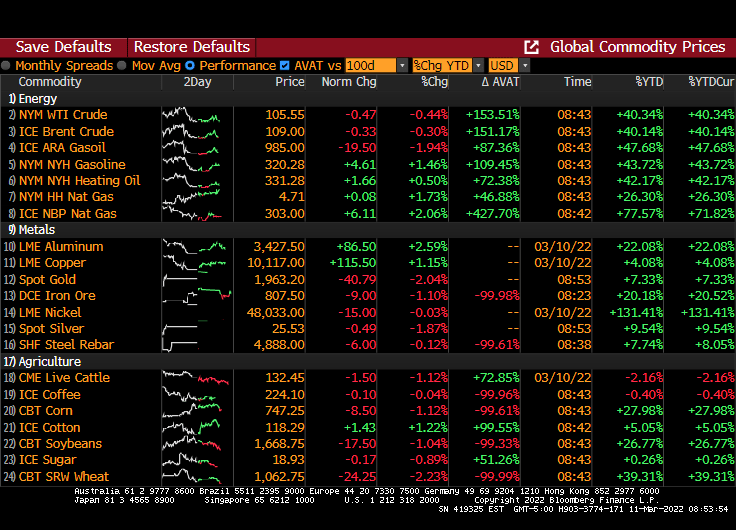
At least all is quiet on the commodities front.
So, it appears that Fed Chair Jay Powell will follow-through with numerous rate hikes over the coming year.
I guess Powell is tired of being a low-rate chump instead of a high-rate champ?
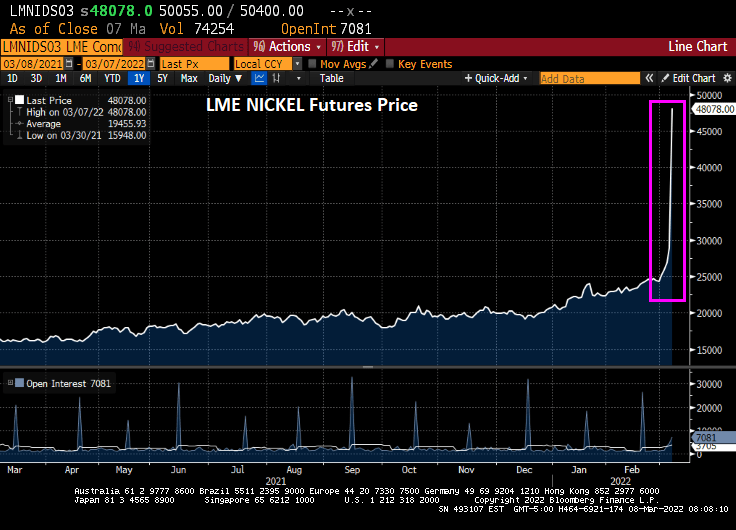
America is suffering a “nickel pickle.” As the US Federal government pushes their green energy agenda, Mayor Pete Buttigieg (aka, Transportation Secretary) on Monday said “the American people stand to benefit from having more electric vehicles on the road.” Unfortunately, electric vehicles use nickle in their production and guess who produces the most nickel? Russia.
Nickel futures were up +66.25%.
Unfortunately, Russia is the largest miner of nickel. But Brazil is second.
We are also seeing rising volatility of US stocks (VIX) and bonds (MOVE) as Russia’s invasion of Ukraine continues and crude oil prices soar.
While NYM WTI Crude volatility is up +296%, NYM DUBAI Crude is up +4,626.19%, and NYM JKM (Japan/Korea) natural gas volatilty is up 1,900%.
Now, US oil and gas exploration and drilling rig count has almost doubled under Biden as oil price surge.
We are in an American pickle since Russia is a major supplier of oil and natural gas as well as nickel.
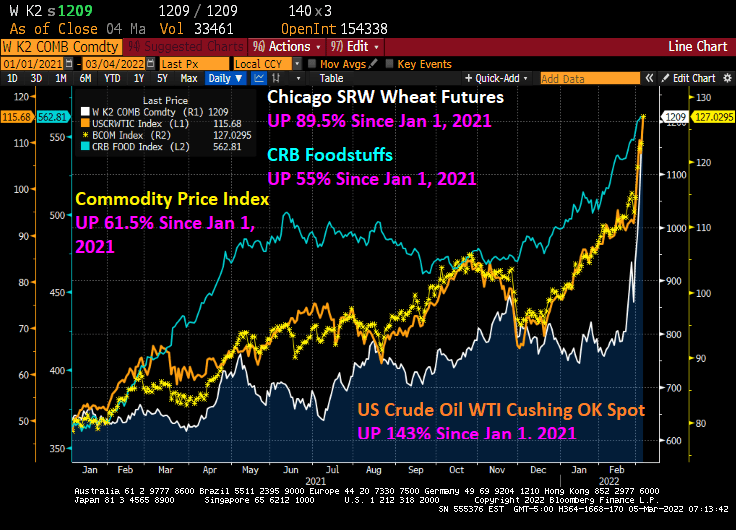
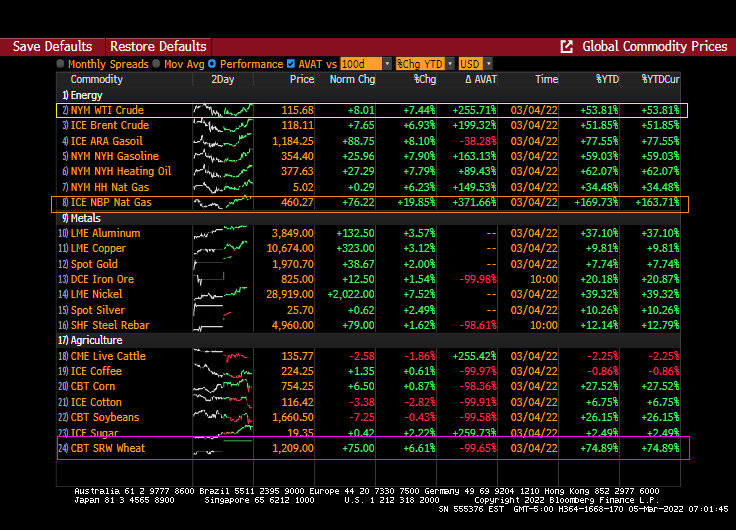
This has been a brutal week for consumers. With the Russia/Ukraine conflict raging and Congress seems determined to not allow for additional oil and gas production, and Biden’s anti-fossil fuel edicts still in place, we are seeing dramatic price increases in wheat (UP 89.5% since January 1, 2021), WTI Crude (UP 143% since January 1, 2021), and food stuffs (UP 55% since January 1, 2021).
Bankrate’s 30-year mortgage rate has actually been falling the last several days, which is good for prospective home buyers as the 10-year US Treasury Note yield has been declining.
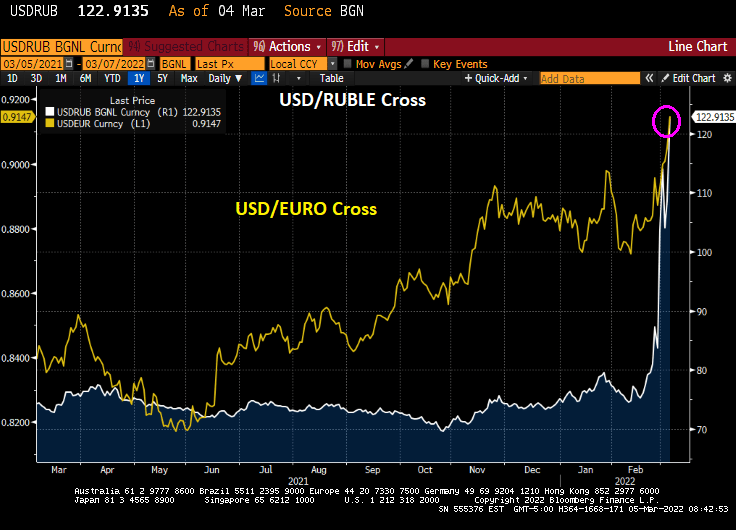
The USD/Russian Ruble cross is skyrocketing and the USD/Euro is doing likewise. Russians visiting the US will find that their trip is suddenly unaffordable (as do many American citizens will its rampant inflation). As Bruce Willis said in “Die Hard,” “Welcome to the party, pal.”
On Friday, the US Treasury 10-year yield declined 11 bps.
And energy prices continue to soar, particularly UK Natural Gas Futures that rose 19.85% overnight.
The US inflation data will be released on March 10th and the consensus is that February CPI inflation will rise to 7.9% YoY.
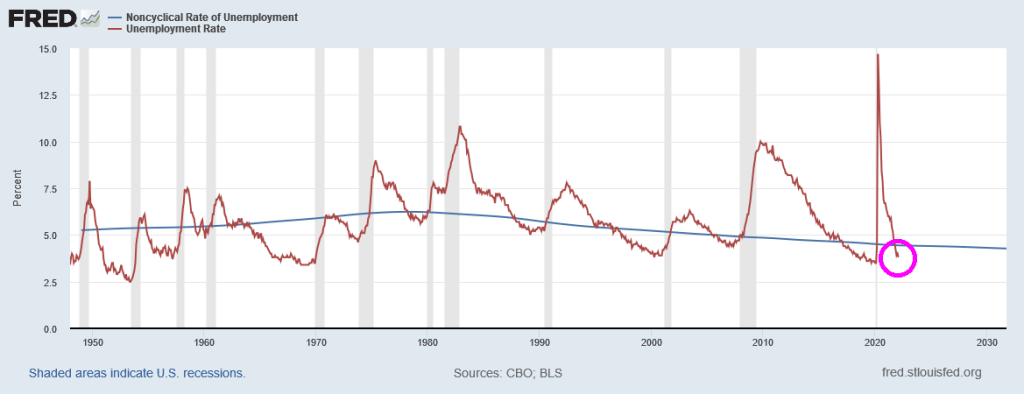
But even the latest unemployment rate report (3.8%) is signalling that The Fed should be raising interest rates since it is lower than the Natural Rate of Unemployment or NAIRU (4.44%).
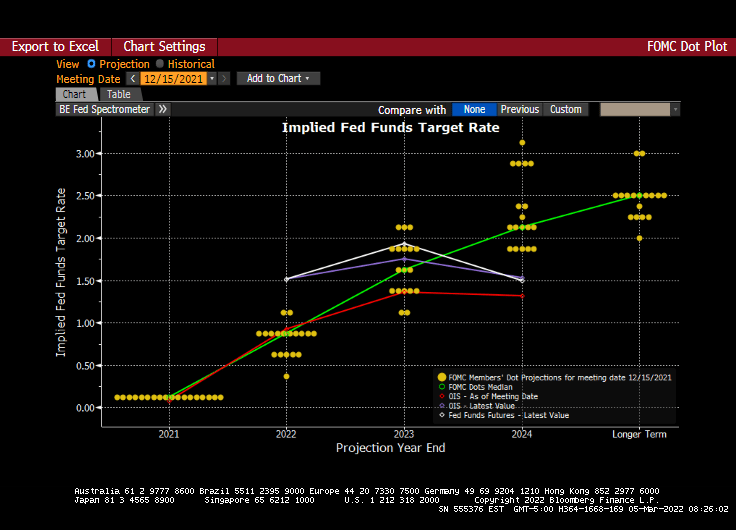
And we have the next Fed policy error on March 16th. The Fed dots plot looks like the glide slope for an aircraft, but the message is that rates will be going up at future meetings.
And just for amusement, I present to you the infamous Hindenburg Omen chart that forecast the 2008/2009 stock market correction. Since that correction, the Hindenburg Omen has been flashing “danger” but the only correction was the COVID-linked correction of early 2020. While the Hindenburg Omen is flashing red right now, The Federal Reserve’s balance sheet (green line) has protected against market corrections. Let’s see what happens if and when The Fed decides to remove the epic monetary stimulus.
Its anyone’s guess as to whether The Fed will actually tighten monetary policy.


You must be logged in to post a comment.