Welcome to the wonderful world of Bidenomics, giving the US 40 year highs in inflation leading The Federal Reserve to remove its enormous monetary stimulus (known as “The Punch Bowl.”
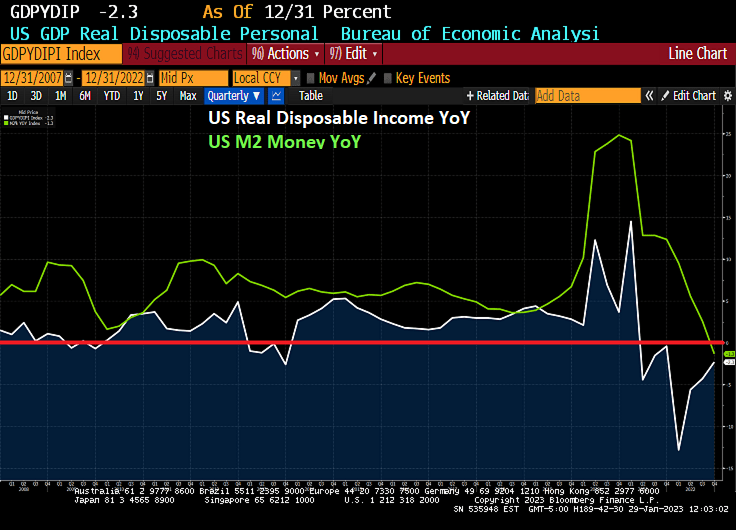
I previously pointed out that US Real GDP was actually less than 1% year-over-year (YoY) in 2022, hardly a fantastic number given the trillions in Biden/Pelosi/Schumer spending (Omnibus, Infrastructure, etc) and Powell/Fed’s whopping monetary stimulus in 2020. But real disposable income, the amount households have left to spend after adjusting for inflation, had been falling for 7 straight months.
In fact, REAL disposable personal income peaked in March 2021, shortly after Biden was sworn-in as President in Janaury 2021 at $19,213.9 billion (or $19.214 TRILLION). As of December 2022, real personal disposable income had fallen to $15,213.0 or $15.213 TRILLION. That is a loss of $4 TRILLION since March 2021. Or a -21% Loss in Real Disposable Income.
There was a hilarious film with Hillary Swank and Aaron Ekhart called “The Core” where earth’s core stops spinning and the earth gets cooked by the Sun’s rediation. Now we learn that the Earth’s inne core has actually stop spinning. This time, however, all that has happened is that Joe Biden is President which is almost as bad,
But also related to “The Core” is that the important Personal Consumption Expenditures (PCE) are out for December along with PCE price deflator numbers. In short, personal income was up 0.2% month-over-month (MoM) in December while personal spending was down -0.2%. REAL personal spending was down -0.3% MoM.
But the all important PCE deflators numbers were down all well. The REAL PCE price index (or deflator) was down to 5.0% YoY in Decmember while REAL CORE price index was down to 4.40%. All this is happening as M2 Money growth has stop spinning (down to -1.3% YoY in December).
Based on a CORE PCE YoY of 4.40%, the Taylor Rules suggest that The Fed Fund Target rate should be … 10%. However, the current Fed Funds Target rate is only 4.50%, so The Fed is not even half way there.
Fed Funds Futures are pointing to a peak rate of 4.90% by the June ’23 FOMC meeting, then a pivot (despite denials from Fed talking heads).
Of course, The Fed doesn’t follow the Taylor Rule or any other transparent rule for rate management. Rather, Fed Chair Powell like former Chair (and current Treasury Secretary Janet Yellen) follow a more seat-of-the-pants approach.
First, US default risk as measured by credit default swaps remains elevated (primarily because Biden and Democrats refused to cut wasteful spending or reign in non-retirees on Social Security). And NY Fed’s Reverse Repos remain elevated.
And then we have Citi’s economic surprise index for the US at -17 as The Fed slows money growth to 0%.
I wish I knew a place where inflation and insane Federal government spending and policies doesn’t exist.
The Thrill Is Gone from the US housing market as M2 Money growth fells to 0%.
US Existing Home Sales fell -1.5% from November to December (MoM) to 4.02 SAAR units sold. That translates to a depressing -34% decline since December 2021 (YoY).
On the positive side, these numbers are better than expected (-3.4% MoM expected). Still, these numbers are pretty dismal.
Existing home sales MEDIAN PRICE fell to $366.9k as M2 Money growth vanishes. And inventory of existing homes for sale remains lower than pre-Covid levels.
Let’s see what Powell and the Gang (aka, The Federal Reserve Board of Governors) does with interest rates going forward.
Today, the 10-year Treasury yield is up 7.1 basis points, but the real action is in Europe where sovereign yields are up 11.5 bps in France, 9.8 bps in Germany and 18.6 bps in Italy.
Mortgage applications increased 27.9 percent from one week earlier, according to data from the Mortgage Bankers Association’s (MBA) Weekly Mortgage Applications Survey for the week ending January 13, 2023. But mortgage applications are 60% lower than the same week last year.
The Refinance Index increased 34 percent from the previous week and was 81 percent lower than the same week one year ago. The seasonally adjusted Purchase Index increased 25 percent from one week earlier. The unadjusted Purchase Index increased 32 percent compared with the previous week and was 35 percent lower than the same week one year ago.
Here are the stats.
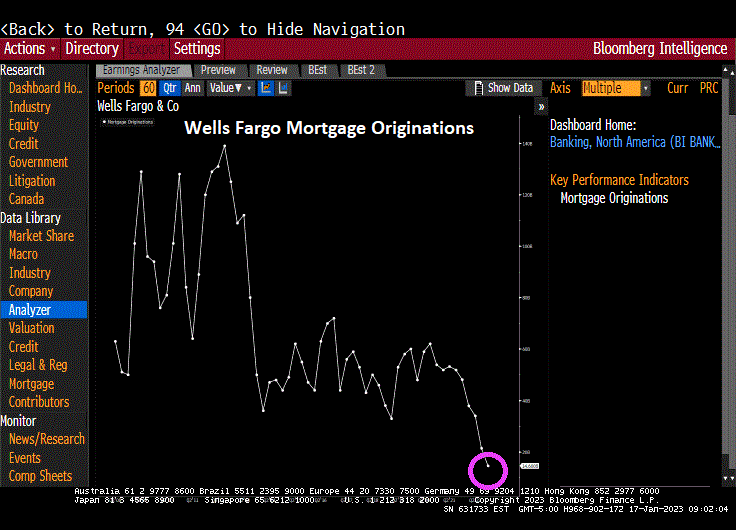
One lender in particular, Wells Fargo, smells blood in the economic waters, and has cut back mortgage originations.
Just remember, mortgage applications generally rise in the first part of the year until May, then start slowing until the last week of the year. This is called seasonality. But despite the fast growth this year, purchase applications are still down -35% compared to last year at this time.
We got trouble in Potomac City! No, I’m not talking about the numerous Top Secret documents that Biden carelessly left in his garage in Delaware and the UPenn Biden Center. And they found more over the weekend. I’m talking about the US Treasury 10Y-2Y yield curve being inverted for 135 straight days. And thanks to inflation, REAL wage growth has been negative for 21 straight months.
All this is happening while M2 Money growth (green line) stalls to 0% YoY.
Swaps 5Y are rising as The Fed withdraws monetary stimulus.
I don’t think this is a record that Biden can run on for re-election: 21 straight months of NEGATIVE REAL WAGE GRWOTH. Fortunately for Fed Chair Jay Powell, he is not an elected official.
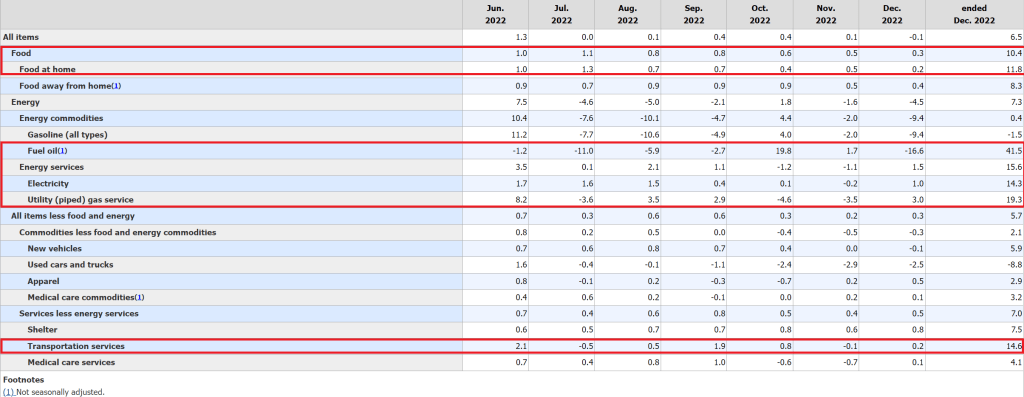
The December inflation report still shows elevated inflation in the US, but only -0.1% since November (MoM), but still high compared to last year (6.5% YoY). That is still over 3x The Fed’s target inflation rate of 2%.
While headline inflation fell to 0.1% MoM, CORE inflation (removing food and energy) rose again 0.3% MoM and 5.7% YoY.
What exactly went up in price in December? Food and energy were all over 10% YoY growth.
At 6.50% YoY headline inflation, the Taylor Rule suggests a Fed Funds Target rate of … 13.13%. Well, I guess that Powell will say there is more rate hikes to be done.
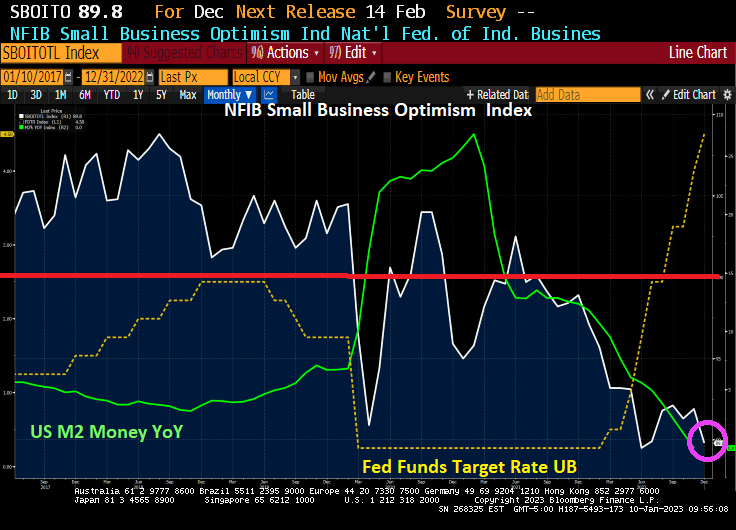
The NFIB Small Business Optimism Index is plunging and just fell below 90. The index was above 100 before the Wuhan virus outbreak in 2020, but has only been at 100 or above for only two months under Biden. And the trend is definitely looking bleak as The Federal Reserve fights inflation with M2 Money growth having collapsed to 0% YoY growth.
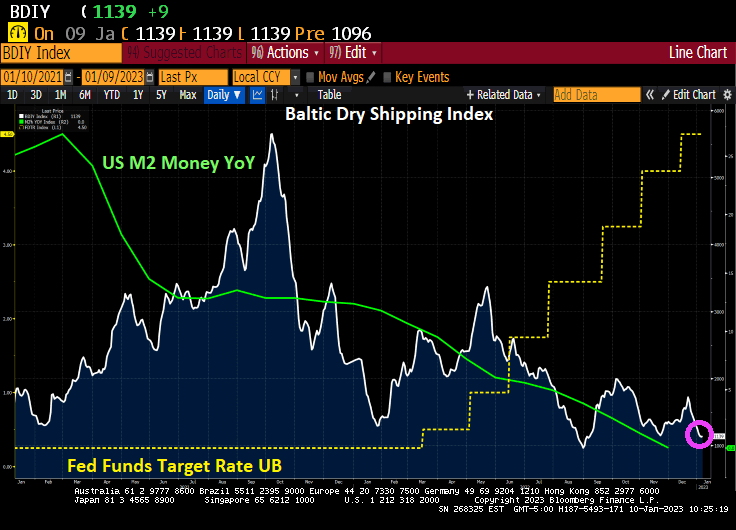
And the Baltic Dry shipping index is falling with M2 Money growth YoY.
I wonder what Fed Chair Jerome Powell is thinking?
Today is all quiet of the financial market front since the US stock
Today is all quiet of the financial market front since the US stock and bond markets are closed. But as the new year starts, we have to ask the following question: is the US already in a recession?
A simple measure of IMPENDING recession is the US yield curve which is currently inverted. Typically, a recession occurs within months of the yield curve inverting. But if we look at real GDP growth, the Atlanta Fed GDP tracker is at 3.7%, so no recession there (two consecutive quarters of negative GDP growth is often used as a measure of recession).
But another indicator of “all is not well” is the CBOE Put/Call Ratio. Typically, the Put/Call Ratio spikes during a recession. But on December 28, 2022, the Put/Call Ratio spiked to its highest level since 1996. Although it has calmed down to 0.84 on December 30, 2022. Suffice it to say that there is enormous uncertainty in markets.
Covid begat massive Fed monetary stimulus and an excuse for the Federal government to go on a series of spending sprees (Covid “relief”, Instrastructure, Inflation Reduction, and now the $1.7 Trillion pork-laden Omnibus bill). Now that historic big spender Nancy Pelosi (CA-D) is no longer Speaker, will her successor have such a voracious spending appetite? The US economy is still benefitting from Covid-related stimulus which also helped generate 40-year highs in inflation.
Thanks to inflation, US workers have had 20 consecutive months of negative wage growth. But as M2 Money growth slows to a halt, so will real average hourly earnings.
The traditional measures of recession (unemployment and Real GDP growth) are NOT pointing to recession, but 20 straight months of negative wage growth points to bad news for workers. Throw in an inverted yield curve and massive volatility in the CBOE Put-Call Ratio and we have a party … that I don’t want to attend.
2022 is one of the record books and not in a Tiger Woods way. Call it a year of pain.
First, the US enacted policies that drove up energy prices (goin’ green) that reverberated through the entire economy in the form of higher prices. Second, The Federal Reserve, in attempt to combat runaway inflation, started removing the excessive monetary stimulus that had been around since Fed Chair Bernanke initiated QE, the seemingly unlimited purchase of Treasury and Agency MBS securities. Janet Yellen continued the massive asset purchases and zero interest rate policies or ZIRP. Now that inflation has struck the American middle class hard, we are seeing Fed Chair Powell doing what Bernanke and Yellen wouldn’t do — remove the monetary punchbowl.
Using Robert Shiller’s on line data, US stocks and bonds have had an awful year, the worst combined year since 1871.
US equity returns have been demolished under the NEW dual mandate (goin’ green = rising prices = Fed tightening).
Let’s see how two of the most famous investment gurus did in 2022, Warren Buffet and Cathie Wood. Buffet’s Bershire Hathaway Class A equity was UP 4% in 2022, while Cathie Wood’s ARK Innovation ETF collapsed by -67% in 2022.
Here is the clinker. The US economy (as well as the global economy) seem dependent on “cheap money” from Central Banks like The Federal Reserve. So the question is … will The Fed pivot? Fed talking heads are saying no, but Fed Funds investors are saying yes to a pivot after June 2023.
Ulysses S Grant was the President the last time the combined stock and bond market was this bad.


You must be logged in to post a comment.