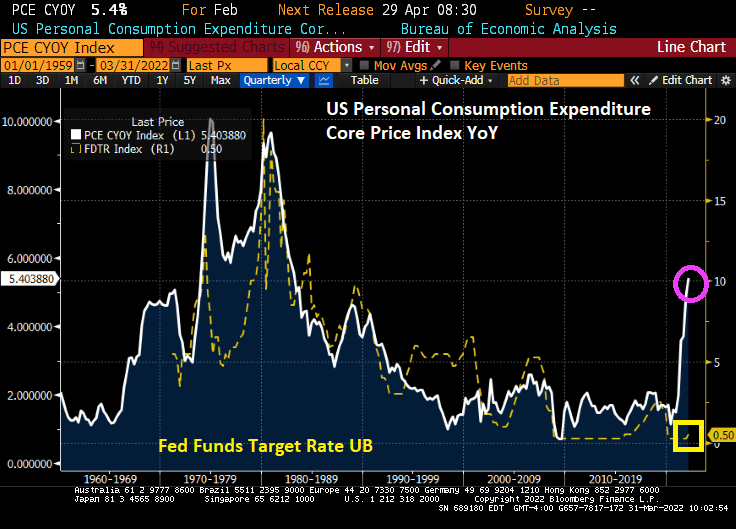
February’s Core Personal Consumption Expenditures (PCE) price YoY grew to 5.4%, the highest since 1983. The spread between the PCE Core Deflator and The Fed Funds Target Rate (upper bound)
In terms of the spread, it is the highest since the 1970s.
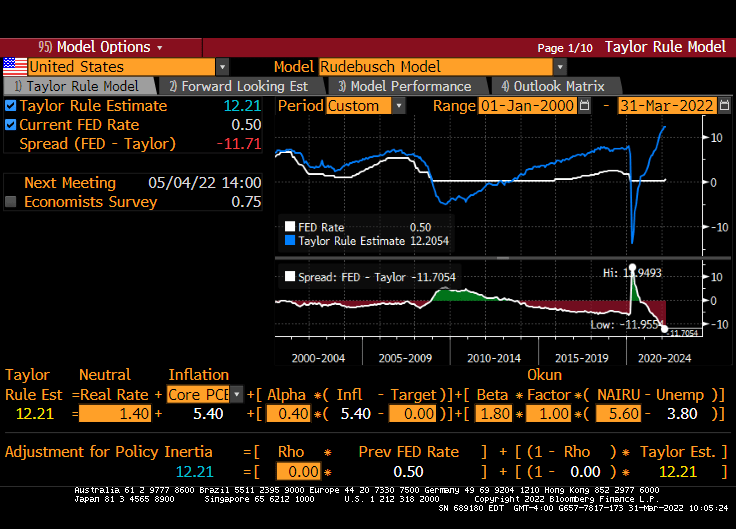
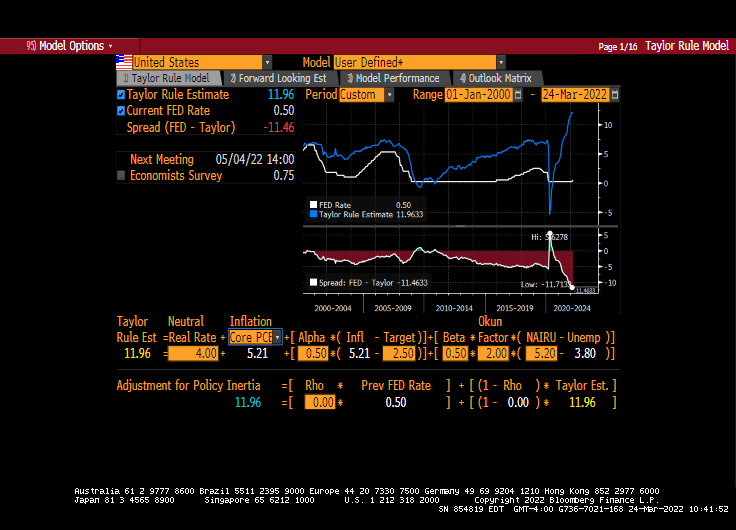
The Taylor Rule (which Jerome Powell probably thinks is the New Jersey breakfast meat “Taylor Ham”) indicates that The Fed’s target rate should be 12.21%. This is using the Rudebusch specification of the Taylor Rule.
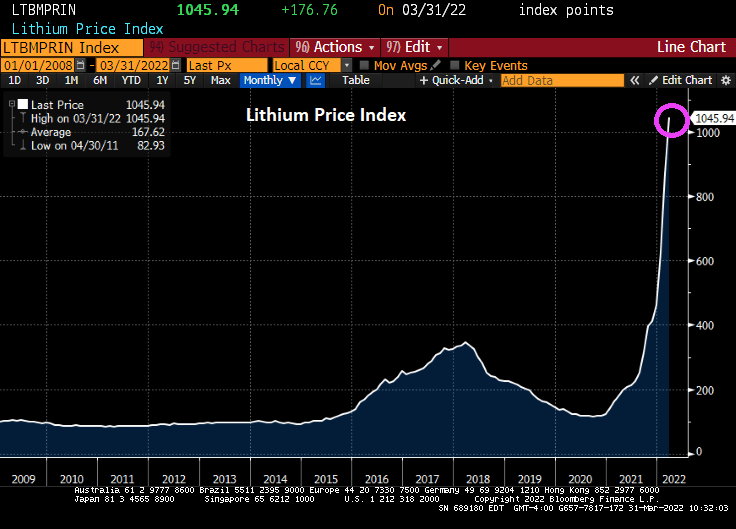
Now that the Biden Administration is going gangbusters on building electric cars, lithium prices are going through the roof.
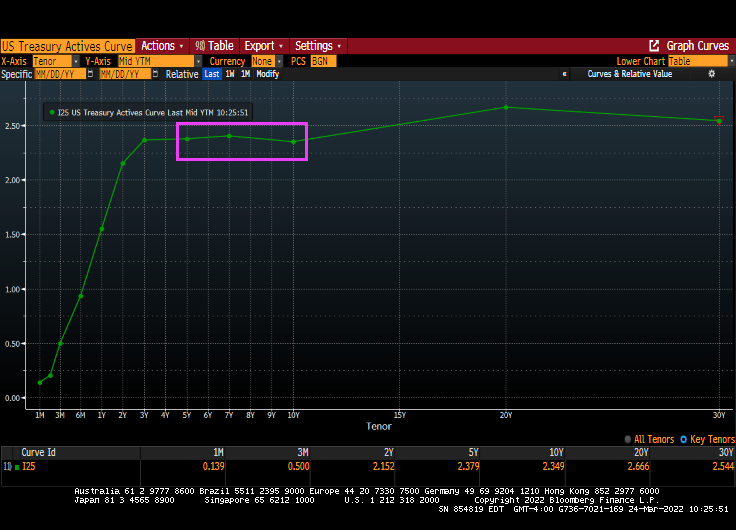
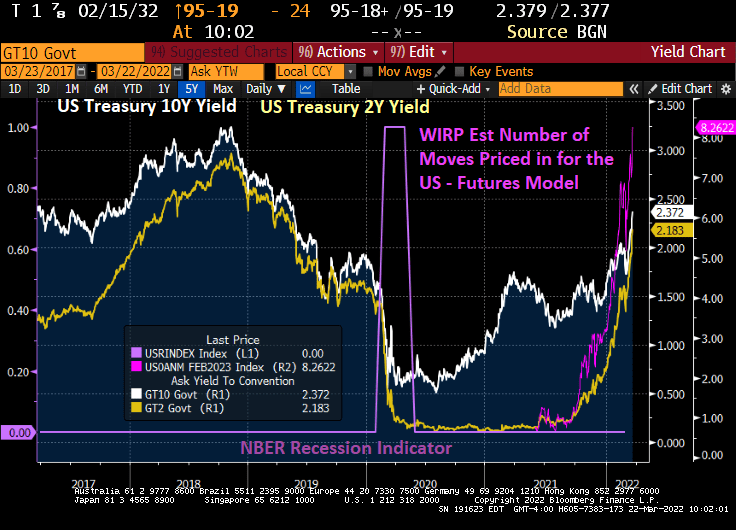
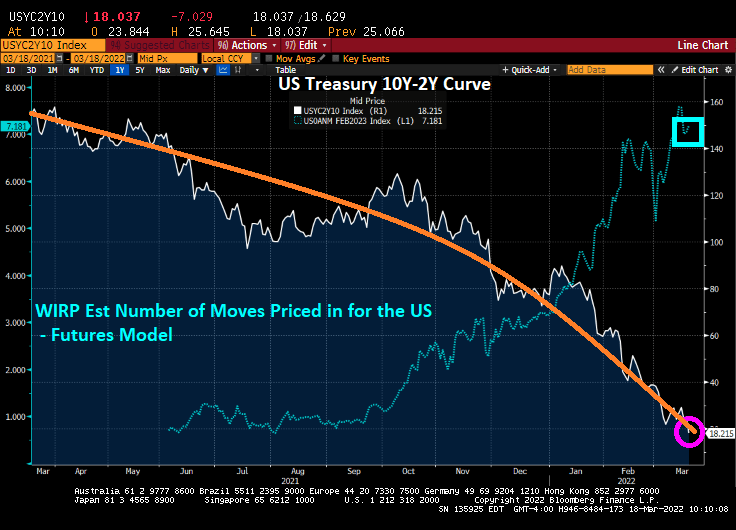
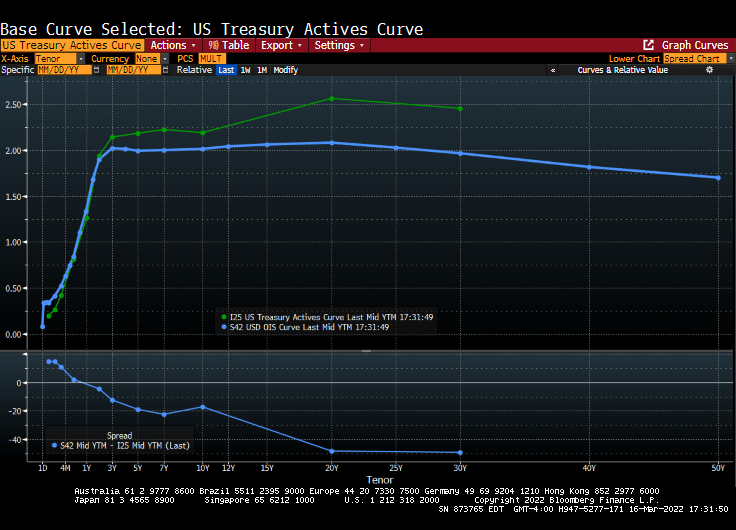
The US Treasury yield curve (10Y-2Y) is rapidly approaching inversion at 20.5 bps (where the 10-year yield is lower than the 2-year yield). But the 10Y-3M curve is generally steepening at 173.33 bps.
Of course, the driving force behind the flattening of the 10Y-2Y curve is the rapidly rising 2-year Treasury yield (orange line). The last time the 10Y-2Y curve inverted was in 2019, prior to the COVID outbreak in early 2020.
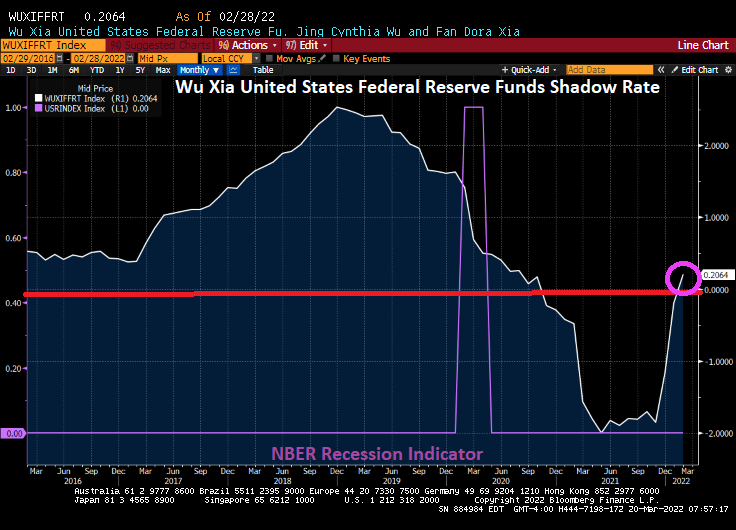
The Wu Xia United States Federal Reserve Funds Shadow Rate has finally climbed back into positive territory.
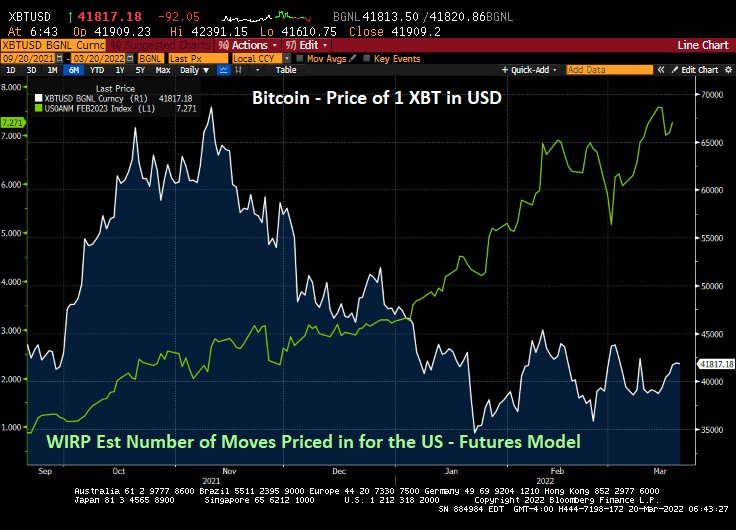
At last look, The Federal Reserve is forecast to raise their target rate 7 times over the coming year. And with the increasing forecast of rate hikes, we are seeing the cryptocurrency Bitcoin fall from near $70,000 to $41,817.
President Biden announced that he will be issuing an executive order to combat rising energy prices (the rising energy prices that he caused in the first place with … executive orders). Let’s see what happens next.
The news just keeps getting worse and worse. Russia is still assaulting Ukraine, WTI Crude prices are above $100 a barrel and climbing, the Cleveland Browns signed Deshaun Watson to replace Baker Mayfield at quarterback, etc.
But back to energy prices. Since Biden was sworn-in as President, WTI Crude Oil futures are up 125%, regular gasoline prices are up 89%, and diesel fuel prices are up 155%. Diesel is important since America uses diesel-powered trucks to transport goods to market.
Globally? The world inflation rate has grown from 2% in January 2021 to 6.82%. Global food prices are up 24%.
Yes, WTI Crude and Brent Crude are above $100 per barrel.
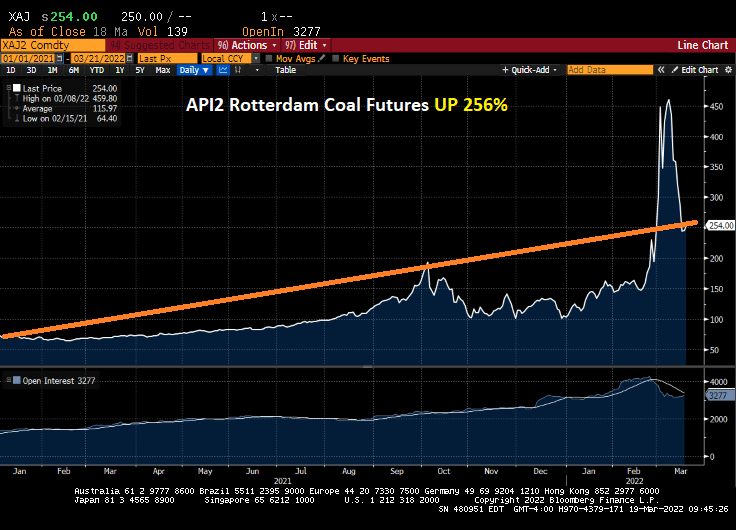
And coal prices are up 256% under Shoeless Brainless Joe.
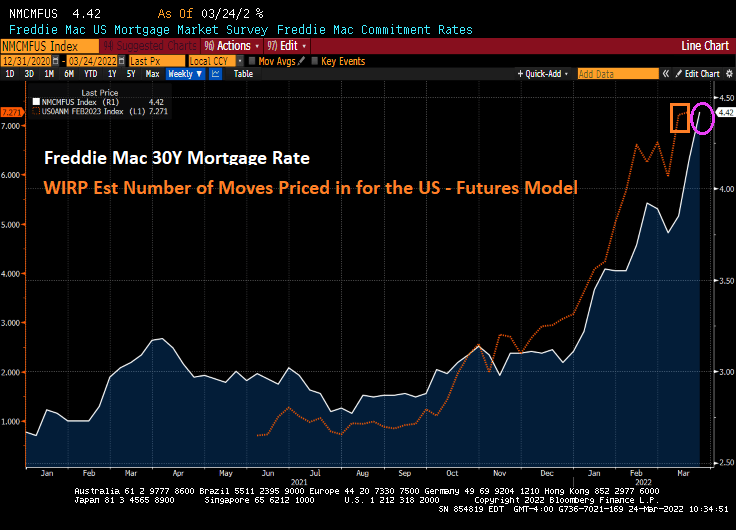
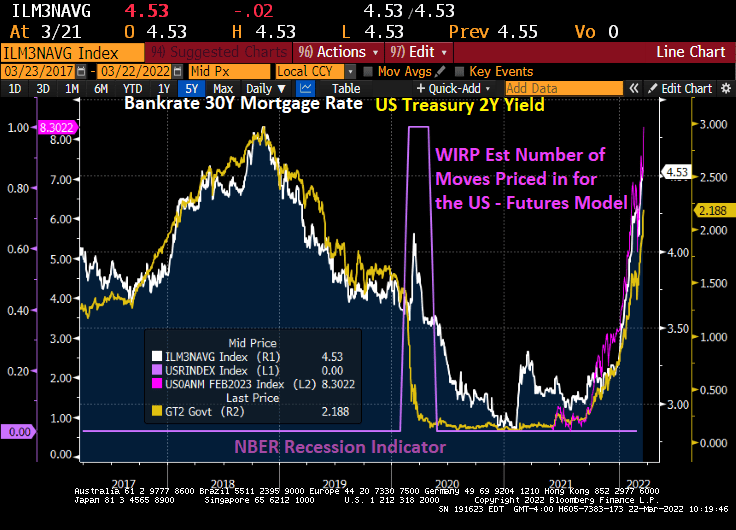
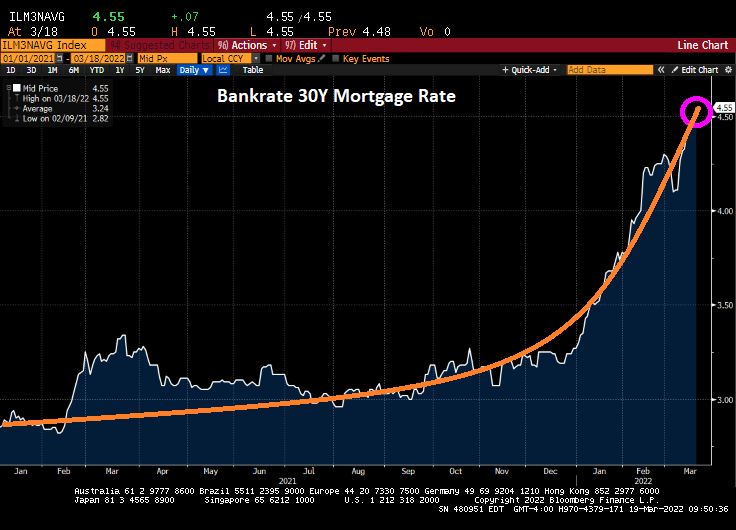
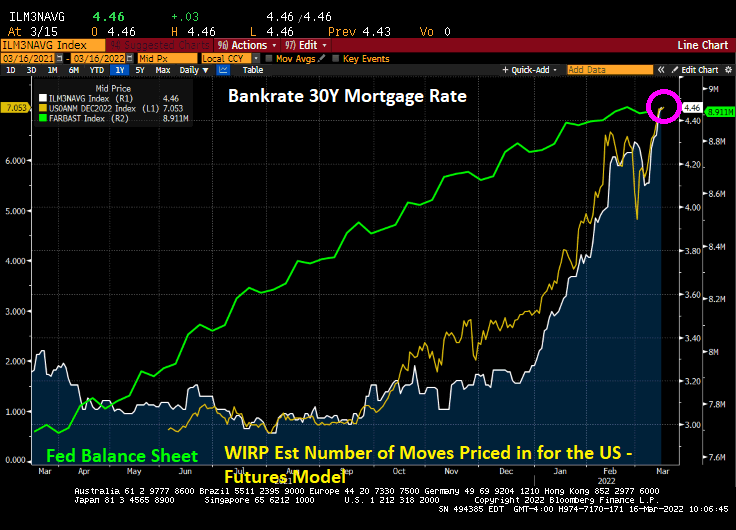
Mortgage rates? Bankrate’s 30-year mortgage rate is now above 4.50%.
Let’s see if Dr. StrangeFedpolicy raises rates as aggressively as signaled.
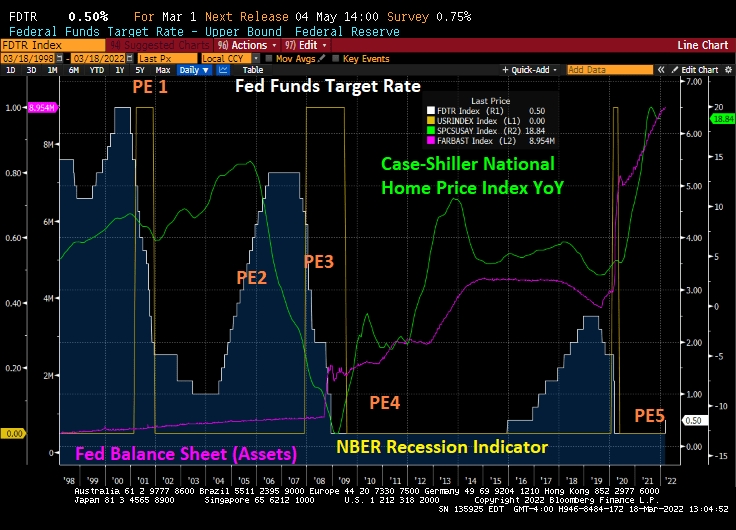
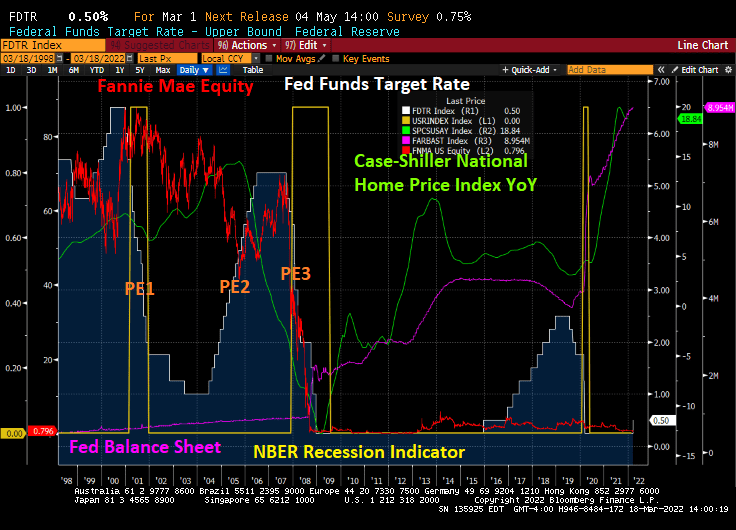
The Federal Reserve is not mentioned in the movies “The Big Short” or “Margin Call”, but The Fed’s policy errors played a big role in the demise of Fannie Mae’s and Freddie Mac’s equity prices.
Here is a chart of The Fed’s many policies errors. Let’s start with The Fed lowering rates too fast around the 2001 recession. They pushed their target rate from 6.5% in December 2000 down to 1.75% after one year and then down to 1% (PE1). As home price growth accelerated, The Fed engaged in their second policy error — raising rates too fast resulting in a dramatic cooling of home price growth. Then came Policy Error 3: the dropping of The Fed Funds Target rate from 5.25% in September 2007 to an eventual 0.25% in December 2008.
With the election of President Obama, The Fed engaged in Policy Error 4: keeping The Fed Funds Target rate too low for too long, combined with their massive asset purchase programs (QE).
Finally, The Fed (under Yellen) finally raised The Fed’s target rate ONCE under Obama, but started raising rates once Trump was elected. The Fed also slowed their QE under Trump which as called “Fed policy NORMALIZATION.” Then COVID struck and The Fed engaged in Policy Error 5: keeping rates too low for too long … again while massively expanding their balance sheet.
Fannie Mae and Freddie Mac, the DC mortgage giants were done in by The Fed’s whipsaw Policy Error machine.
Now we are embarking on PE 5: Powell and The Fed Gang not raising rates but signalling that they will. Like the play “Waiting for Godot.”
“The data is basically screaming at us to go 50 but the geopolitical events were telling you to go forward with caution. So those two factors combined pushed me” to support the 25 basis points increase, he said. “Going forward that will be an issue whether to think about going 50 in the next couple of meetings or not. But the data certainly seem to suggest that we move in that direction.”
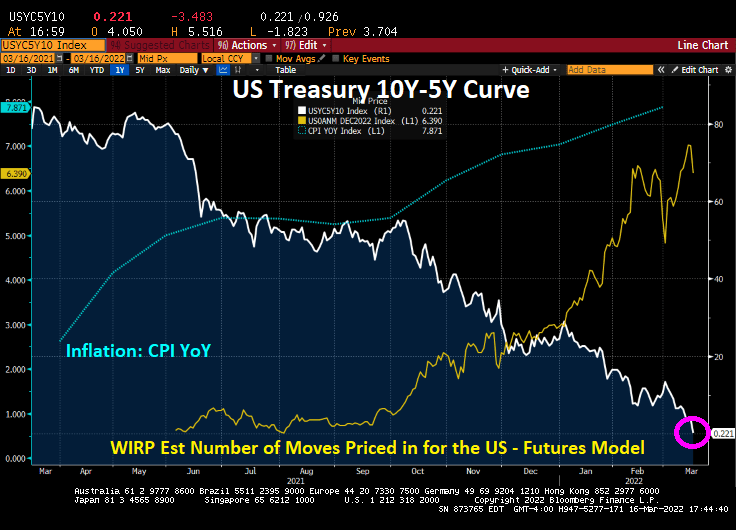
WIRP is pricing in over 7 rate increases by February 2023 as the Treasury yield curve (10Y-2Y)
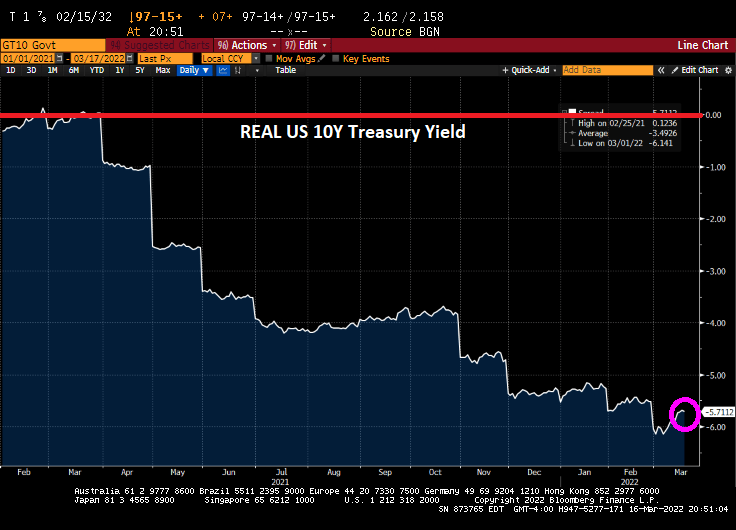
Well, Powell and The Fed Gang failed to tackle inflation with its 25 basis point increase in their target rate. The result? Inflation is still roaring and REAL Treasury yields remain NEGATIVE (nominal Treasury yields – inflation).
In fact, the US Treasury 10-year yield hovering around 0% when Biden first became President, then the inflation kraken was unleashed leading to progressively declining 10-year Treasury yields. As on late night, the REAL 10-year Treasury yield is -5.71%.
REAL mortgage rates (Bankrate 30Y rate – inflation) were positive at the beginning of the Biden Administration, but have sunk to -3.40%.
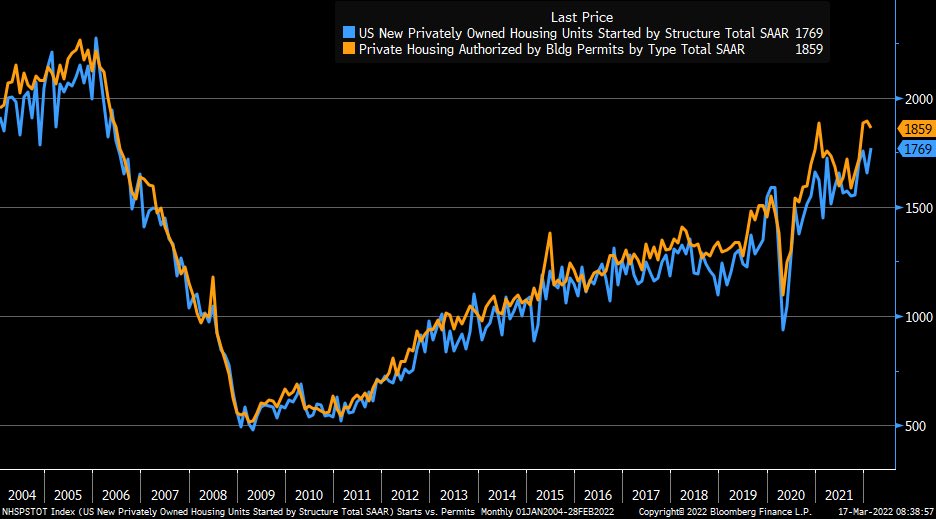
With negative REAL mortgage rates (and continued Fed Stimulypto), we saw February housing starts rise 6.8% in February.
The Fed is apparently jittery about Russia invading Ukraine (mentioned in The Fed minutes) as well as the possibility of China invading Taiwan (NOT mentioned in The Fed minutes).
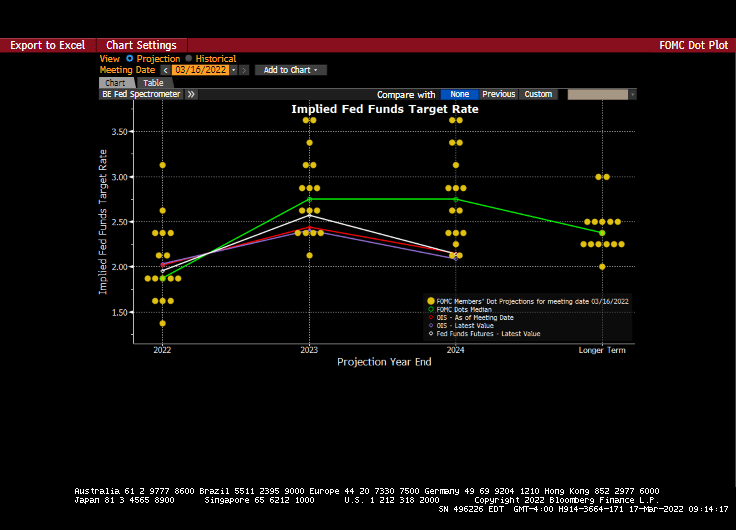
But if we look at the Fed DOTS plot, we see a rise in The Fed Funds Target rate in 2022 (7 rate hikes), more rate hikes in 2023 and 2024 and then a slowing in the longer term (as if voting members have a clue about the long-run economy).
The WIRP (Fed Funds Futures) is signalling 7 MORE rate increases over the coming year.
Biden is relying on Powell And The Fed Gang to provide ample liquidity in the markets, particularly before the midterm elections in November (hint: Biden doesn’t want Powell to rock the boat).
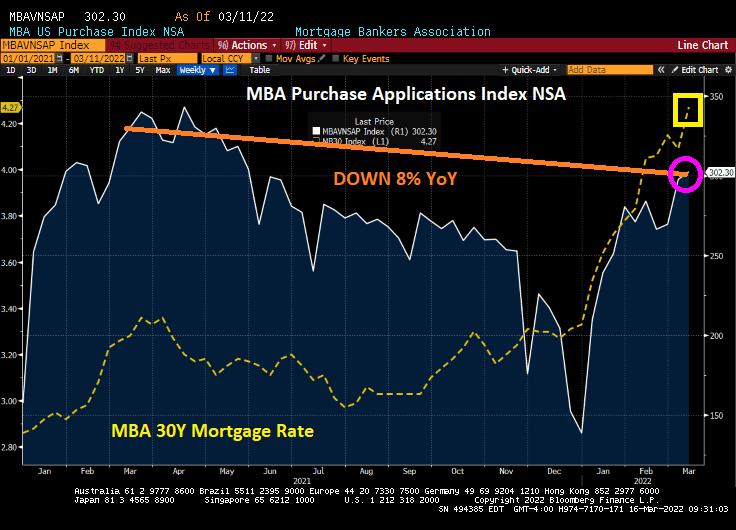
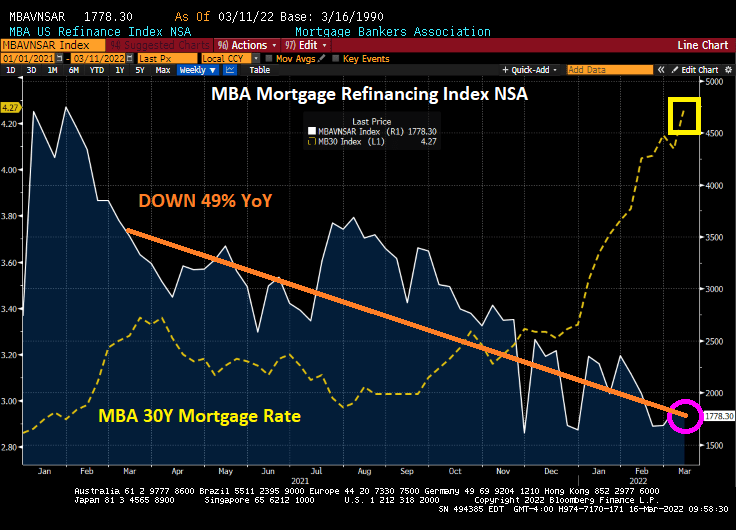
Mortgage applications decreased 1.2 percent from one week earlier, according to data from the Mortgage Bankers Association’s (MBA) Weekly Mortgage Applications Survey for the week ending March 11, 2022.
The seasonally adjusted Purchase Index increased 1 percent from one week earlier. The unadjusted Purchase Index increased 2 percent compared with the previous week and was 8 percent lower than the same week one year ago.
The Refinance Index decreased 3 percent from the previous week and was 49 percent lower than the same week one year ago.
Bankrate’s 30-year mortgage rate has surged to 4.46%.
Here is a photo of alligators in Great Falls, Virginia, up-river from Washington DC. They are likely congregating for the Fed Open Market Committee (FOMC) announcement today.


You must be logged in to post a comment.