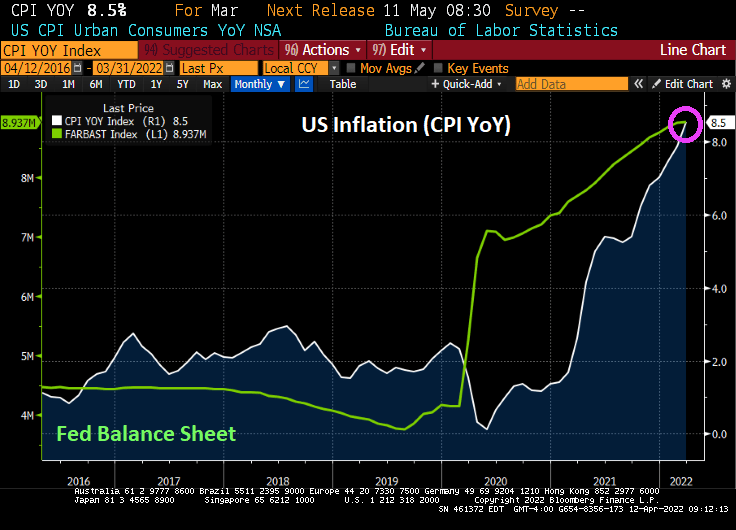
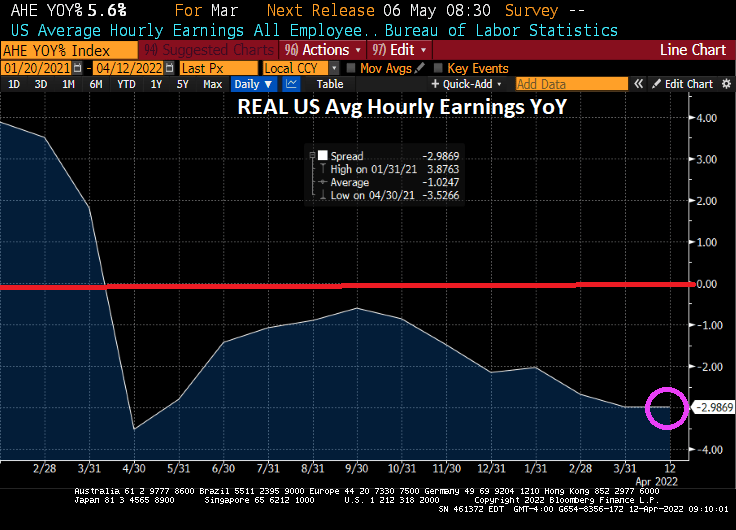
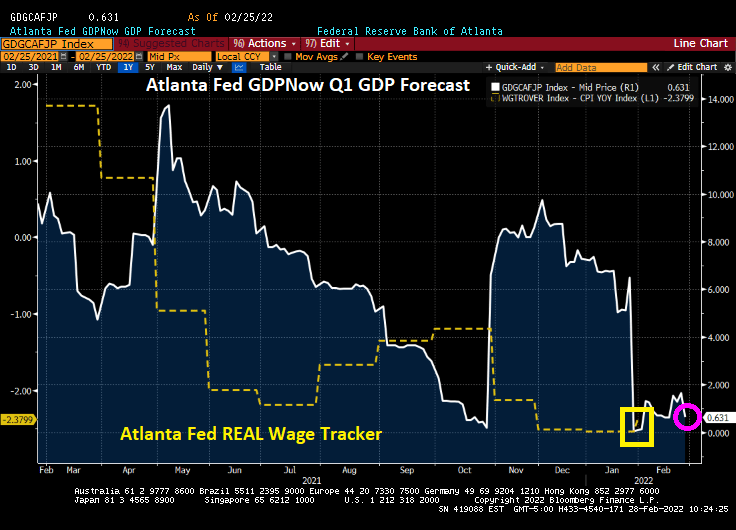
With 8.5% YoY inflation, REAL average hourly earnings growth fell to -3% YoY.
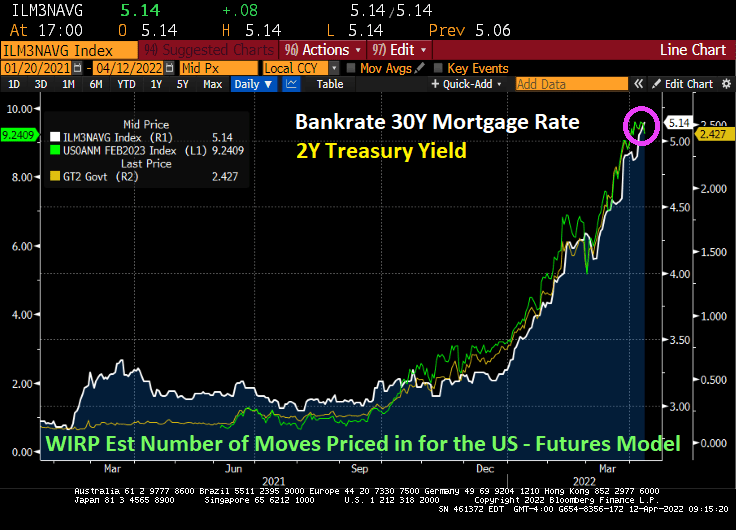
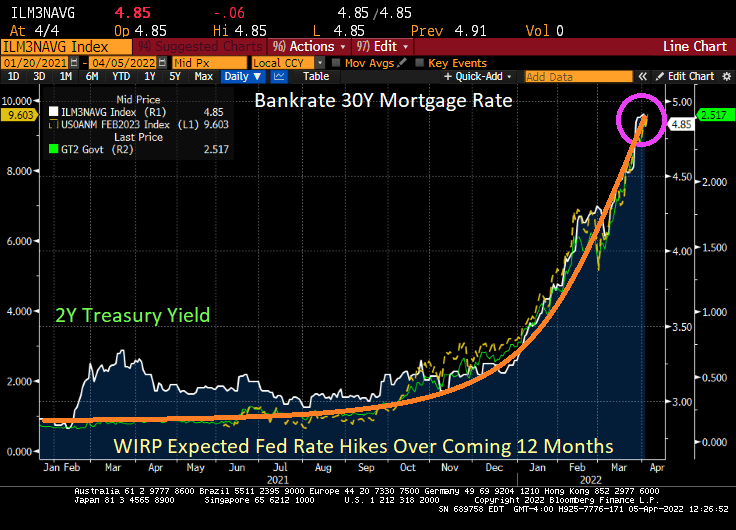
And with The Fed intent on extinguishing their part of the inflation, Bankrate’s 30Y mortgage rate rose to 5.14%.
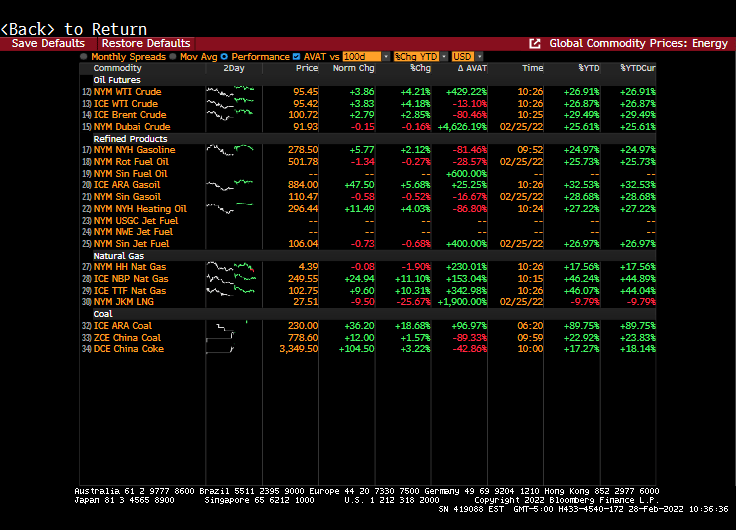
Energy is the biggest culprit (fuel oil up 70.1% YoY) thanks to the double whammy of 1) Russia’s invasion of Ukraine and 2) Biden’s restrictions on oil and natural gas production. Food at home is up 10% YoY.
Here is a colorful chart of MoM growth in prices.
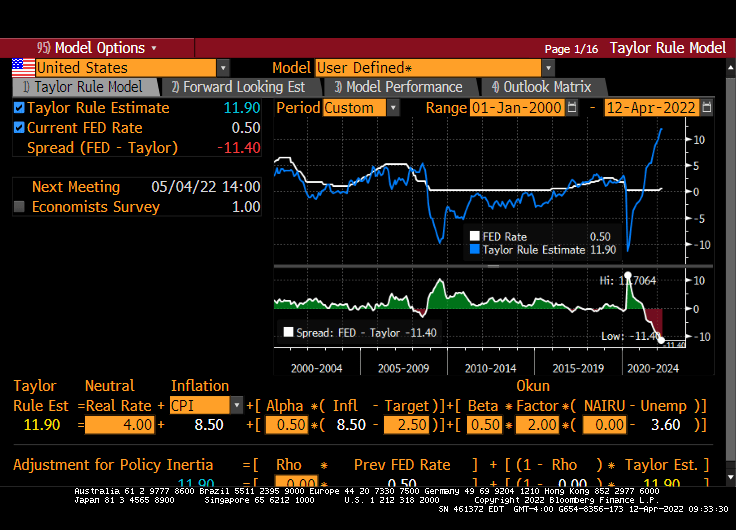
The Taylor Rule model now says that The Fed Funds Target Rate should be 11.90%. Hence, Fed Stimulypto is still in place with the signal that rates will increase.
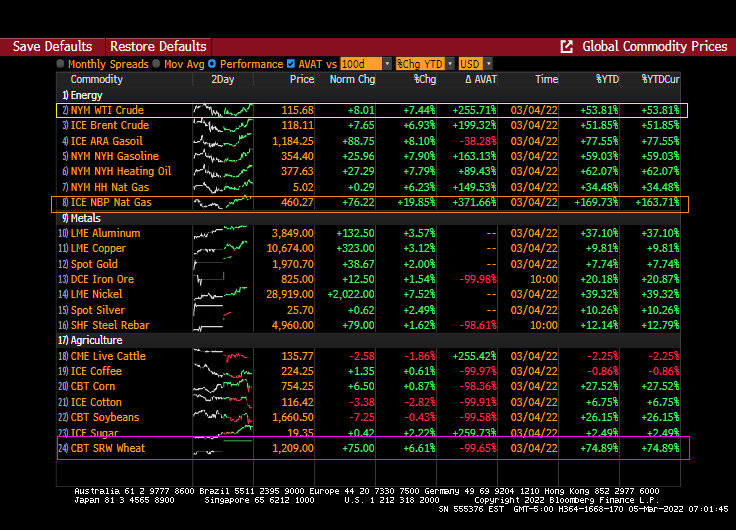
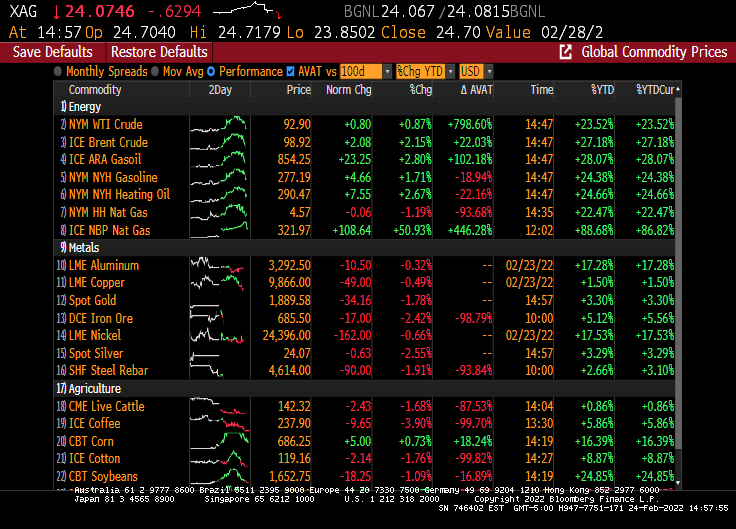
How about WTI Crude and Brent Crude soaring over 4% today?
Once again, the Four Horsemen of the Inflation Apocalypse (Biden, Powell, Pelosi, Schumer) overstimulated the economy and financial markets with excessive monetary stimulus (Powell) and excessive Federal spending (Biden, Pelosi, Schumer) where demand soared for products and supply naturally hasn’t caught up.
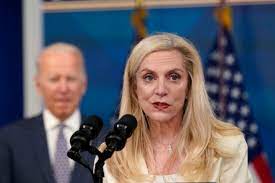
Federal Reserve Governor Lael Brainard said the U.S. central bank will continue to tighten policy methodically and shrink its balance sheet at a rapid pace as soon as May.
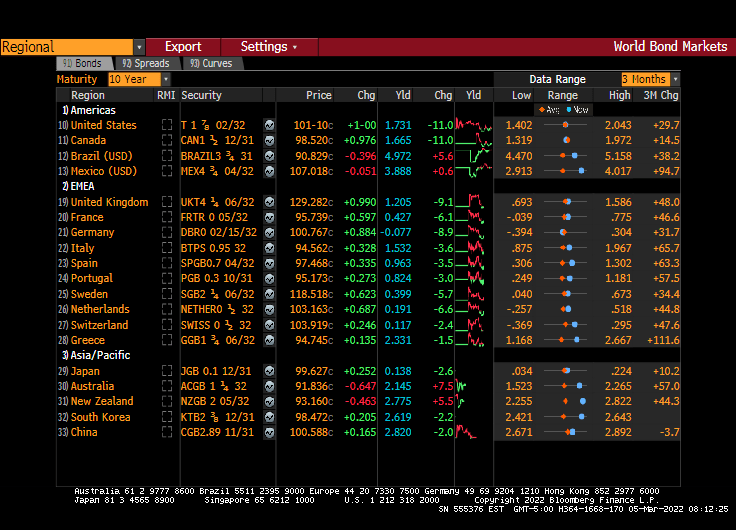
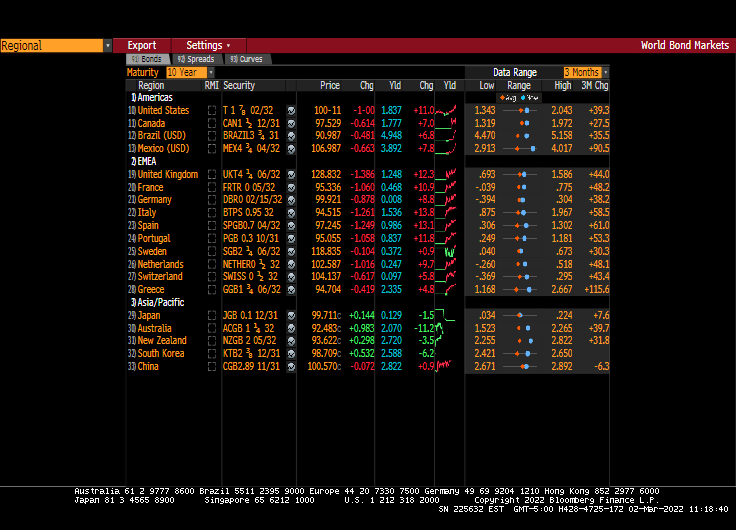
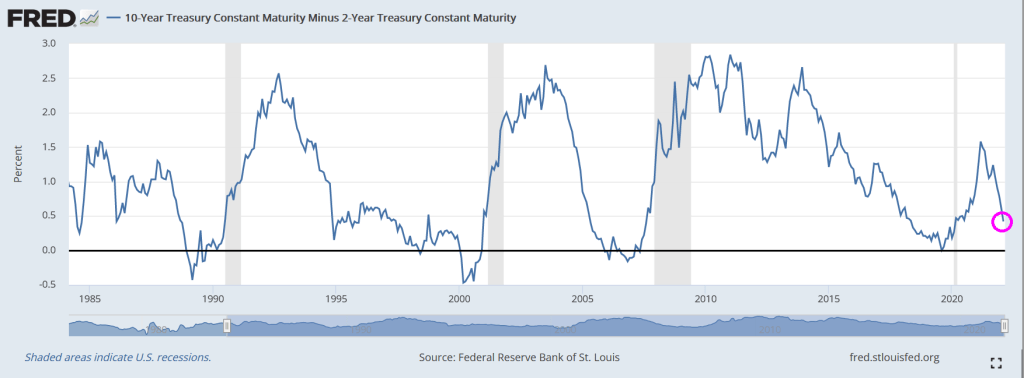
Brainard’s hawkish remarks sent bond prices crashing and 10Y bond yields up over 16 bps.
While Bankrate’s 30Y mortgage rate is down slightly today, the surge in the 10Y and 2Y Treasury yields could push mortgage rates above 5% by tomorrow,
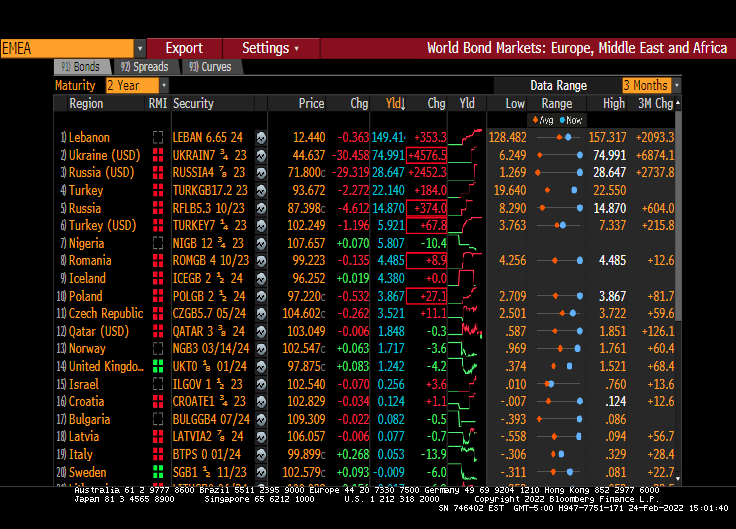
Even Europe is feeling Brainard’s wrath. Italian 10Y sovereign yields are up almost 20 bps.
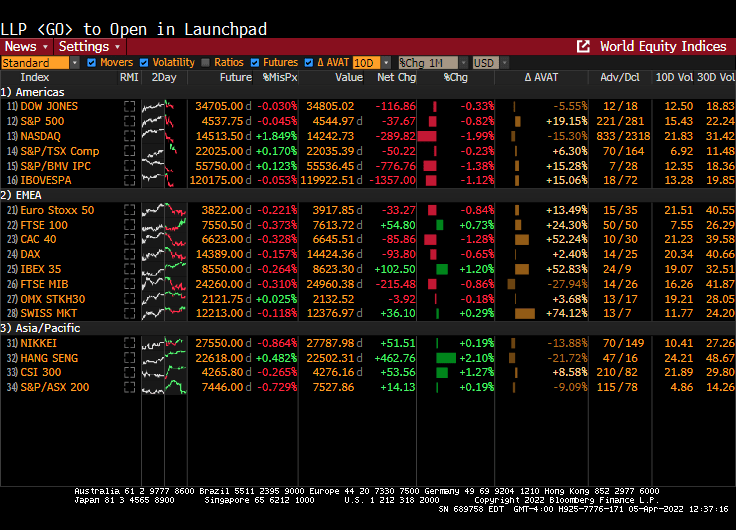
The NASDAQ index is down 300 points on Brainard’s utterance.
Gee thanks Lael from all us wanting to finance the purchase of a house.
The news just keeps getting worse and worse. Russia is still assaulting Ukraine, WTI Crude prices are above $100 a barrel and climbing, the Cleveland Browns signed Deshaun Watson to replace Baker Mayfield at quarterback, etc.
But back to energy prices. Since Biden was sworn-in as President, WTI Crude Oil futures are up 125%, regular gasoline prices are up 89%, and diesel fuel prices are up 155%. Diesel is important since America uses diesel-powered trucks to transport goods to market.
Globally? The world inflation rate has grown from 2% in January 2021 to 6.82%. Global food prices are up 24%.
Yes, WTI Crude and Brent Crude are above $100 per barrel.
And coal prices are up 256% under Shoeless Brainless Joe.
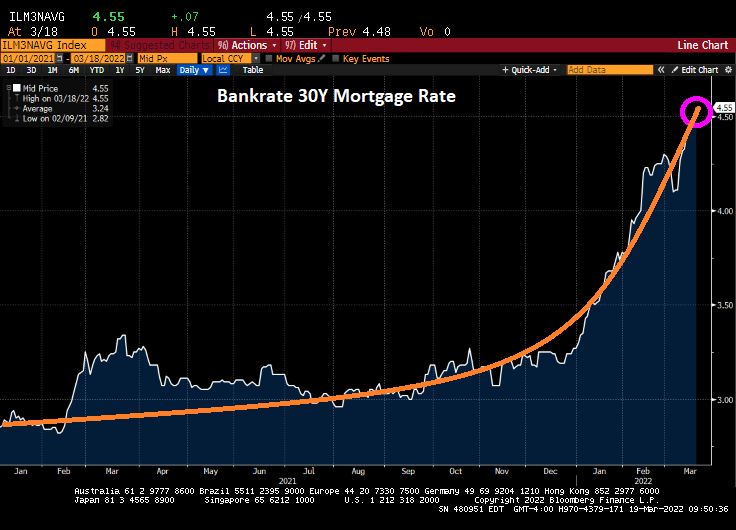
Mortgage rates? Bankrate’s 30-year mortgage rate is now above 4.50%.
Let’s see if Dr. StrangeFedpolicy raises rates as aggressively as signaled.
US Speaker of the House and American Oligarch Nancy Pelosi together with Senate Majority Oligarch Charles Schumer passed yet another massive spending bill that seemingly benefited them and not the American middle class.
This legislation would provide $774.4 million for the Members Representational Allowance, known as the MRA, which funds the House office budgets for lawmakers, including staffer salaries. This $134.4 million, or 21 percent, boost over the previous fiscal year marks the largest increase in the MRA appropriation since it was authorized in 1996, according to a bill summary by the House Appropriations Committee. For paid interns in member and leadership offices, the House would get $18.2 million.
This is especially unfortunate given at inflation is growing at 7.9%. If we remove food and energy (two important categories for consumers and retirees), core inflation is growing at 6.4% YoY. As such, Social Security COLA doesn’t even keep pace with CORE inflation, let alone food and energy costs.
In August, Speaker Nancy Pelosi announced staffers’ salaries could exceed those of lawmakers. Members in both the House and Senate, with the exception of leadership, make an annual salary of $174,000. Staffers can make up to $199,300.
After an 11-year drought, congressional earmarks are back with vengeance.
The $1.5 trillion, 2,741-page omnibus spending package is loaded with funding for lawmaker pet projects, some of which could help incumbents in this fall’s elections.
The legislation includes more than 4,000 earmarks, according to a list of projects provided to The Hill by a Senate Republican aide that spanned 367 pages.
One of the biggest winners was New York — thanks to Senate Majority Leader Charles Schumer (D-N.Y.), who is up for reelection this year.
Schumer’s name is attached to 59 earmarks totaling nearly $80 million in the omnibus’s transportation and housing and urban development (HUD) section alone, according to a review by The Hill. He successfully requested funding for the projects either individually or with other lawmakers from his home state.
Is wild-spending Pelosi actually “The Bride of Chucky (Schumer)”?
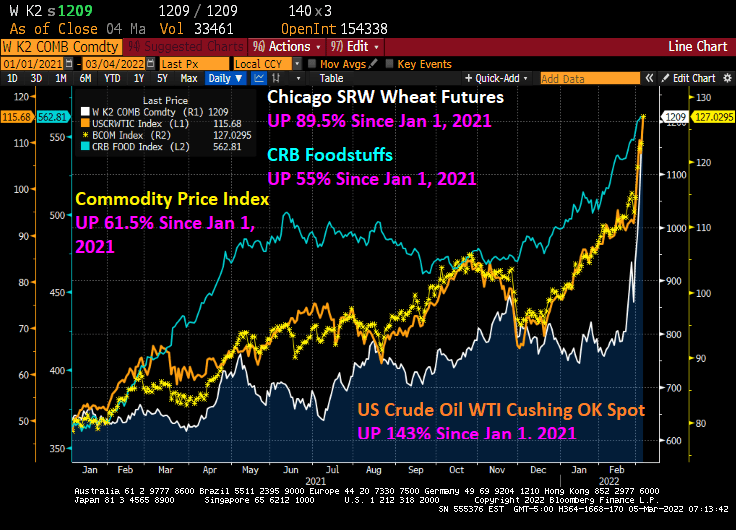
This has been a brutal week for consumers. With the Russia/Ukraine conflict raging and Congress seems determined to not allow for additional oil and gas production, and Biden’s anti-fossil fuel edicts still in place, we are seeing dramatic price increases in wheat (UP 89.5% since January 1, 2021), WTI Crude (UP 143% since January 1, 2021), and food stuffs (UP 55% since January 1, 2021).
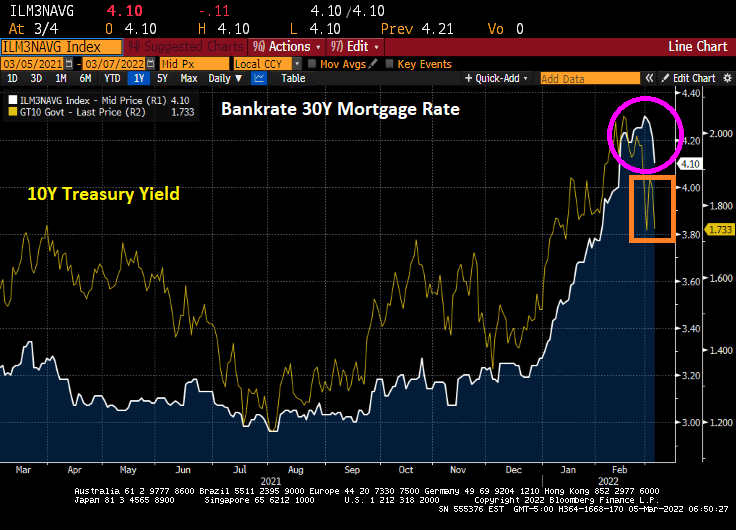
Bankrate’s 30-year mortgage rate has actually been falling the last several days, which is good for prospective home buyers as the 10-year US Treasury Note yield has been declining.
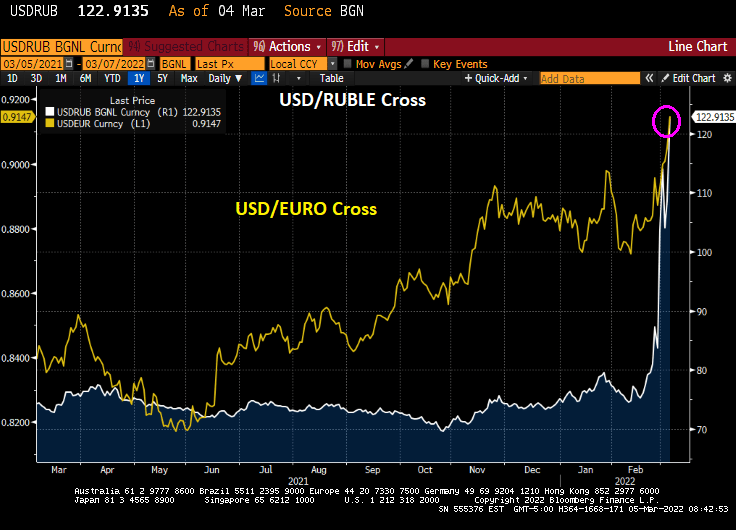
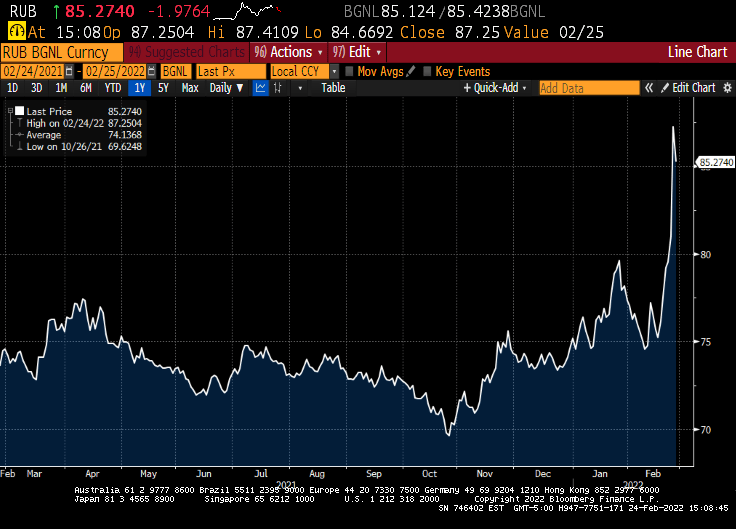
The USD/Russian Ruble cross is skyrocketing and the USD/Euro is doing likewise. Russians visiting the US will find that their trip is suddenly unaffordable (as do many American citizens will its rampant inflation). As Bruce Willis said in “Die Hard,” “Welcome to the party, pal.”
On Friday, the US Treasury 10-year yield declined 11 bps.
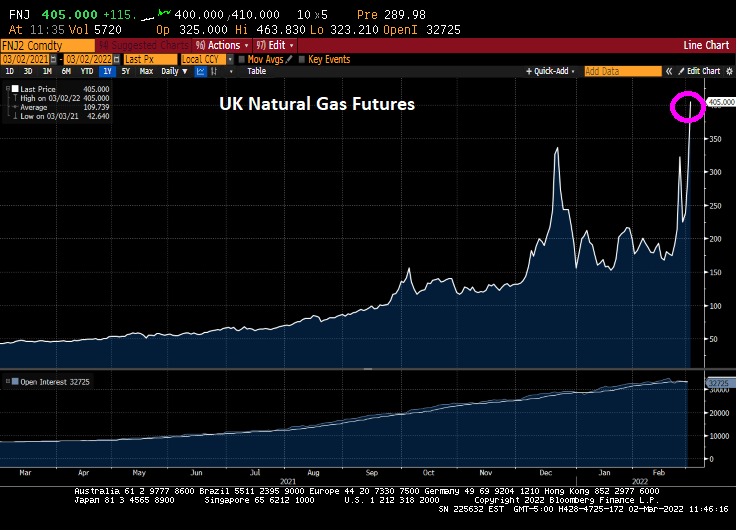
And energy prices continue to soar, particularly UK Natural Gas Futures that rose 19.85% overnight.
The US inflation data will be released on March 10th and the consensus is that February CPI inflation will rise to 7.9% YoY.
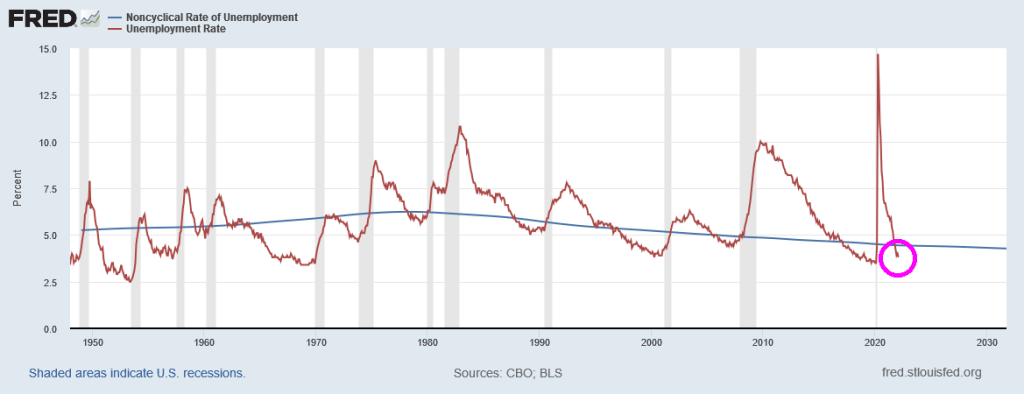
But even the latest unemployment rate report (3.8%) is signalling that The Fed should be raising interest rates since it is lower than the Natural Rate of Unemployment or NAIRU (4.44%).
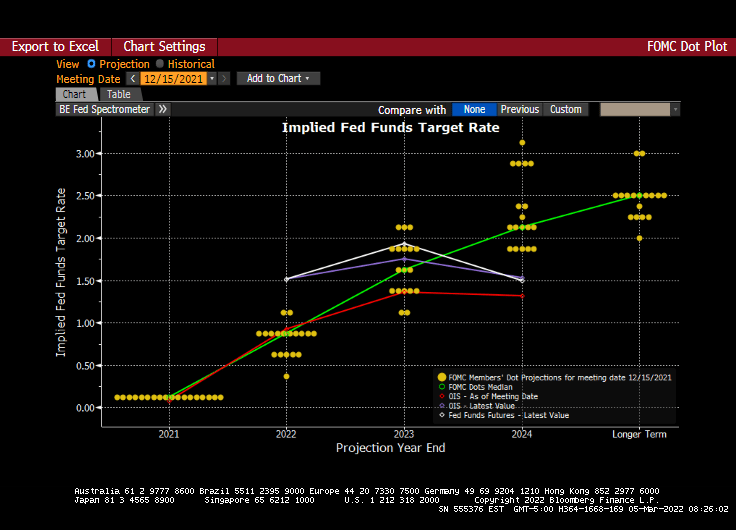
And we have the next Fed policy error on March 16th. The Fed dots plot looks like the glide slope for an aircraft, but the message is that rates will be going up at future meetings.
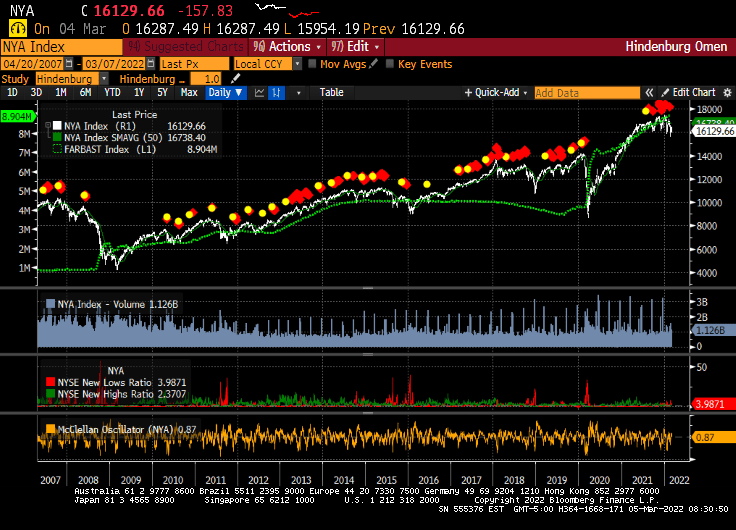
And just for amusement, I present to you the infamous Hindenburg Omen chart that forecast the 2008/2009 stock market correction. Since that correction, the Hindenburg Omen has been flashing “danger” but the only correction was the COVID-linked correction of early 2020. While the Hindenburg Omen is flashing red right now, The Federal Reserve’s balance sheet (green line) has protected against market corrections. Let’s see what happens if and when The Fed decides to remove the epic monetary stimulus.
Its anyone’s guess as to whether The Fed will actually tighten monetary policy.
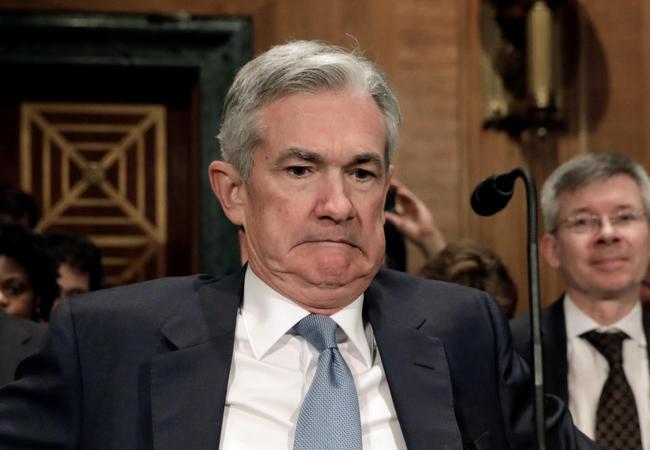
Stocks rose, while bonds fell after Jerome Powell said he was inclined to back a quarter-point U.S. rate hike in March to combat inflation that is “too high.”
In a broad-based equity rally, financial and industrial companies led gains in the S&P 500. The two-year Treasury yield — which is more sensitive to imminent Federal Reserve policy moves — was near 1.5%. The Fed chief also noted that the central bank is prepared to be more aggressive if inflation is more persistent than expected, while adding that he’s open to “series of rate increases” in 2022. Investors also assessed the latest geopolitical developments, with oil paring gains after earlier topping $110 a barrel.
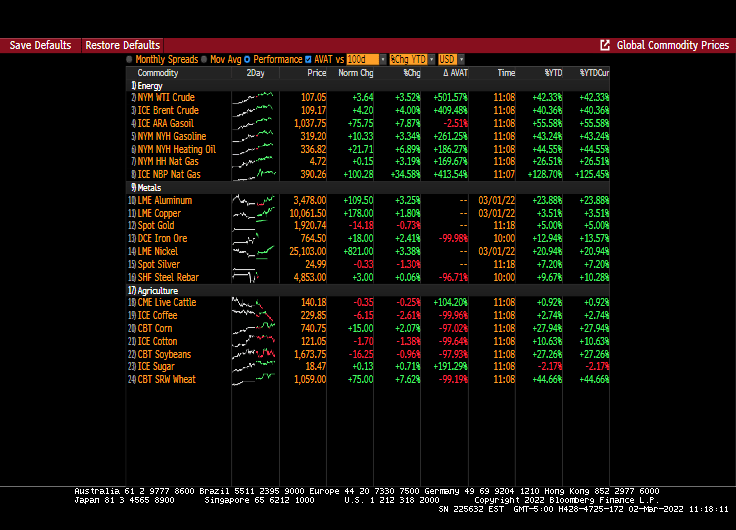
WTI Crude futures are up to $107.05 a barrel.
Natural Gas (UK) rose 34.58% to 100.28. Wheat is 7.62% to $1,059.
The 10-year Treasury yield jumped 11 Basis Points on Powell’s comments. And Eurozone yield are up nearly the same amount.
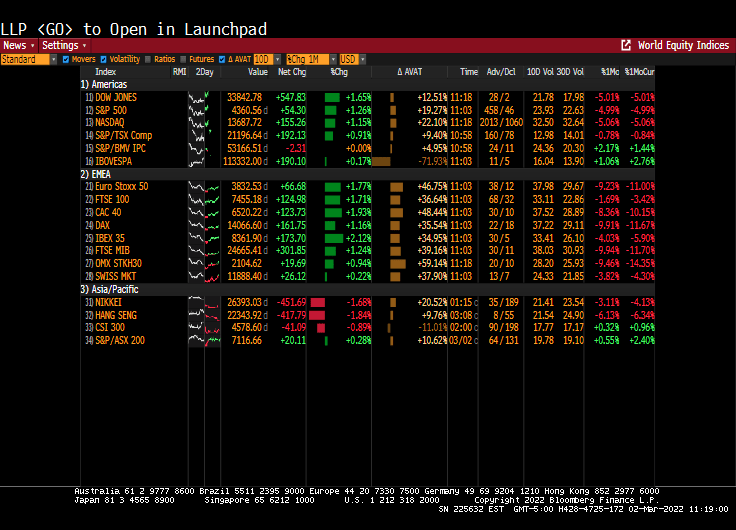
Powell signalling a more moderate rate expansion led to the Dow rising over 500 points (up 1.65%).
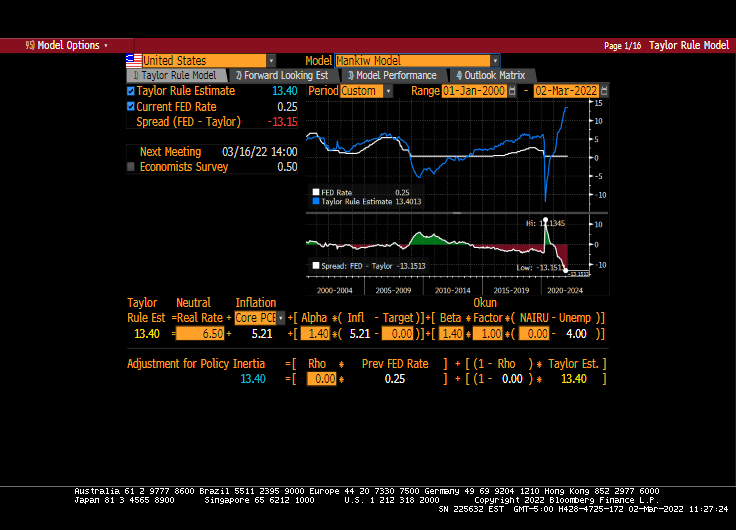
Based on core PCE growth of 5.21%, the Mankiw specification of the Taylor Rule model infers that The Fed Funds Target rate should be … 13.40%. Since The Fed’s target rate is only 25 basis points, a 25 basis point increase is modest indeed.
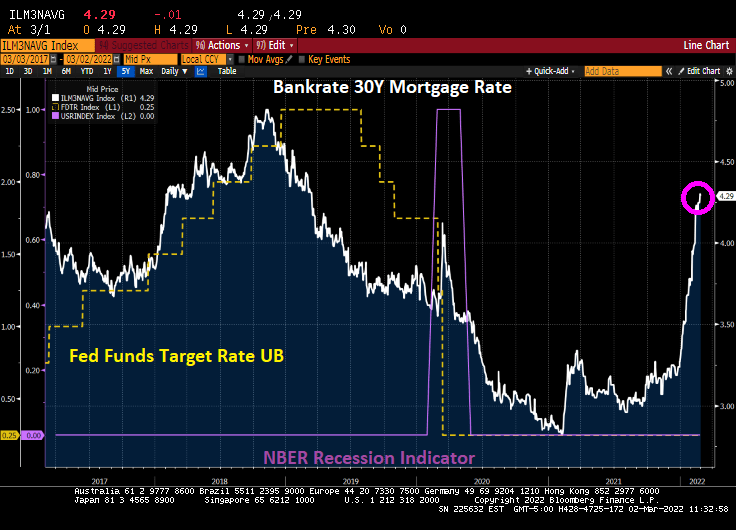
Mortgage rates are down slightly today, but you can see the separation between The Fed’s target rate and the 30-year mortgage rate.
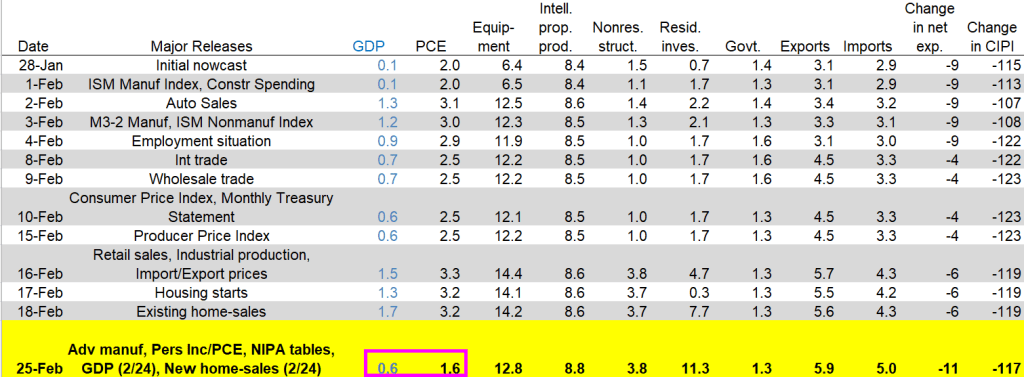
The U.S. merchandise-trade deficit unexpectedly widened in January to an all-time high, reflecting a record value of imports and a drop in shipments overseas.
The shortfall grew to $107.6 billion last month from $100.5 billion in December, according to Commerce Department data released Monday.
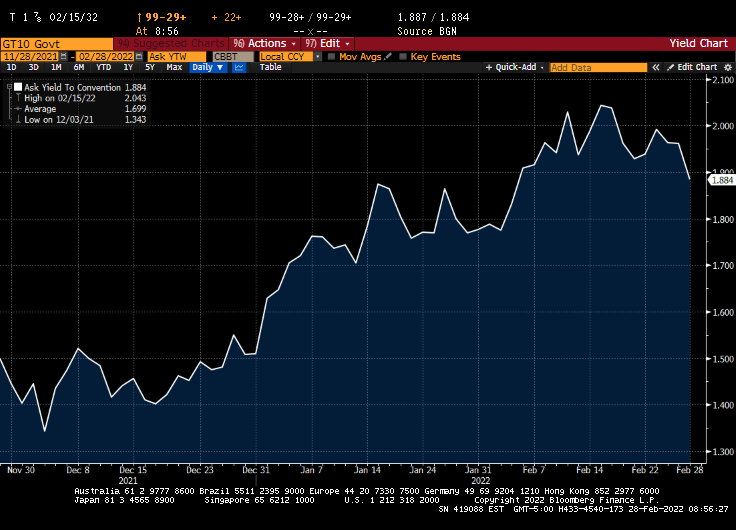
Meanwhile, the US Treasury 10Y yield fell to 1.884%.
The cost for shipping from the US to China has surged.
Meanwhile, the Russian Ruble is getting clobbered.
At least Putin hasn’t put himself on Russian currency … yet. Or nyet.
Russia is still attacking Ukraine and I am still seeing stories about actor/comedian Bob Saget’s cause of death. So now for something completely different.
We now know that Russia has invaded Ukraine and President Biden really threw the booklet at Putin in a speech today. Rather than removing Russia from the SWIFT banking system which would have really hurt Russia’s trade with Europe, he gave a surprisingly cogent speech about the US and NATO agreeing to do … not much. He did warn us that energy prices would rise (which he helped do when he took office) and told energy companies not to gauge consumers.
The reaction in Russia? Their stock market tanked over 30% (not because of Biden’s speech, but because of negative costs of war).
Russia’s 10-year sovereign yield rose to 15.23%.
The Russian Ruble crashed and burned.
UK natural gas prices rose 51% today.
And while 17 Euro nations have negative 2 year sovereign yields, Russia has 2-year sovereign yield of 28.65% which is nothing compared to Ukraine’s 75% 2-year yield (in US Dollars).
The SWIFT system, or Society for Worldwide Interbank Financial Telecommunication, facilitates financial transactions and money transfers for banks located around the world. The system is overseen by the National Bank of Belgium and enables transactions between more than 11,000 financial institutions in more than 200 countries around the world. Removing Russia from the SWIFT system would really hurt Russian trade with Europe. I assume that Europe is scared of soaring energy costs, so probably doesn’t want Russia removed from SWIFT.


You must be logged in to post a comment.