After The Munich Freezeout! King Charles Delivers Highly-Politicised Speech To Support Collectivist Net Zero Project

It came after the Munich freezeout where the private jets of global elites were snowed-in. But apparently most made it to Dubai for COP28. Or more apt, the Cop-out meeting where the global elites meet eating caviar and guzzling champagne and telling us to die off, eat bugs and drive idiotic EVs that most Americans can’t afford. (A $100,000 Ford F-150 Lightning??)

But at least we can hear England’s royalty, King Charles, bloviate about the weather. Along with American royalty, VP Kamala Harris and Climate Envoy John Kerry who committed the US to closing down out coal burning plants.

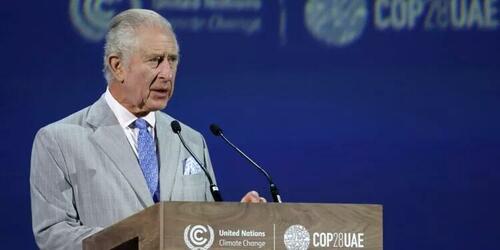
It could have been worse. King Charles could have ascended to his desert dais and pronounced that we had just 96 months to avert “irretrievable climate and ecosystem collapse”. But that was the Right Charlie back in 2009, giving us the benefit of his sandwich-board scientific wisdom. These days it is all fashionable bad weather and undefined “tipping points”. The man is now King, and at COP28 he threw away his irksome politically-neutral constitutional role, wrapped himself in Guardianista pseudoscience, and punched down hard on the poor who will be forced to pay for the collectivist madness that is the Net Zero project.
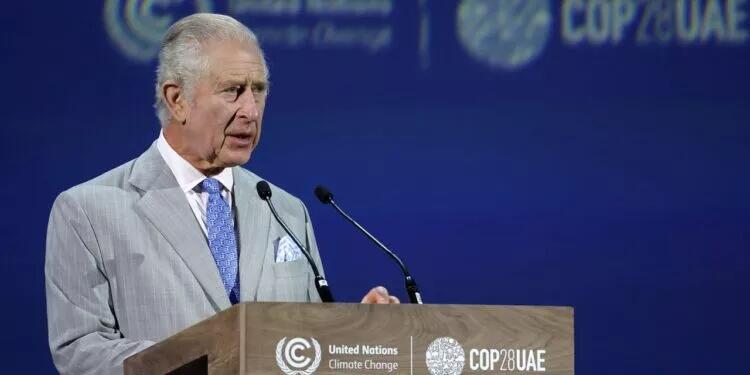
King Charles is no friend of general humanity. Speaking at COP28, he said: “The Earth does not belong to us, we belong to the Earth.” As with many know-your-place elitists, he appears to abhor the impacts that humans have on the planet. He exhibits, sadly on a world stage, a snobbish distain for capitalism – what used to be dismissed in British aristocratic circles as ‘trade’. This capitalist trend over the last 200 years has harnessed the power of natural hydrocarbons to raise billions to a standard of living and health unimaginable to previous generations. In 2009, Charles said we can no longer afford consumerism and the “age of convenience” was over.

Not for the new British King, it need hardly be observed. He lives a life of pampered indulgence where no expense is spared to ensure his every comfort. On his accession to the throne, he added considerably to his Palace Portfolio. To spread his malevolent Net Zero fantasies, he has a fleet of cars, private planes and even a personal train at his command. He uses these to call for “transformational action” to be taken to save the planet. In his COP28 speech, he called for the restoration of nature, the need for sustainable agriculture, and co-operation between the public and private sectors.

Few calls could be more political in tone. The restoration of nature and sustainable agriculture is shorthand for largely meat-free diets and massive reductions in nitrogen fertiliser. The latter, in particular, will lead to worldwide famine. COP28 seems set to announce new food and agriculture restrictions using the tactic of demonising methane, a gas emitted by animals and humans that is barely measurable in the atmosphere due to a very short lifecycle. Whenever the subject of ‘co-operation’ between public and private sectors is raised, there is an immediate dash to count the spoons, since it can only signal a large transfer of cash from productive industries to unproductive and inferior green operations.

At one point in his COP speech, King Charles veered into sandwich-board territory claiming that “we are seeing alarming tipping points being reached”. There was no evidence presented to justify this claim, often made by climate extremists using modelled data. In fact, he didn’t even refer to any actual ‘tipping’ event that has been reached. Many scientists have concluded that bad, or extreme, weather events are no worse than in the immediate past. Many categories of natural disasters such as floods, droughts and ecosystem productivity “show no clear positive trend of extreme events”, note a group of four Italian scientists. They argue that the data shows there is no “climate emergency”.

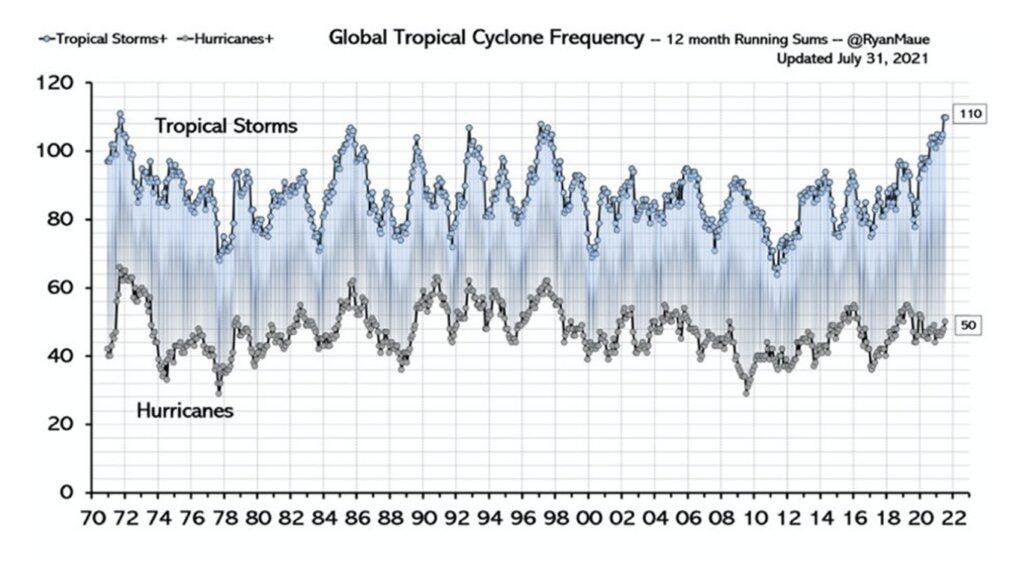
None of these facts seem to matter to a political King, who, like a stuck Guardian record, keeps on pressing on with made-up emotional stories of impending climate Armageddon. At one point he referred to repeated cyclones battering vulnerable islands, something that cyclones have always done.

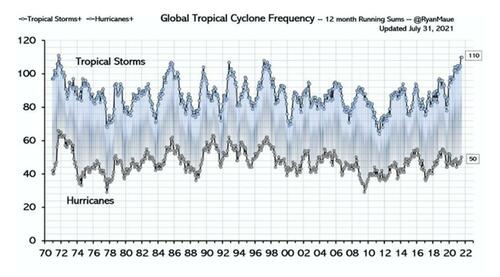
The King can always cherry-pick individual storms but there is plenty of evidence to show that hurricane and cyclone frequency, along with intensity, has changed little over the recent historical record, as the above graph shows. And The King demands that global taxpayers pay $5 trillion annually to prevent “climate catestrophy.” Easy for the billionaire King to say such nonsense.

Wildfires are a bit of a dud when it comes to whipping up climate hysteria, not least because the UN Intergovernmental Panel on Climate Change notes that most conflagrations are started by humans. “Human activities have become the dominant driver,” it observes. But when there is political Net Zero work to be done, the King is only too happy to overlook the evidence. In common with many other countries this year, Canada experienced its worst wildfires for a century, he said.

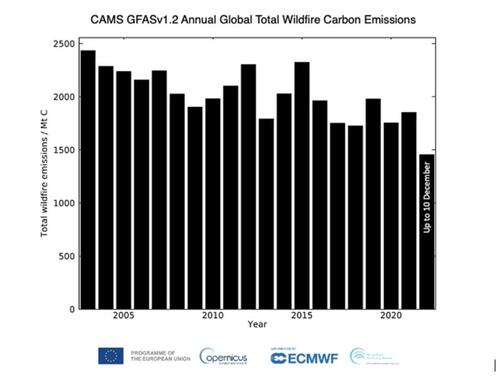
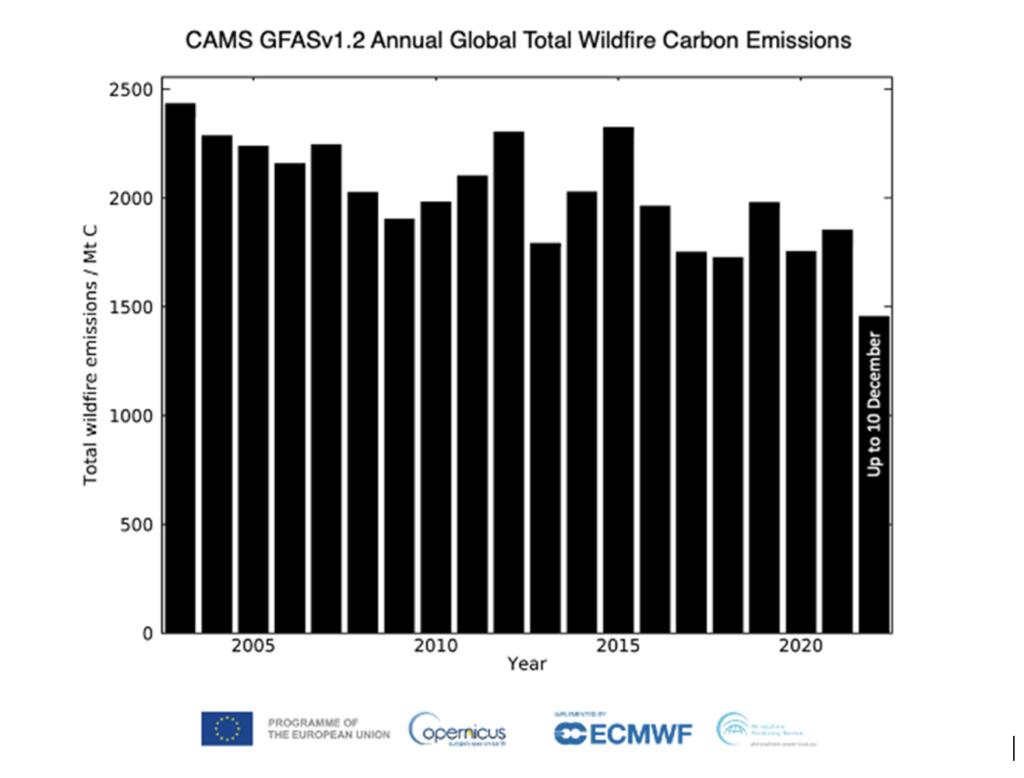
Despite all the human involvement, the above graph shows the gradual decline of global emissions from wildfires over recent decades. In fact, wildfires are almost impossible to pin on any changes on climate since so many other factors, such as arson and land management, are in play.

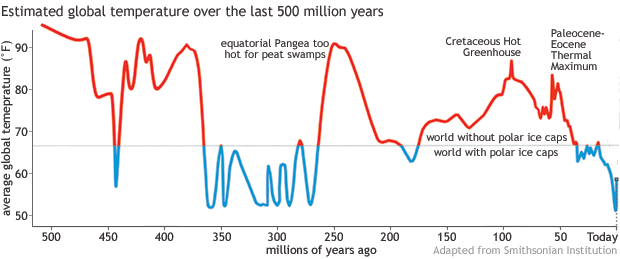
Net Zero is rapidly becoming the dominant political issue of the age. Its obvious collectivist nature gathers support from mostly sectional interests in society. It has no significant grassroots support, since it aims to restrict human lifestyles and wealth on a scale never attempted before in history. It is awash with junk science, fake statistics and computer models. Like the models that said that the earth only has 10 years left, despite current global temperatures being cooler today than much of history.

The late Queen, in her infinite wisdom, never went anywhere near it. But I wonder if “Climate Queen” Greta Thunberg will be speaking? After all, I am dying to hear high school dropout and climate crazy Greta lecture me with her patented “How dare you!”

When John Kerry testified in Congress, he was asked if he owned his own private jet. Being a life-long career politician, Kerry gave a half truth. “No I do not own a private jet.” But his wife does (remember Theresa Kerry was formerly married to Republican Senator John Heinz (of Heinz pickles and ketchup fame).

Hey John, how are we going to power all those EV charging stations without coal? And The Left’s ludicrous fear of nuclear energy. Wind farms (aka, eagle killers)? Offshore wind farms (whale killers)? Solar farms? With panels made in China??

Bidenflation! U.S. Households Are Spending an Extra $11,400 Annually to Afford Basics (Purchasing Power Of US Dollar Down -15.4% Under Biden, Home Prices UP 33.2%)

While members of the Biden Administration party at DC nightclubs, the rest of America are drinking Carlo Rossi wine (a favorite of mine in high school!) and eating Spam.

The average U.S. household needs an additional $11,434 per year to maintain the same standard of living due to record-high inflation under the Biden administration.

While hourly pay has increased, inflation has outpaced it.

Spending on basic survival needs like food, transportation, housing, and energy has increased, with households in the Mountain West facing the highest rates of inflation.

“We choose January 2021 as the base month because it was the last time inflation was within recent historical norms,” the report reads.

“Due to a combination of higher inflation rates and higher average household spending, inflation is imposing the highest monthly costs on families in the states of Colorado, Utah, and Arizona,” the report adds.

Families in Colorado and Washington, DC, are experiencing inflation costs higher than the national average.

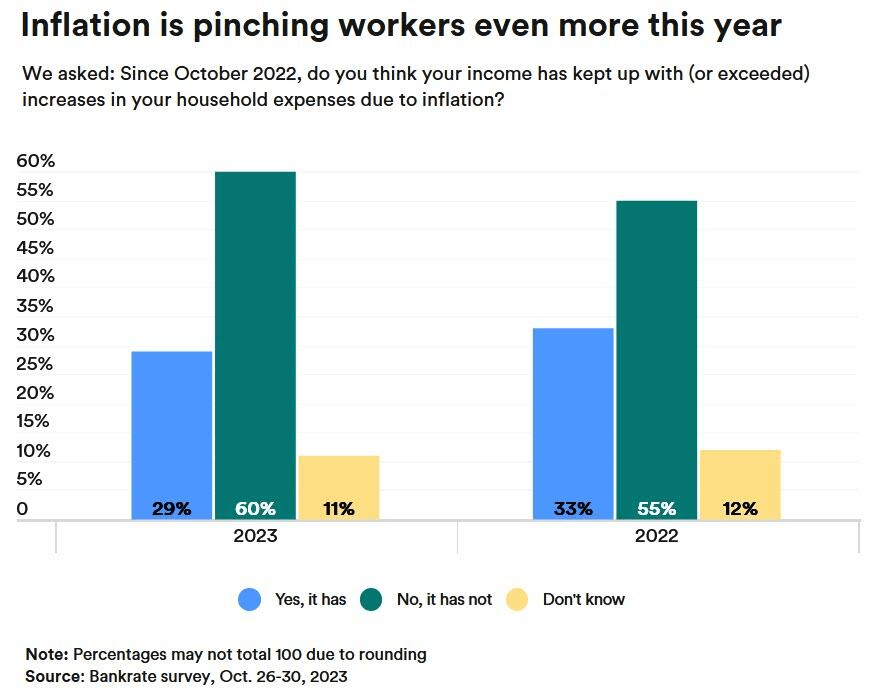
Things are even worse in 2023 regarding inflation ravaging worker’s income. Over 60% of Americans reported that their wages were lagging well behind inflation.

Almost 2 in 3 workers got a pay increase this year — but say they lost ground to inflation.

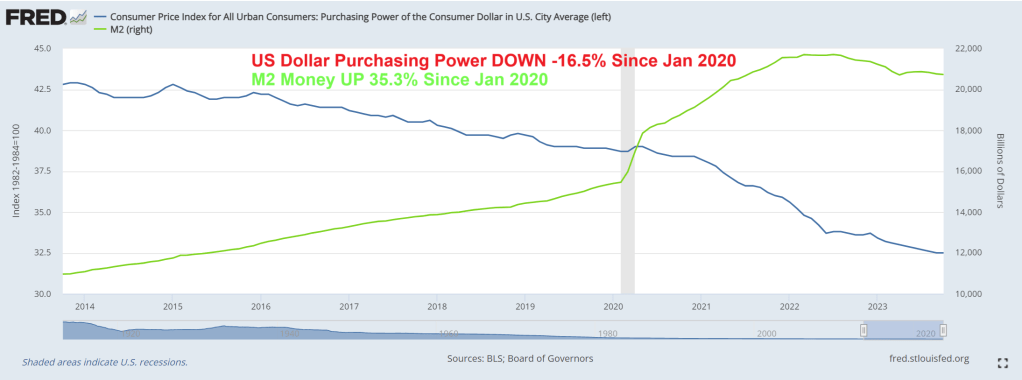
Since January 2021, US purchasing power of the US Dollar is down a whopping -15.4% under Biden.

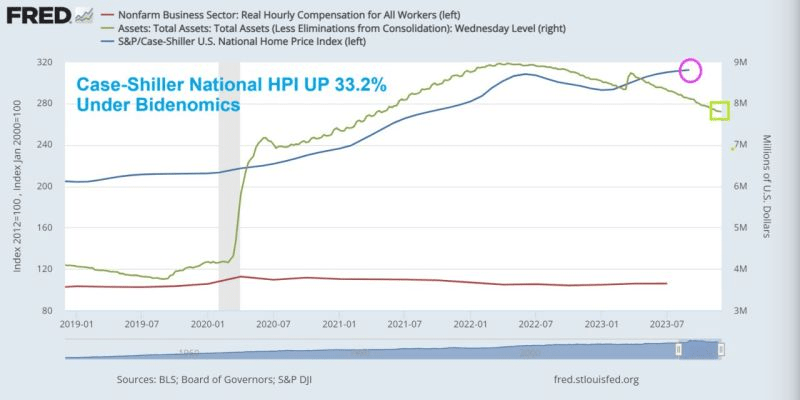
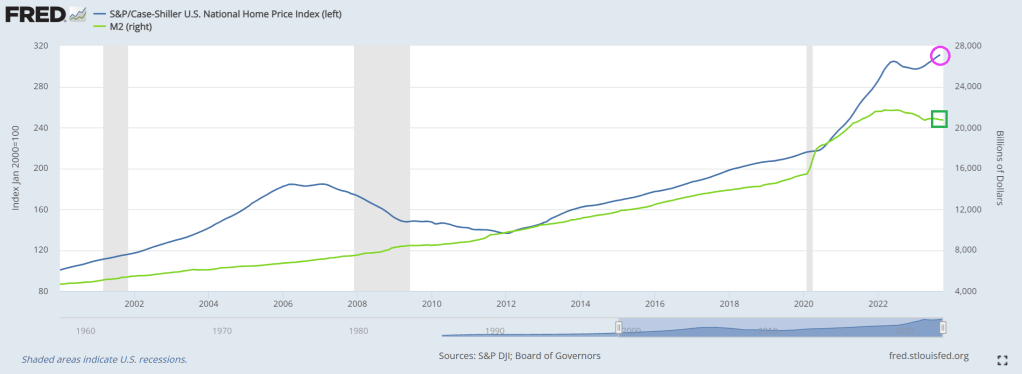
And home prices are up 33.2% under Biden, much of it due to The Feral Reserve money printing to fund Biden’s folicy initiatives. (I saw Biden claim he wrote the Inflation Reduction Act … the one thing we know is House legislation is written by an army of Congressional staffers, not El Presidente).

Home prices up 33.2% and purchasing power of US Dollar down -15.4% under Biden.

And like magic, Biden made $11,400 disappear from household income to pay for Bidenomics.

Foul Powell On The Prowl! Odds Of March Rate Cut Hits 80% As Gold Soars To All-time High (10Y Treasury Yield Drops Below 5%)

Foul Powell on the Prowl!

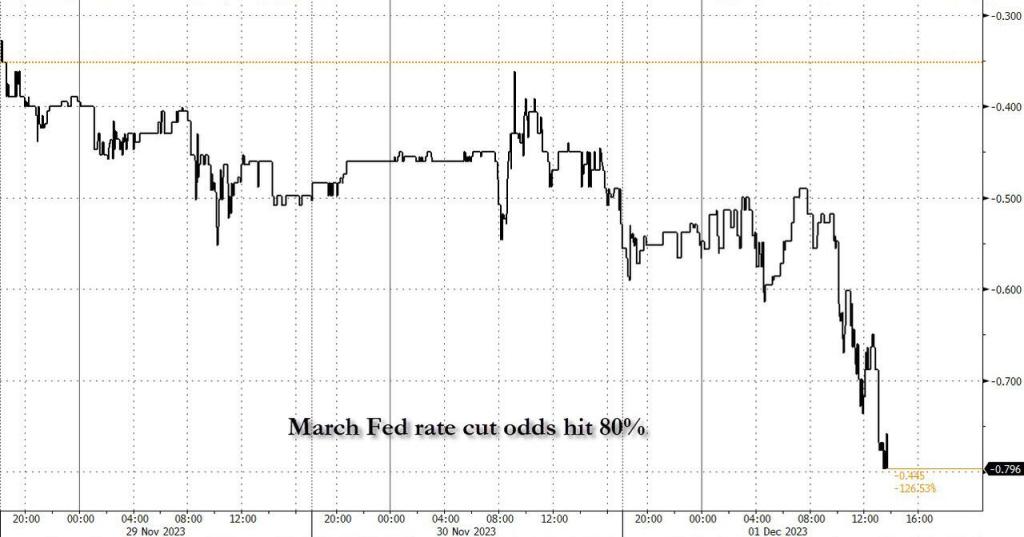
Despite Powell’s confusing messaging on inflation, the market is pricing in an 80% chance of a rate cut in March 2024.

The Fed’s dots plot shows the same thing: Fed target rate falling like a paralyzed falcon.

As gold soars to an all-time high.

The difference between California governor Gavin “Toothsome” Newsom and Leave it to Beaver’s Eddie Haskell is that Eddie Haskell was more sincere.

Down Payment Blues! Median Home Prices UP 20% Under Bidenomics, Making Homeownership Even More Unaffordable (Case-Shiller National Prices UP 33.2% Under Biden)

The US middle class has the Down Payment Blues! Or a case of housing being simply unaffordable.

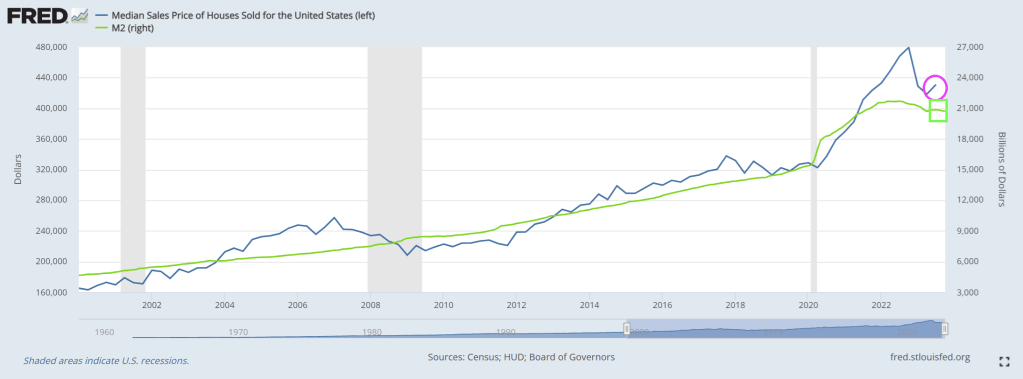
Median home prices are up a whopping 20% under Biden and his signature Bidenomics, growing the economy from the inside-out (?) instead of top-down. Excuse me Joe, Bidenomics is pure top-down Soviet-style economic planning. Markets be damned! The end result? Housing is far more expensive under Biden as are down payments.

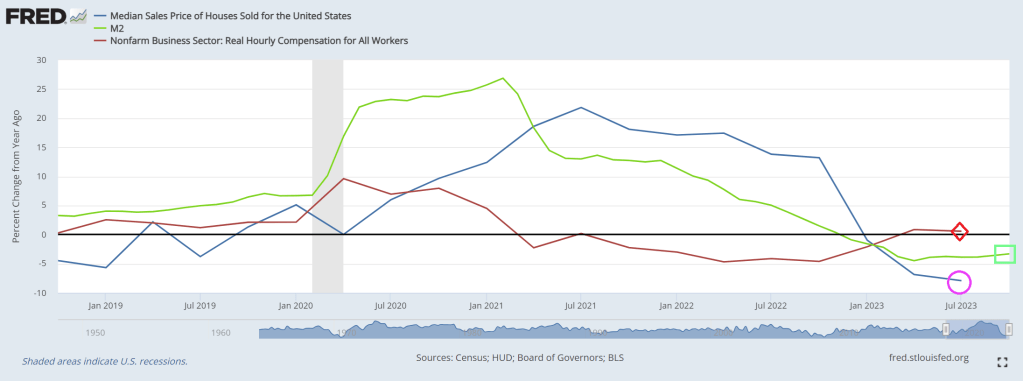
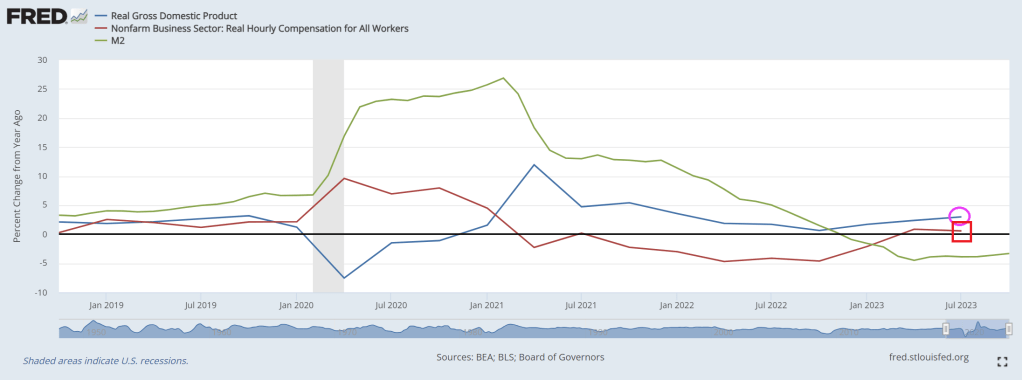
If we look at year-over-year (YoY), we can see the burst of Covid-related spending and M2 Money growth (green line) that surged in 2020/2021. And rising home prices followed shortly thereafter. But as M2 Money growth slows, median home price growth declined into negative growth. The only factor that is positive is real hourly compensation (red line). But that is barely above 0%.

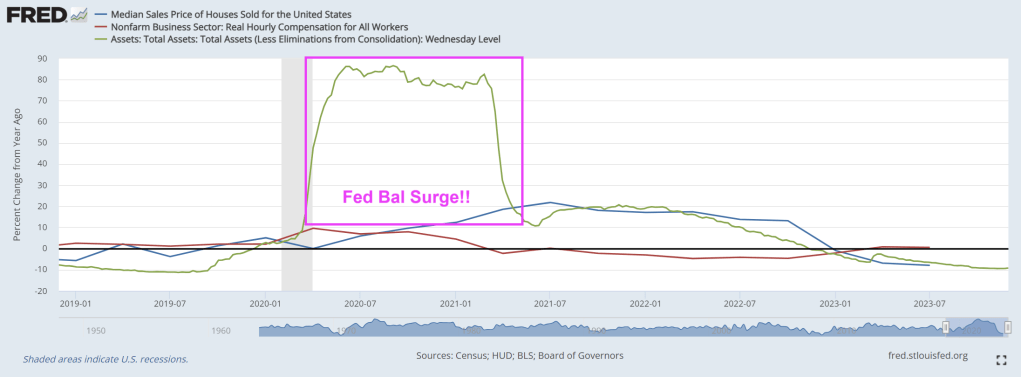
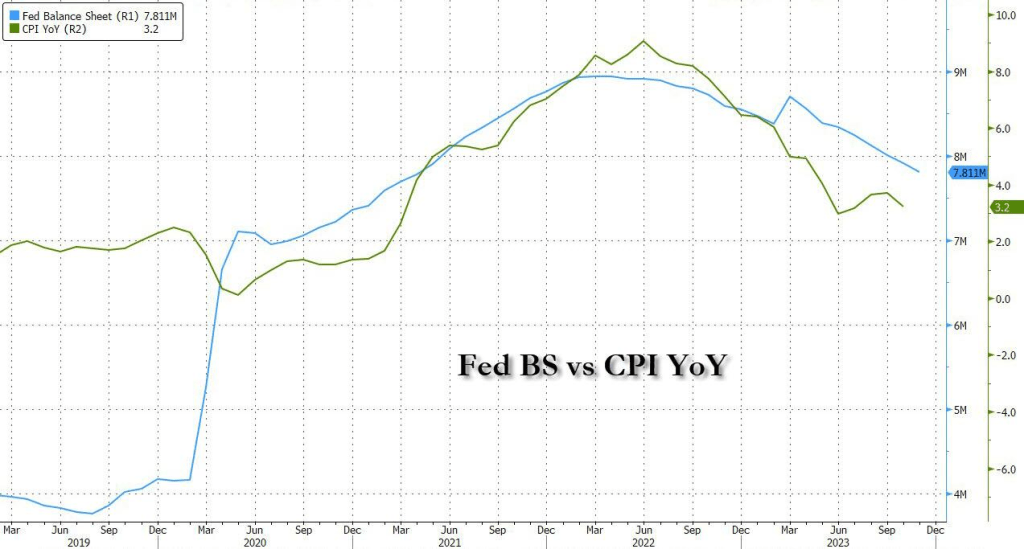
If we look at The Fed’s balance sheet surge (much like a storm surge), you can see the 2020/2021 overreaction to Covid and the various government shutdowns (along with school shutdowns).

The problem is that The Fed is shrinking their balance sheet like Biden shuffles. Maybe The Fed is following Biden’s lead: slow walking, incoherent messaging. And with the Fed storm surge of 2020/2021, Case-Shiller national home price index is up 33.2% under Bidenomics. Good luck with that down payment if you are renting and want to become a homeowner.

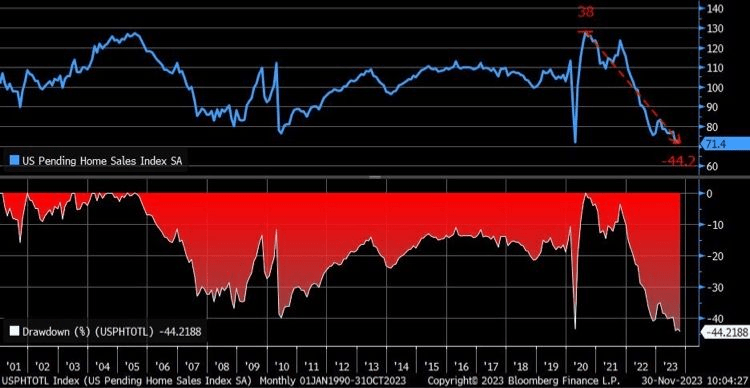
Pending home sales crash is showing why government usually fails to deliver sensible outcomes.

After all, Biden (and his overlord Obama) are truly addicted to gov solutions. Which means they are doomed to fail, as most government policies do.

Highway To Hell! Unrealized Losses At US Banks Exploded In Q3 As US Teeters On Full-blown Recession, Thanks To Bidenomics

Bidenomics is America’s Highway To Hell!

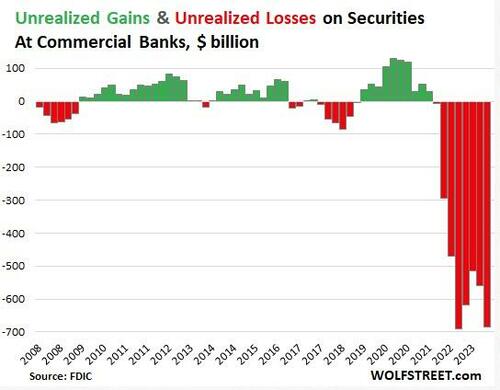
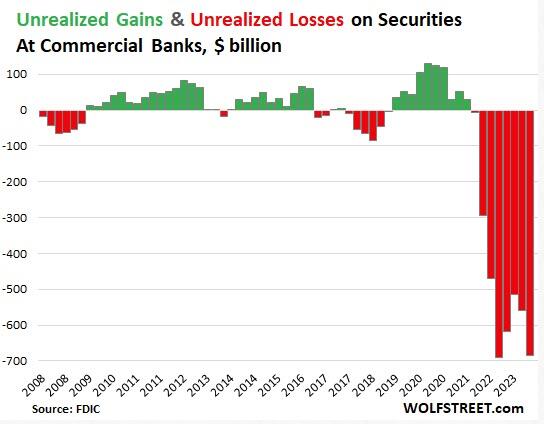
Unrealized losses on securities held by US banks exploded by 22% in the third quarter.

Of course, unrealized losses don’t really matter — until they do.

This is yet more evidence that the financial crisis that kicked off last March continues to bubble under the surface.

Unrealized losses, primarily on US Treasuries and mortgage-backed securities rose by $126 billion in Q3 and now total $684 billion, according to the FDIC’s quarterly bank data release.

Current unrealized losses are only slightly below the record set in the third quarter of 2022. This reflects the fact that the FDIC took over three failed banks earlier his year and ate their unrealized losses when it sold the banks’ assets, thus wiping them from the books.

Unrealized looses on securities are divided between two accounting methods.

  • Unrealized losses on held-to-maturity (HTM) securities jumped by $81 billion to $391 billion.
  • Unrealized losses on available-for-sale (AFS) securities jumped by $45 billion to $293 billion.

It’s important to understand these are only paper losses. Ostensibly, the banks will hold these bonds until maturity and then will be paid their face value. If it plays out this way, there won’t be any real losses.

The problem is that these unrealized losses drastically decrease a bank’s liquidity. If it has to sell bonds in order to raise capital, the bank will experience significant losses. This is exactly what took down Silicon Valley Bank last March.

Here’s what happened.

SVB sold a large portion of its bond portfolio at a $1.8 billion loss. At the time, SVB CEO Greg Becke said the bank made the sale “because we expect continued higher interest rates, pressured public and private markets, and elevated cash burn levels from our clients.”

The bank bought the bonds when interest rates were low. As a result, the $21 billion available for sale (AVS) bond portfolio was not yielding above cash burn. Meanwhile, rising interest rates caused the value of the portfolio to fall significantly. The plan was to sell the longer-term, lower-interest-rate bonds and reinvest the money into shorter-duration bonds with a higher yield. Instead, the sale dented the bank’s balance sheet and caused worried depositors to pull funds out of the bank.

WolfStreet explained more generally how these “irrelevant” unrealized losses can suddenly become relevant.

Banks, via a quirk in bank regulations, don’t have to mark these securities to market value, but can carry them at purchase price. The difference between market value and purchase price is the ‘unrealized gain or loss’ that the bank must disclose in its quarterly financial filings, so that we the depositors can see them and get spooked by them and yank our money out, us billionaires and centimillionaires first, on the two fundamental principles of investing: 1, he who panics first, panics best; and 2, after us the deluge.”

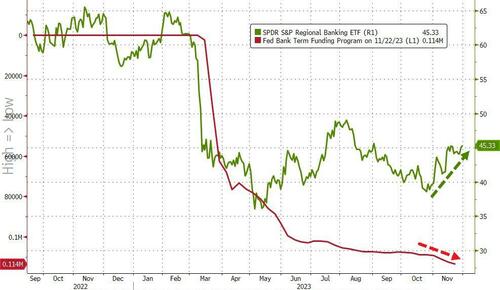
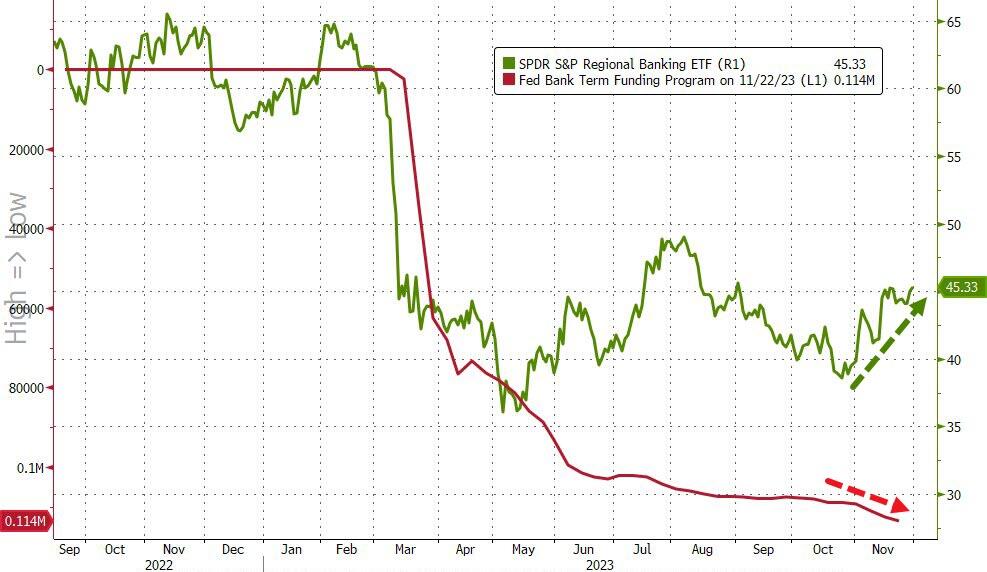
The Federal Reserve set up a bailout program to allow banks to deal with this problem. Instead of selling bonds at a loss, cash-strapped banks can go to the Fed’s Bank Term Funding Program (BTFP) and borrow against them “at par” (face value). This allows banks to use these undervalued assets to raise cash (at least temporarily) without realizing big losses on their balance sheets.

As unrealized losses rise, banks continue to tap into this bailout program more than nine months after the crisis kicked off.

Total outstanding loans in the BTFP program jumped by just over $5 billion in November alone.

In effect, the Fed managed to paper over the financial crisis with this bailout program.

It basically slapped a bandaid on it. But it has not addressed the underlying issue – the impact of rising interest rates on an economy and financial system addicted to easy money.

Remember, the US is on the cusp of a REAL recession, thank to Bidenomics.

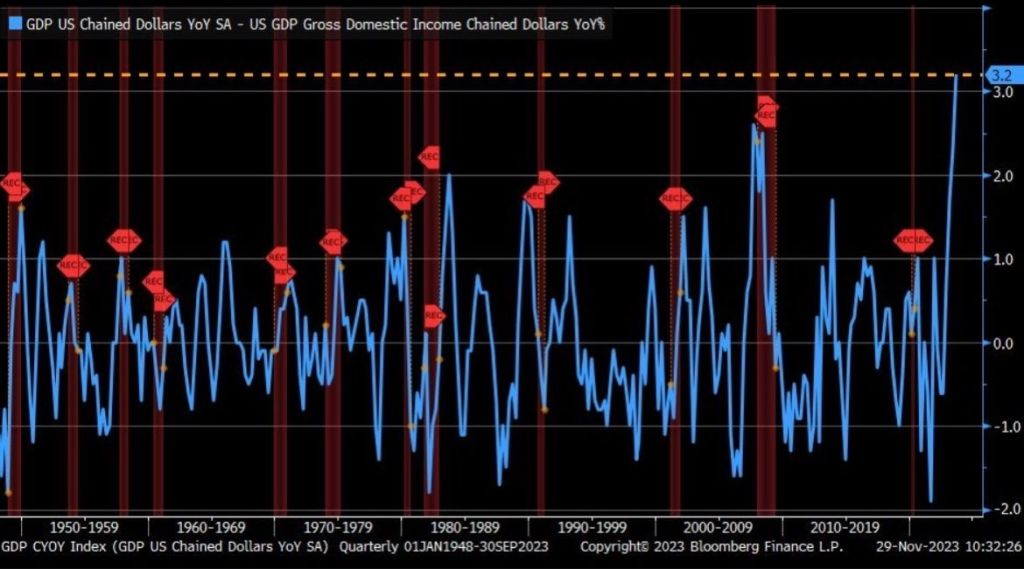
The spread between real GDP and real Gross Domestic Income (GDI) just hit an all-time high. Even higher than The Great Recession of 2009.

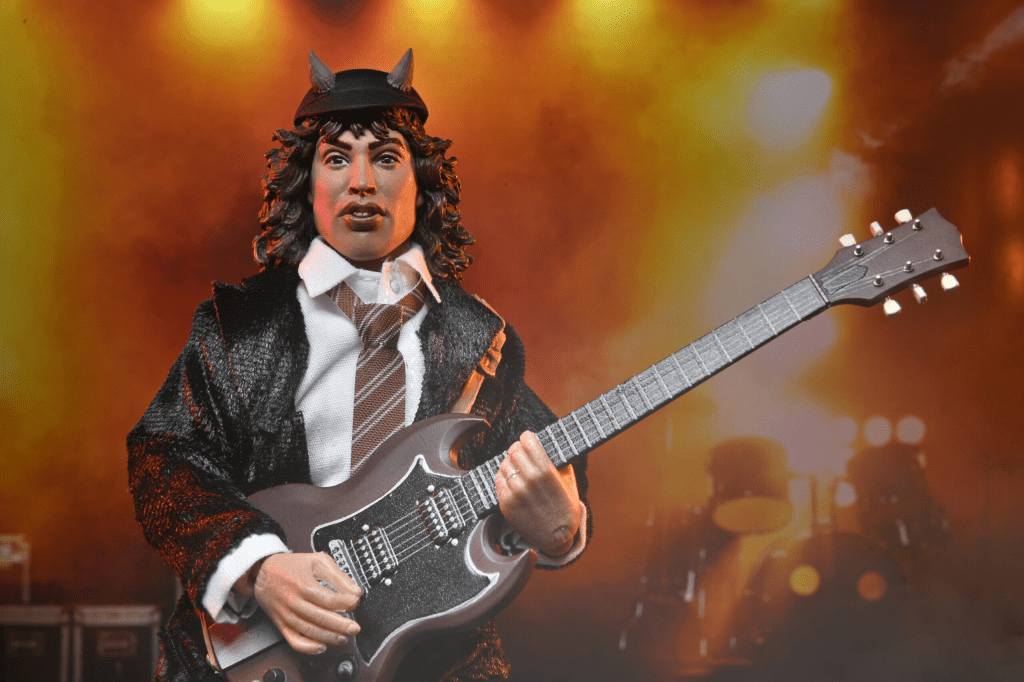
Might as well have AC/DC’s Angus Young as US Treasury Secretary instead of tone-deaf Janet Yellen.

Yellen singing “Highway To Beijing.”

Inflation Re-animator? Freddie Mac House Price Index Increased in October to New High; Up 6.0% Year-over-year (YoY), Austin Tx Biggest Loser Along With Idaho

Despite The Fed’s attempts at cooling inflation down to 2%, we are seeing a re-animation of price increases. this time with home prices.

On a year-over-year basis, the Freddie Mac National FMHPI was up 6.0% in October, from up 5.1% YoY in September.  The YoY increase peaked at 19.1% in July 2021, and for this cycle, bottomed at up 0.9% in April 2023. …

vv

Austin TX is the big loser, down -11.2% from peak. Followed by Idaho (largely people escaping from Newsomland (California) and speculators. The sixth leading area is Lake Havasu AZ.

Freddie HPI CBSA

As of October, 7 states and D.C. were below their previous peaks, Seasonally Adjusted. The largest seasonally adjusted declines from the recent peak were in Idaho (-4.5%), Utah (-2.7%), D.C. (-2.0%), and Nevada (-1.6%). Nevada, Idaho and Utah are now known as the Mild, Mild, West due to sagging home prices.

For cities (Core-based Statistical Areas, CBSA), here are the 30 cities with the largest declines from the peak, seasonally adjusted. Austin continues to be the worst performing city.

Speaking of inflation and The Fed, Biden claiming he lowered inflation is laughable if it wasn’t so sad. It is all The Fed. And their timidness is shrinking their balance sheet is contributing to persistent inflation.

So, yes, inflation is growing again. This time it is persisent and growing.

Why Is US GDP Growth So Strong? Bidenomics Is About BIG Government Spending (+4.7%), Not Consumer Spending (Highway To Hell!)

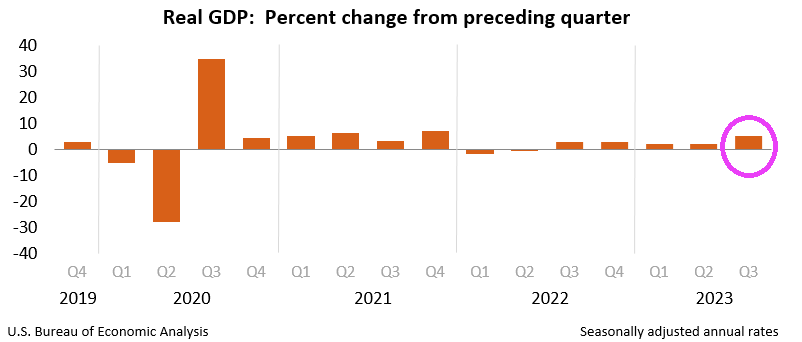
US Real GDP grew at a whopping 5.2% (revision) in Q3.

But was it organic growth or simply The Federal Government funding the defense and green energy industies with trillions in spending?

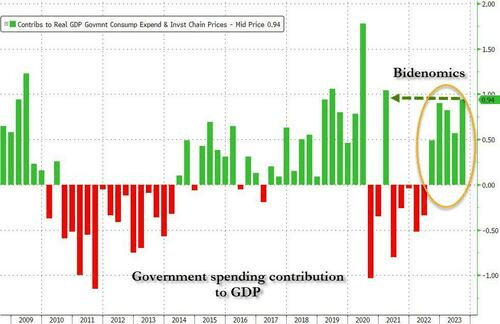
One factor has been government spending which grew an unsustainably 4.7% in real terms over the last year. Outside the pandemic, this is one of the fastest rates in decades and works at a cross purpose with monetary policy objectives.

Bidenomics is code for massive Federal spending (and debt) to fund Federal priorities: wars in Ukraine, Israel and likely involvement around Taiwan. And the costly switch to green energy (but not nuclear, for some reason).

If the US economy growing simply to function as a war machine and wealth transfer mechanism from the middle class to the 1%, we are on the Highway To Hell. Personal consumption contributed 2.44% to the bottom line GDP print in Q3, down from the pre-revision number of 2.69% but well above Q2’s 0.55%.

Where Has All The GDP Gone? US Q3 Real GDP Revised Upwards To 5.2%! But Real Hourly Earnings Only 0.6% YoY (Home Prices Hit All-time High)

Where has all the GDP gone? Not to wages.

As expected, Q3 Real GDP was revised upwards to 5.2% annualized. Of course, this shatters JKP’s talking points that Biden inherited a train wreck of an economy from Trump. Q3 2020 Real GDP grew at over 30%.

And on a year-over-year (YoY) basis, US real GDP grew at 3.0% in Q3. Unfortunately, real hourly compensation grew at a measly 0.6% YoY.

Meanwhile, home prices have hit an all-time high. Too bad real wages are so low.

Why is growth so strong? One factor has been government spending which grew an unsustainably 4.7% in real terms over the last year. Outside the pandemic, this is one of the fastest rates in decades and works at a cross purpose with monetary policy objectives.

Mortgage Inferno! Mortgage Purchase Demand (Applications) Down -31% From Previous Week, Refi Application Demand Down -9% WoW

Mortgage inferno!

Particularly for the mortgage and housing market. But if you want spin the numbers, look at the seasonally-adjusted numbers. I like the unadjusted data better, but they look horrid.

Mortgage applications increased 0.3 percent from one week earlier, according to data from the Mortgage Bankers Association’s (MBA) Weekly Mortgage Applications Survey for the week ending November 24, 2023. This week’s results include an adjustment for the observance of the Thanksgiving holiday.

The Market Composite Index, a measure of mortgage loan application volume, increased 0.3 percent on a seasonally adjusted basis from one week earlier. On an unadjusted basis, the Index decreased 33 percent compared with the previous week.  The seasonally adjusted Purchase Index increased 5 percent from one week earlier. The unadjusted Purchase Index decreased 31 percent compared with the previous week and was 19 percent lower than the same week one year ago.

The Refinance Index decreased 9 percent from the previous week and was 1 percent higher than the same week one year ago. Mortgage rates decreased for the fourth time in five weeks, with the 30-year fixed rate dipping to 7.37 percent, the lowest level in 10 weeks. 

Devil With A Blue Dress? US Home Prices Rose For the 7th Straight Month In September… Led By Detroit! (Illegal Immigration Destinations Lead Nation)

Detroit?? Or Devil With A Blue Dress??

Home prices in America’s 20 largest cities rose for the 7th straight month in September (the latest data released by S&P Global Case-Shiller today), up 0.67% MoM (slightly worse than the +0.8% MoM expected).

That pushed the YoY rise in prices up 3.92% – the fastest pace since Dec ’22 – but as the chart shows the MoM gains are slowing rapidly.

Source: Bloomberg

“On a year-over-year basis, the three best-performing metropolitan areas in September were Detroit (+6.7%), San Diego (+6.5%), and New York (+6.3%),” according to Craig J. Lazzara, Managing Director at S&P DJI.

“We’ve commented before on the breadth of the housing market’s strength, which continued to be impressive. On a seasonally adjusted basis, all 20 cities showed price increases in September”

But, judging by the resumption of the rise of mortgage rates since the Case-Shiller data was created, we would expect prices to also resume their decline

Source: Bloomberg

Inventory is increasing (as homebuilders dump new homes on to the market), but existing home-buyers and -sellers are stuck still (affordability for the former and the mortgage cost gap for the latter), and – despite the market’s hopes – The Fed isn’t cutting rates any time soon (unless the economy utterly collapses). Be careful what you wish for…

Odd that 4 metro areas with 6% or higher home price growth are all cities with larger illegal immigrant migration: Chicago, Detroit, New York and San Diego (all blue cities). This is what is called housing displacement, A surge in immigration leads to rent stock being absorbed and housing prices rising.