12,700 union workers walk out of three Midwest plants
GM, Stellantis and Ford seek more talks; Biden to mumble, get irrationally angry and tell a personal story on Friday
The United Auto Workers began a strike Friday against all three of the legacy Detroit carmakers, an unprecedented move that could launch a costly and protracted showdown over wages and job security.
After the midnight deadline for a new contract passed, workers walked out on a Ford Motor Co. plant in Michigan that makes Bronco SUVs, a General Motors Co. factory in Missouri that assembles Chevrolet Colorado pickups and a Stellantis NV plant in Ohio that builds Jeep Wrangler SUVs. The union and automakers are still far apart after weeks of talks.
I can’t wait to hear Biden’s incoherent speech on the union strike. Old Joe is allegedly the most pro union President in history. He will mispronounce words, mumble, have an outburst of anger, and tell a story about when he built cars in Scranton PA.
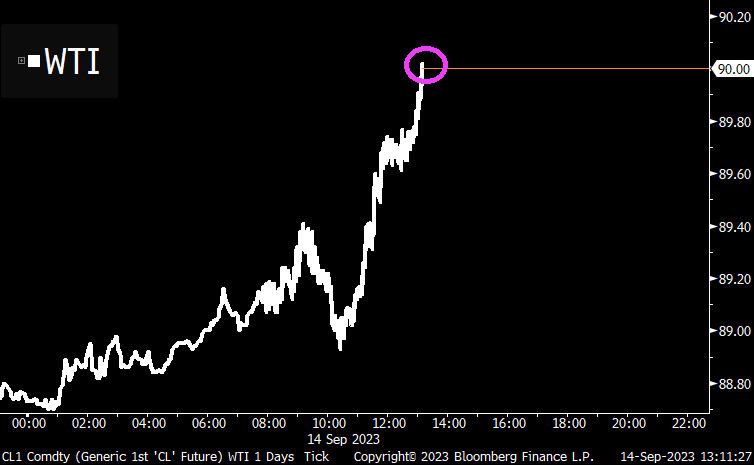
Anyway, in August, the drop in the output of motor vehicles and parts (-7.60% YoY) contributed to declines in the indexes for consumer durables and transit equipment. A strike will not help.
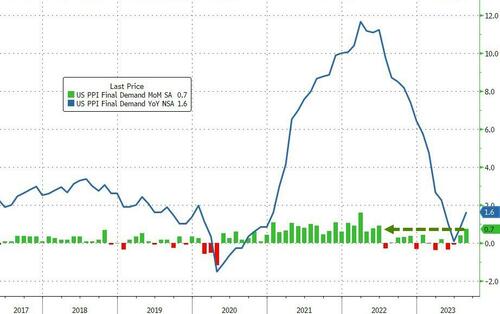
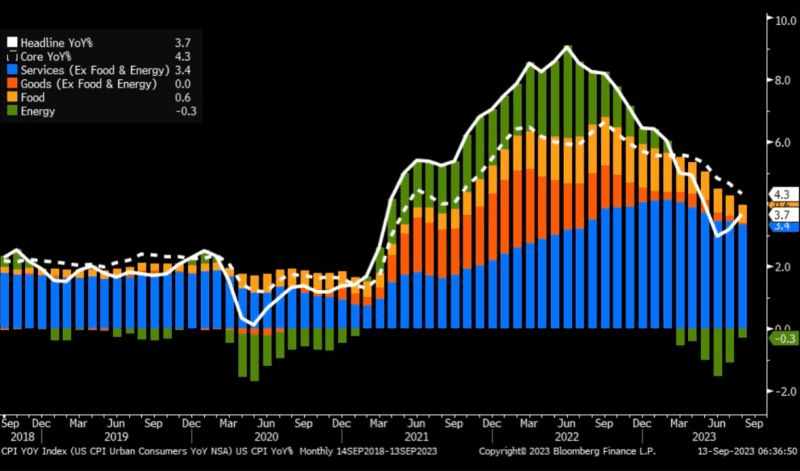
Producer Prices rose 0.7% MoM in August (up from +0.3% in July and hotter than the +0.4% exp). That is the hottest PPI since June 2022, and pushed YoY prices up 1.6%…
Source: Bloomberg
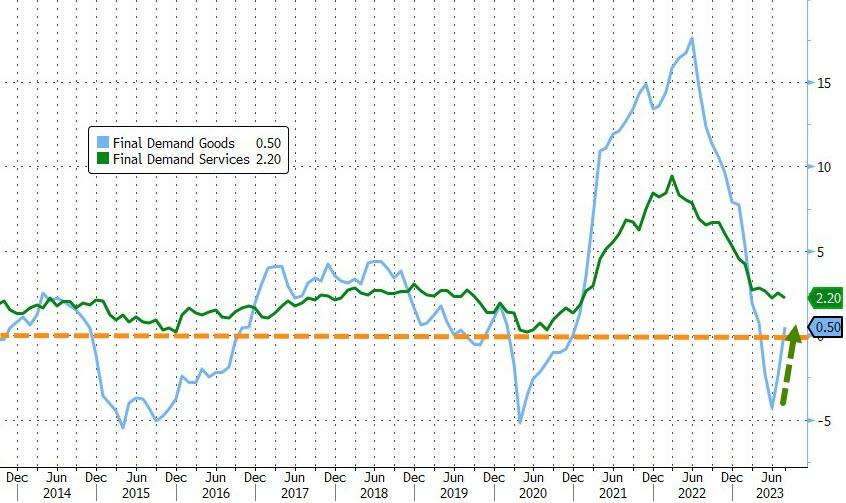
Goods prices are reaccelerating fast, now back into inflation YoY (as Services cost growth slowed only modestly)…
Source: Bloomberg
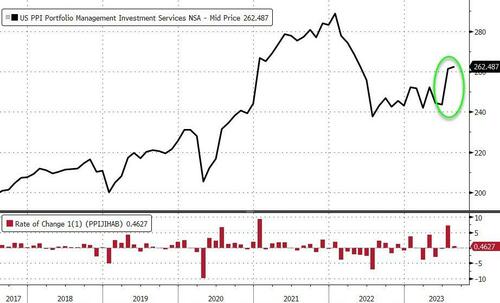
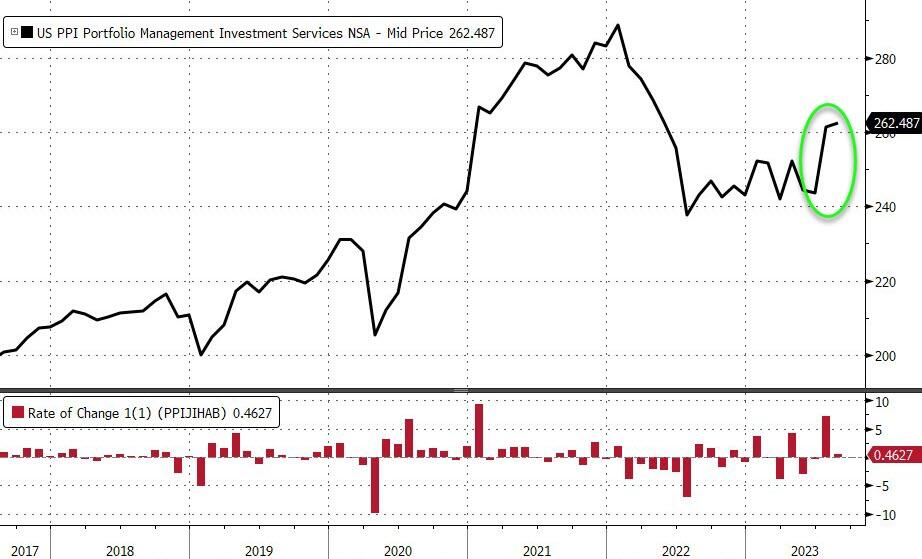
As a reminder, much of last month’s PPI rise was driven by a big jump in portfolio management costs – as stocks soared. August saw a further rise in those costs…
Source: Bloomberg
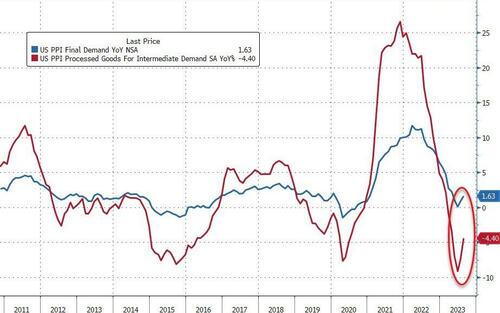
More problematically, the pipeline for PPI appears to have inflected as intermediate demand is re-accelerating…
Well, this isn’t good if you are a mortgage lender.
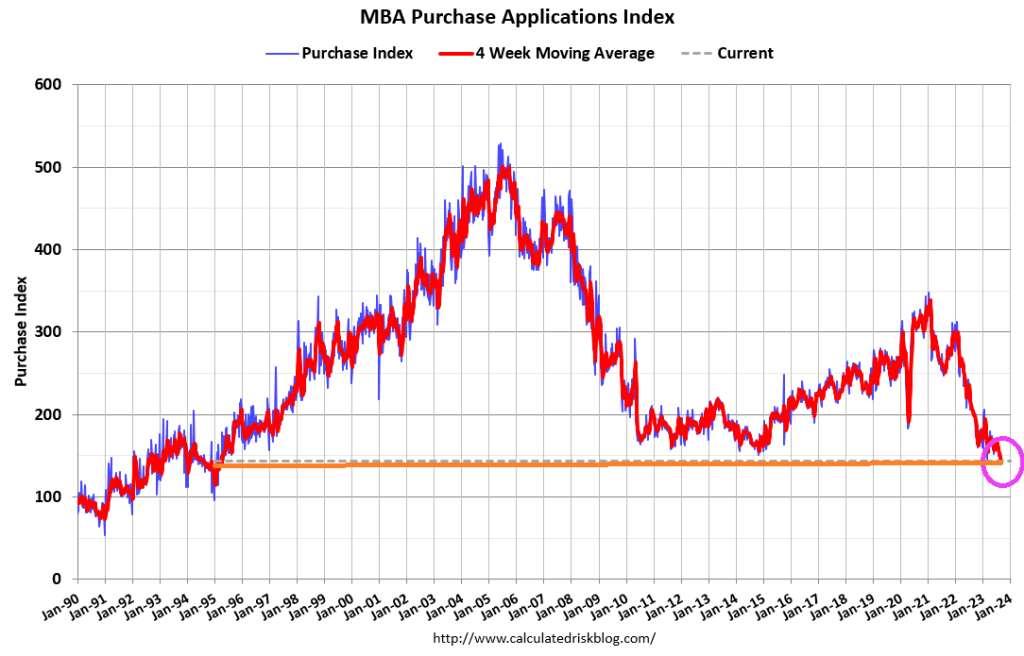
Mortgage applications decreased 0.8 percent from one week earlier, according to data from the Mortgage Bankers Association’s (MBA) Weekly Mortgage Applications Survey for the week ending September 8, 2023. This week’s results included an adjustment for the Labor Day holiday.
The Market Composite Index, a measure of mortgage loan application volume, decreased 0.8 percent on a seasonally adjusted basis from one week earlier. On an unadjusted basis, the Index decreased 12 percent compared with the previous week. The Refinance Index decreased 5 percent from the previous week and was 31 percent lower than the same week one year ago. The seasonally adjusted Purchase Index increased 1 percent from one week earlier. The unadjusted Purchase Index decreased 11 percent compared with the previous week (WoW) and was27 percent lower than the same week one year ago (YoY).
The Federal Reserve, the most powerful Socialist machine on the planet, is considering rate their target rate after some bad economic news.
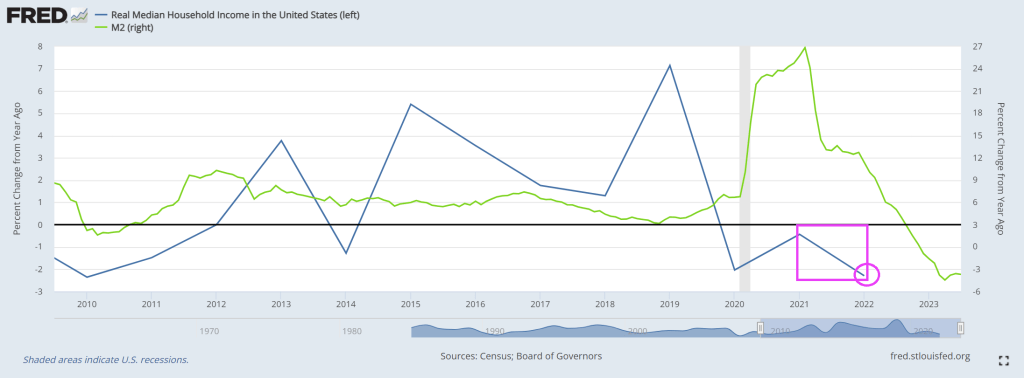
First, real median household income (released yesterday for 2022) showed a decline of -2.3%. That is the worst decline 2010 when Biden was Vice-president. Notice that real median household income has never been positive under Biden (I doubt if PressSec Jean Pierre will brag about this!)
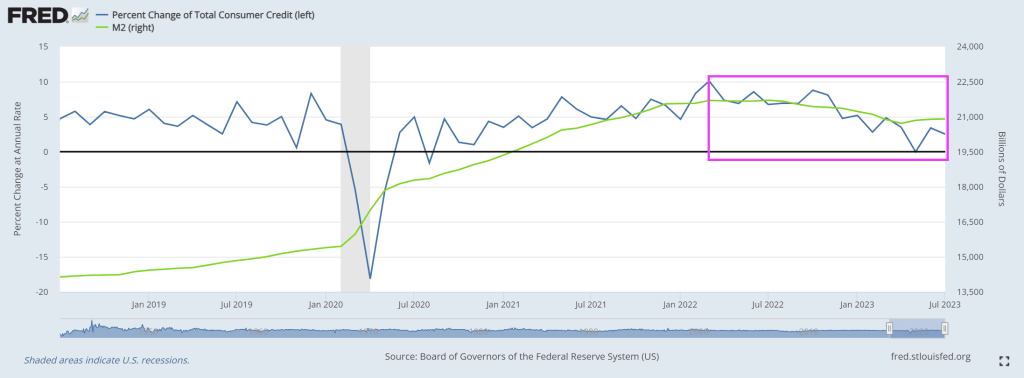
This is particulary dangerous since it was the worst correction in home prices since two rather nasty recessions of 1970 and 2008 (The Great Recession and financial crisis). This correction occured as M2 Money growth (green line) went negative.
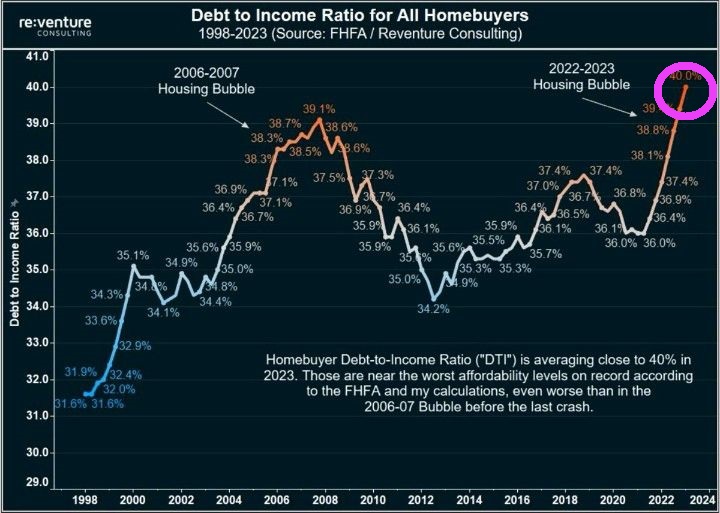
With Fed rate hikes, debt to income ratios are the highest in history.
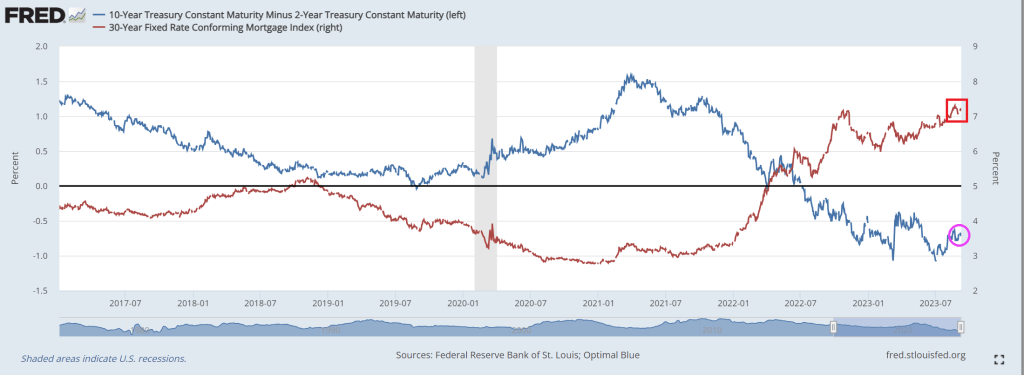
Mortgage rates are above 7% under Biden and Powell (not Baden-Powell, the founder of the Boy Scouts).
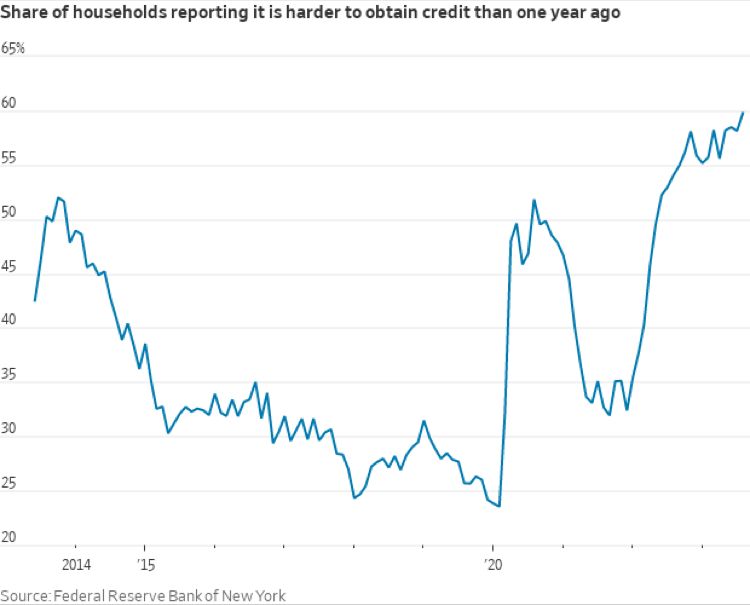
But not only are mortgage rates above 7%, but the mortgage credit box is tightening.
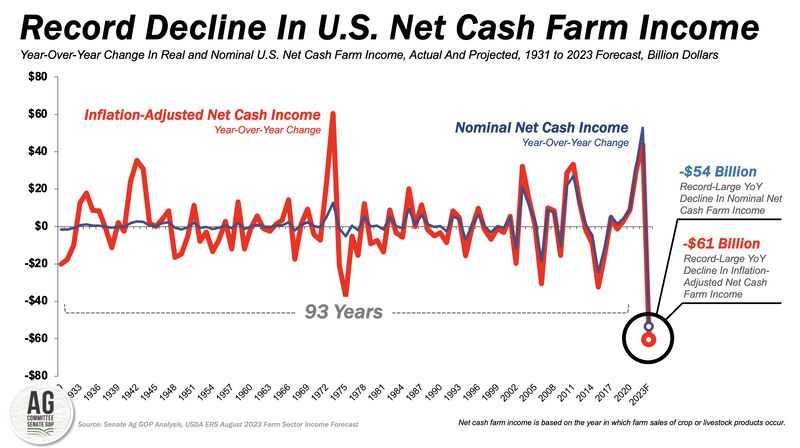
Bidenomics is a train wreck. But unlike E. Palestine Ohio, the site of a train derailment and massive toxic spill (for which Biden has yet to visit), Bidenomics is a continuing train wreck.
The first chart is the record decline in US net cash farm income. Now in negative growth!
Second, US office vacancy rate is now higher than the peak during the financial crisis. Of course, Covid shutdowns and work from home is the primary driver, but Democrat crime policies are making it more hazardous to work in offices in major American cities, so Bidenomics isn’t helping.
Is Biden acting on behalf of World Economic Forum’s Klaus Schwab? Well, Biden appointed John Kerry, another dimwitted former US Senator like Biden, to be his climate Czar. Kerry wants to shut down farms and starve the population, just like his Overlord Klaus Schwab.
Are Biden and America’s Progressives part of Schwab’s “Great Reset?” Where we eat insects while Biden, Kerry, Schwab and the elites feast on Wagyu beef, foie gras, and expensive champagne. Elitist Treasury Secretary Yellen looks like she could use some Ozempic!
And then we have elitist California governor Gavin “Count Yorga” Newsom opining on Biden’s great “success.” 70% of Americans say things are going badly under Biden, but California Democrat Gov. Gavin Newsom says he’s “very inspired by the master class of the last two-and-a-half years”
Ah, the elite class! Reminds me of the French aristocracy under Louis the 16th and Marie Antoinette. “Let them eat crickets!”
Bidenomics is terrible! Just a huge payoff to be big donors (the donor class) for green energy, Big Pharma and Big Defense. Now Biden is considering using ankle monitors to prevent illegal immigrants from leaving Texas and traveling to welfare-friendly blue states like California and New York rather than just enforcing the border. The middle class is truly wasting away with Bidenomics.
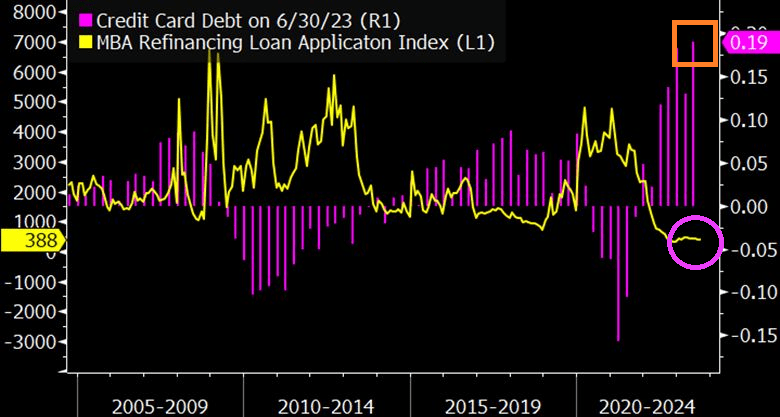
Let’s start with crashing mortgage refi demand as consumers load up on credit cards to afford rising prices thanks to Bidenomics.
The Fed reports dramatically weakening consumer credit with negative revisions too.
Consumer Credit data from the Fed, the last two months labeled are May and July, chart by Mish
Consumer Credit Report Revisions
Consumer Credit data from the Fed, chart by Mish
Revision Key Points
Most of the revisions are in nonrevolving, but that impacts the totals.
Nonrevolving credit rose $1 billion in July, from a negative $22 billion adjustment in June. The Fed revised a reported $3.735 trillion down to $3.713 trillion.
In turn, nonrevolving impacted the totals.
Total credit rose $11 billion in July, from a negative $23 billion adjustment in June. The Fed revised a reported $4.997 trillion in June down to $4.974 trillion.
Nonrevolving Consumer Credit in Billions of Dollars
Nonrevolving consumer credit data from the Fed, chart by Mish
Nonrevolving Credit Implications
Assuming the data is accurate (unlikely) or at least the revision direction is accurate (likely), mortgage and existing home sales data is suspect.
Real (inflation adjusted) nonrevolving credit peaked in June of 2021.
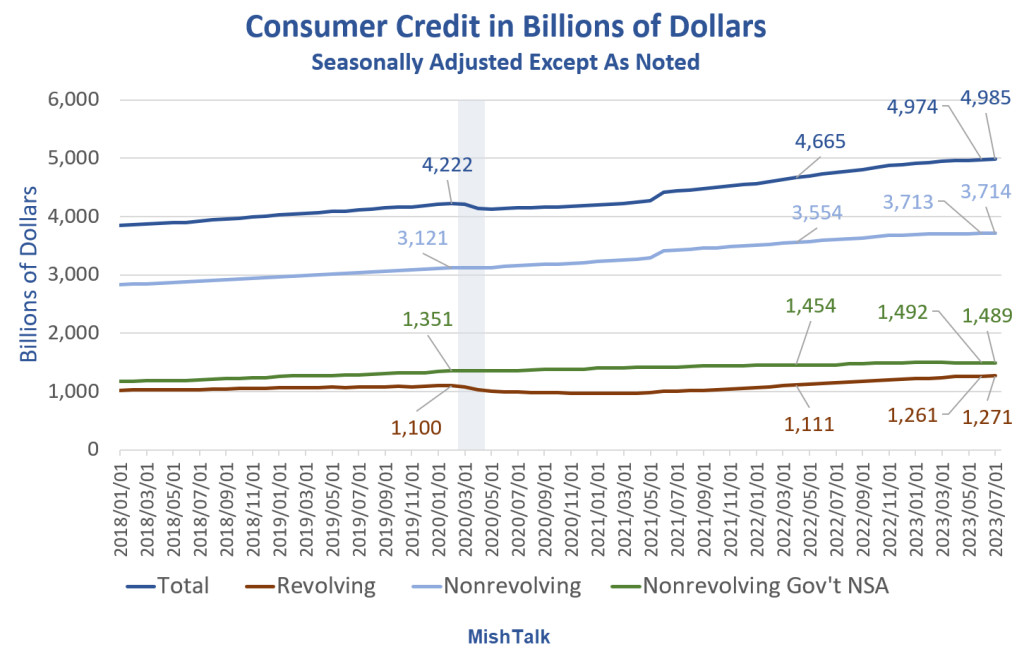
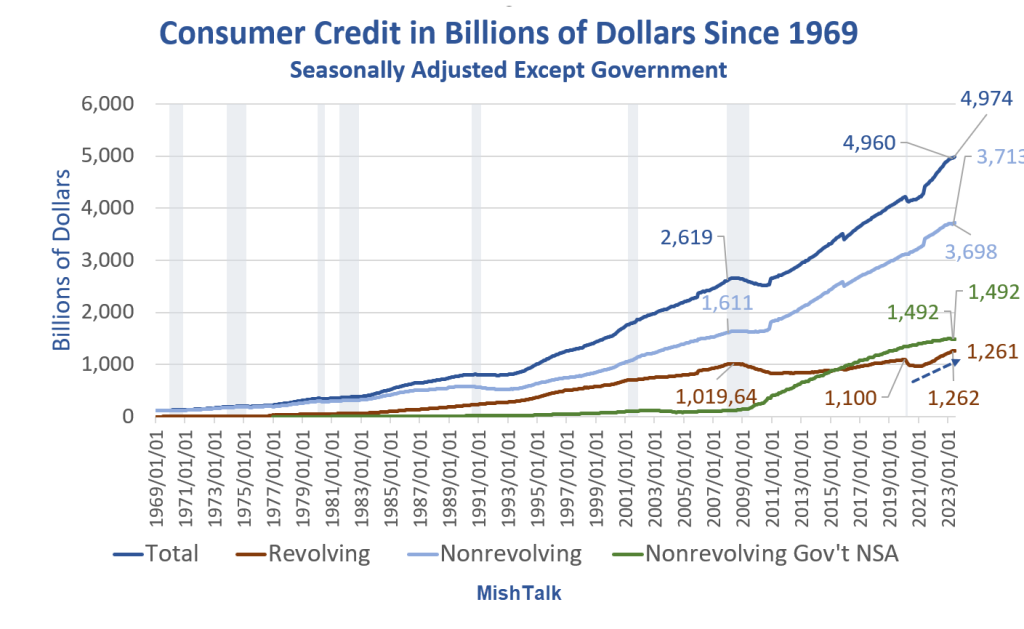
Consumer Credit in Billions of Dollars Since 1969
Consumer Credit data from the Fed, chart by Mish
Consumers have generally done a pretty good job of avoiding credit card debt thanks to three rounds of fiscal stimulus.
However, inflation kicked in and the stimulus money has been spent. The result is the steep rise in credit card debt as noted by the blue arrow. Let’s hone in on that.
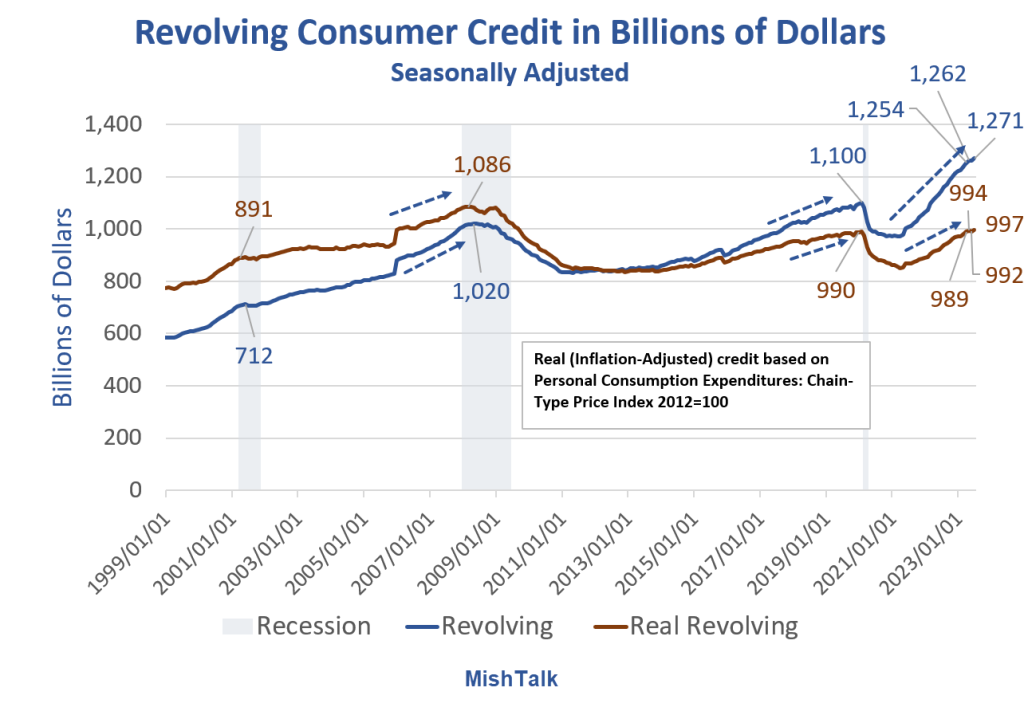
Revolving Consumer Credit in Billions of Dollars
Consumer Credit data from the Fed, Real (inflation adjusted calculation) and chart by Mish
Stunning Steepness in Credit Card Debt Accruals
The speed at which consumers are going into credit card debt is stunning.
It’s hard to maintain lifestyles with rising inflation unless wages keep up.
The BLS and Fed believe the rate of increase in inflation is falling. Assuming the data is correct, consumers are struggling anyway.
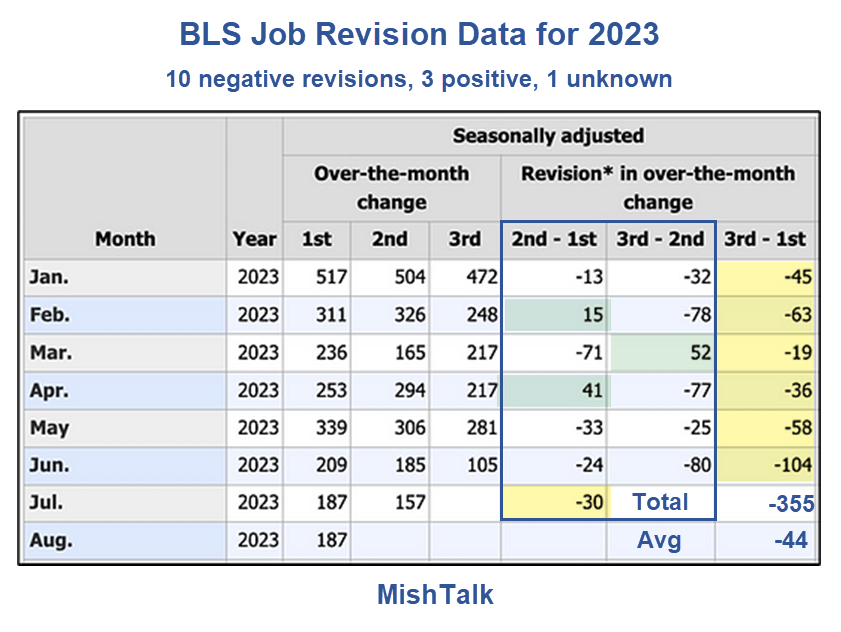
What Happens if Jobs Take a Dive?
That’s actually the wrong question. Job revisions (there’s that word again) have been steeply negative.
BLS Job Revision Data from the Philadelphia Fed
Jobs are still positive, assuming (there’s that word again) you believe the numbers and more negative revisions (there’s that word again) are not in the works.
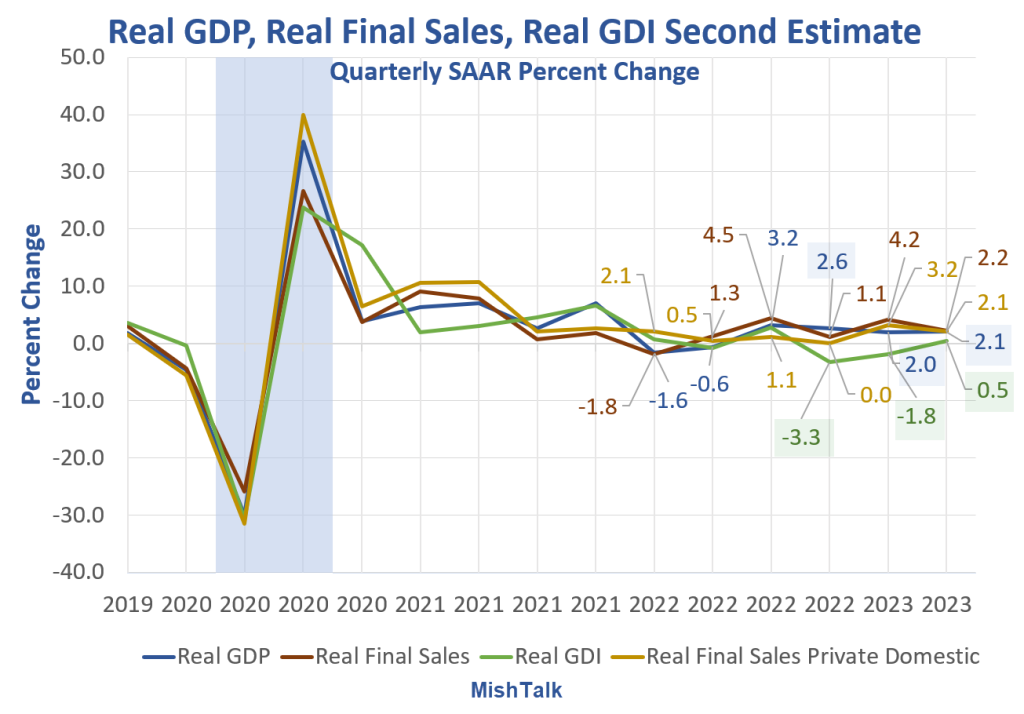
As long as you are making assumptions, if you are rah-rah on the strength of the Biden economy, you may as well assume GDP numbers are correct as well.
My assumption is GDP is flat out wrong and Gross Domestic Income (GDI) numbers are far more likely to be correct than GDP numbers. GDP and GDI are supposed to be the same but aren’t.
What a mess Biden and his Progressive backers have made. And we are forced to suffer the consequeinces of his policies. Or follies!
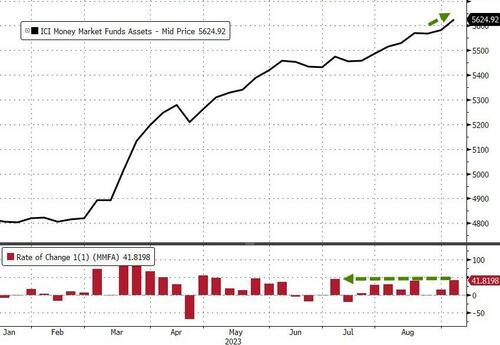
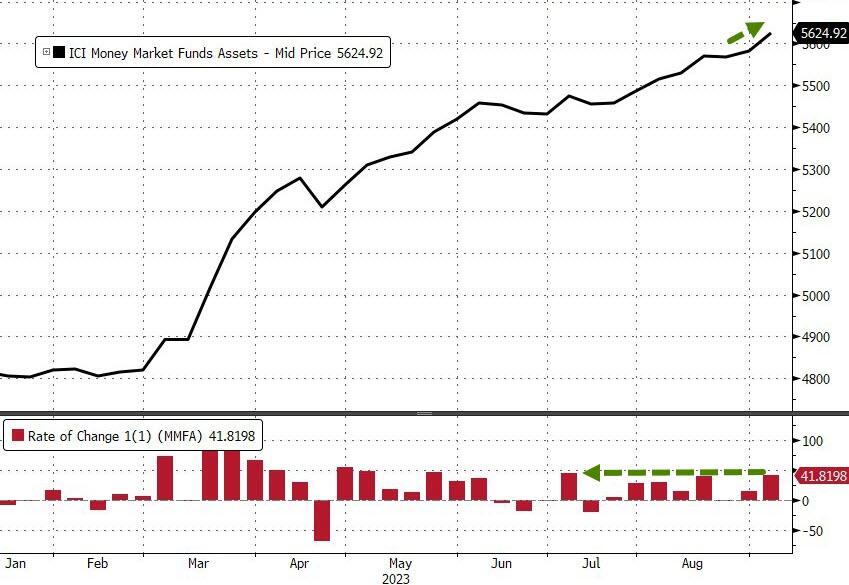
Money-market funds saw inflows for the 7th week of the last 8 with a $42BN jump (the most in 2 months) to a new record high of $5.625TN…
Source: Bloomberg
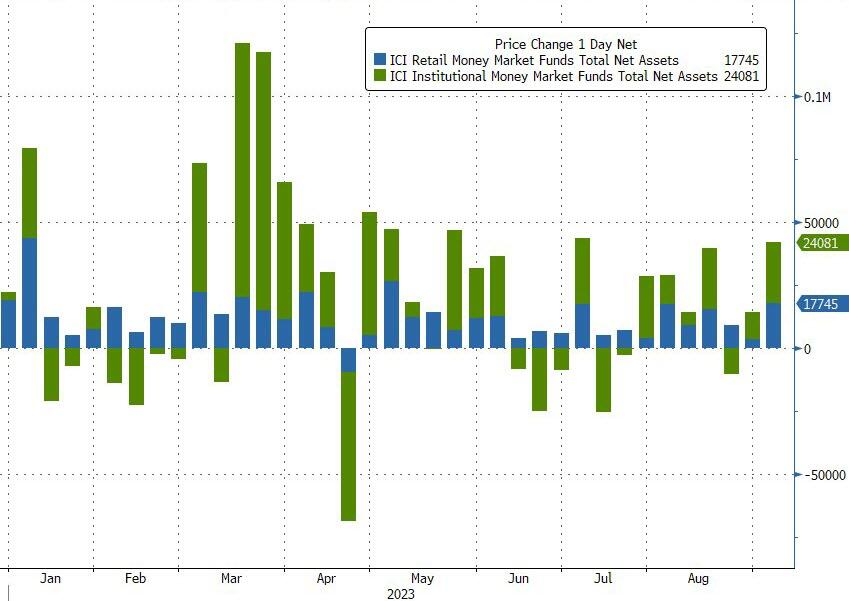
The inflow was dominated by a $24BN increase in Institutional fund assets while Retail also saw a sizable $17.7BN increase…
Source: Bloomberg
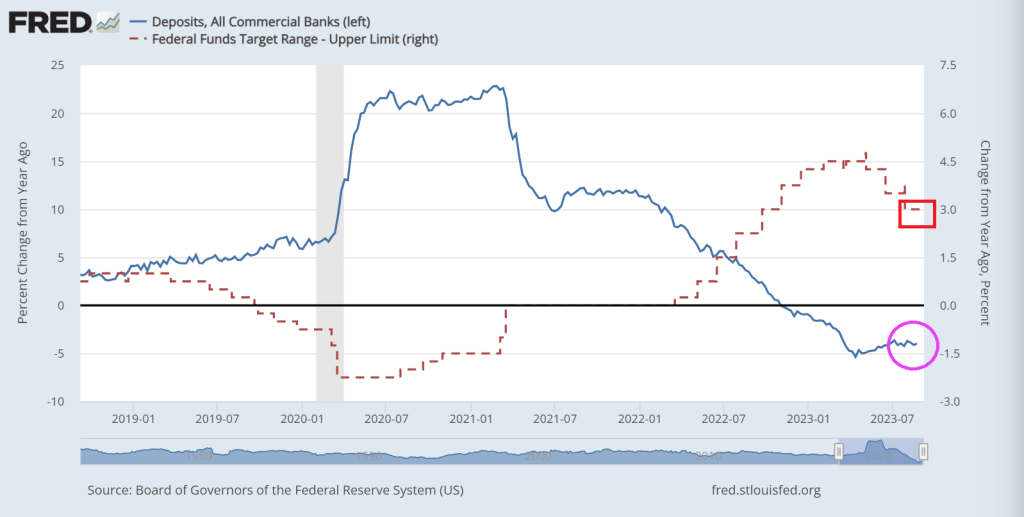
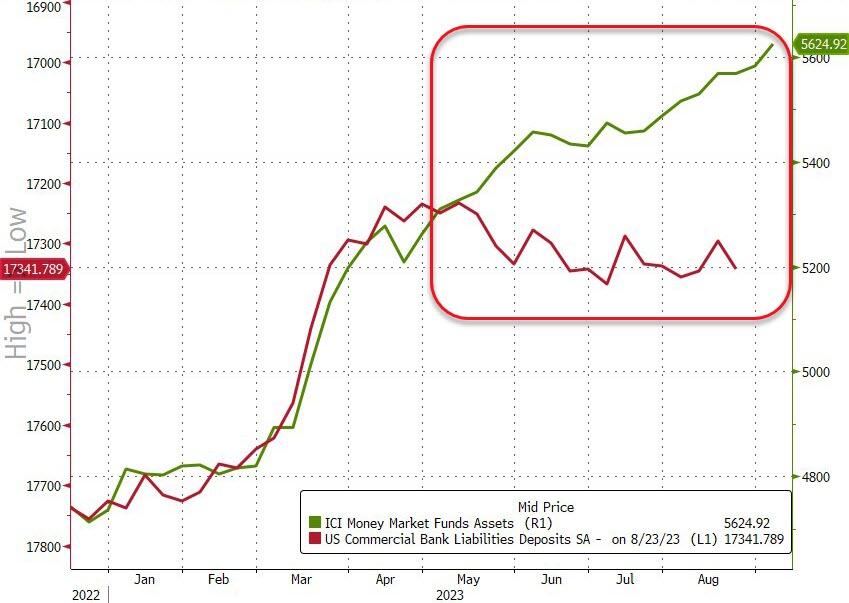
And the divergence between money-market fund assets and bank deposits continues to grow…
Source: Bloomberg
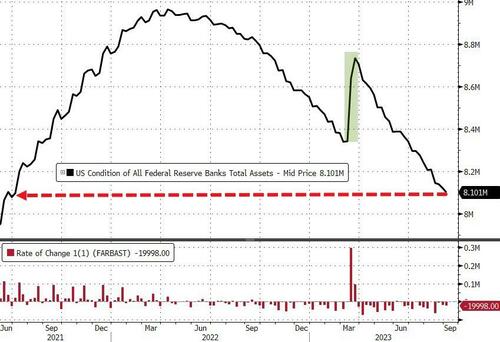
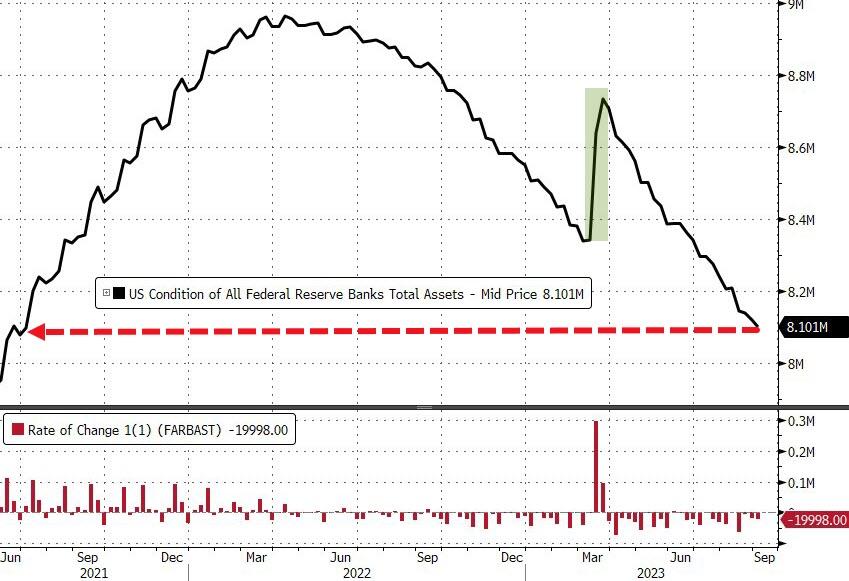
And while we actually saw huge deposit outflows (on a non-seasonally-adjusted basis) – despite The Fed’s seasonally-adjusted deposits increase – The Fed balance sheet shrank by another $20BN last week to its smallest since June 2021…
Source: Bloomberg
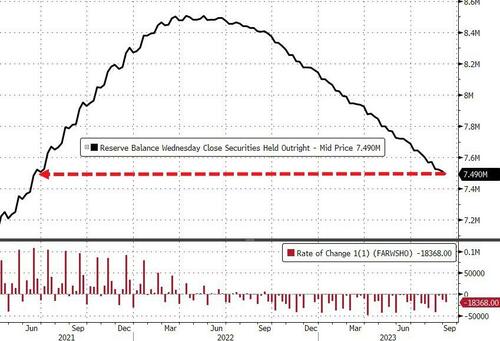
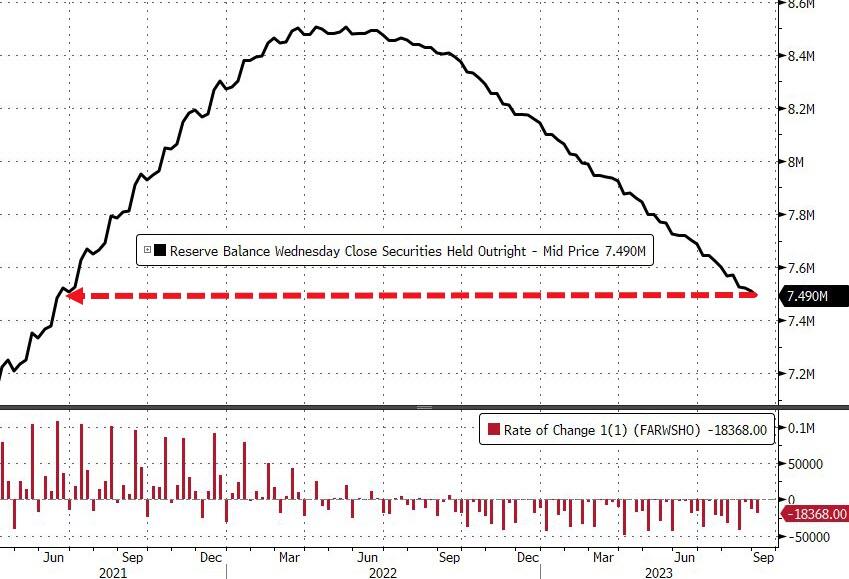
The Fed’s QT program continues apace with$18.4BN sold last week to its smallest since June 2021…
Source: Bloomberg
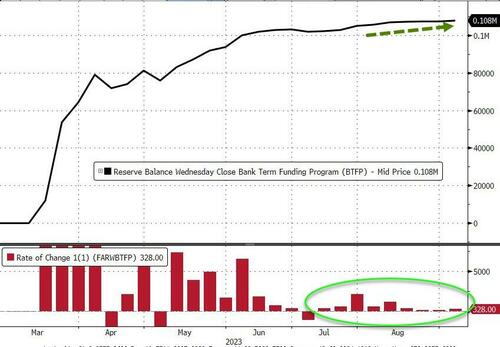
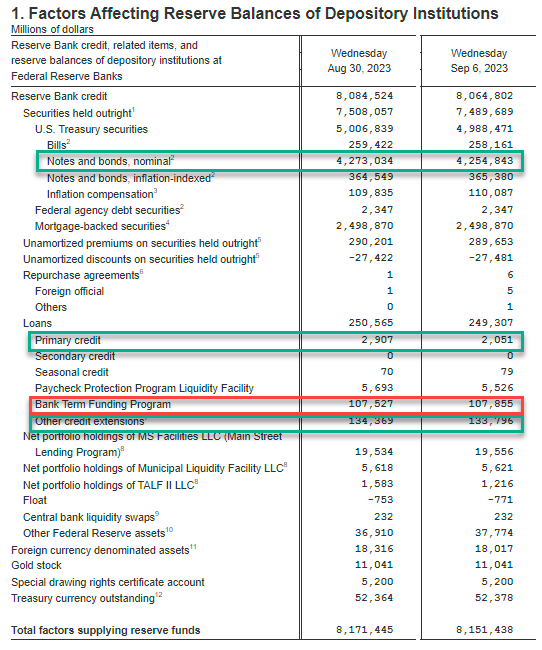
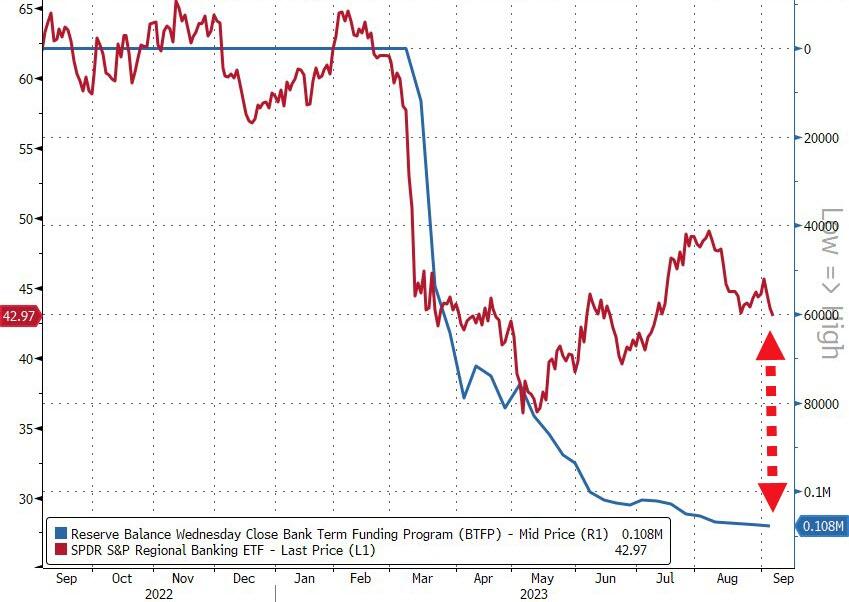
Usage of The Fed’s emergency bank funding facility jumped by $328 Million last week to a new high of $108BN…
Source: Bloomberg
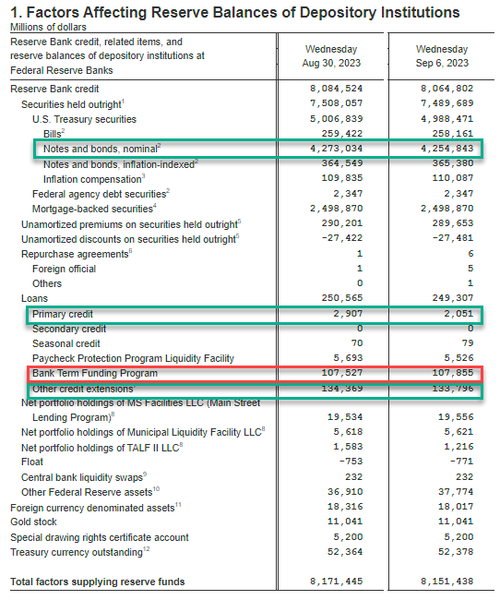
Fed BS weekly change:
Fed balance sheet QT (Notes and bonds decline): $4.255 trillion, down $18,2BN
Discount Window $2.1BN, down $800M from $.29BN
BTFP new record $107.9BN, up $400MM
Other Credit Extensions (FDIC Loans): $133.8BN, down $0.6BN from $134.4BN
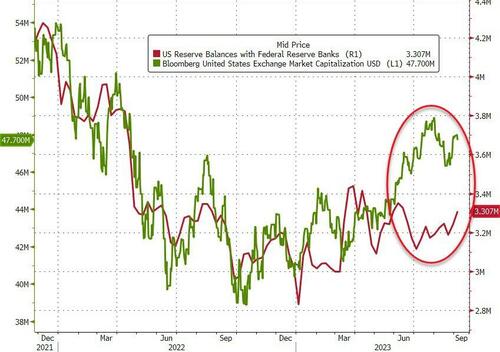
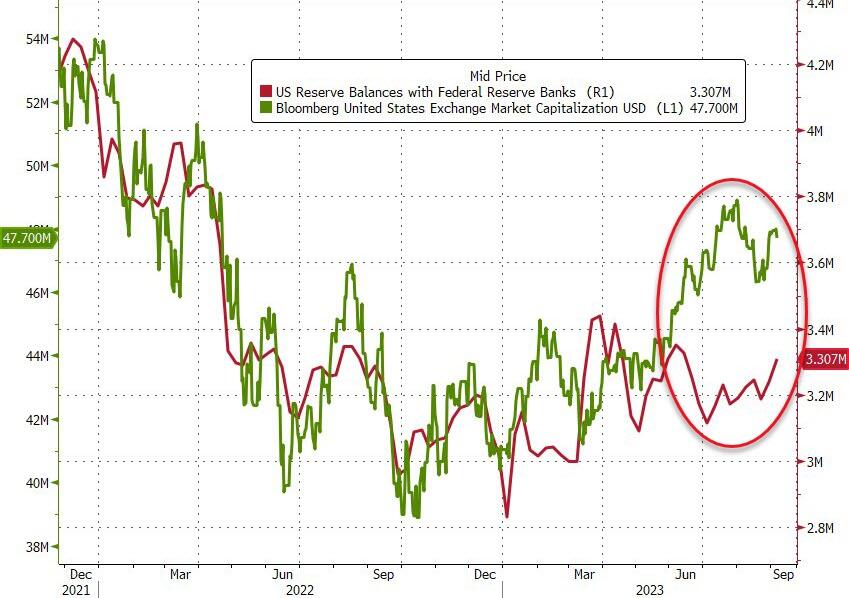
Finally, US equity markets and bank reserves at The Fed have converged a little recently, but the gap remains wide (thanks to the plunge in reverse repo balances)…
Source: Bloomberg
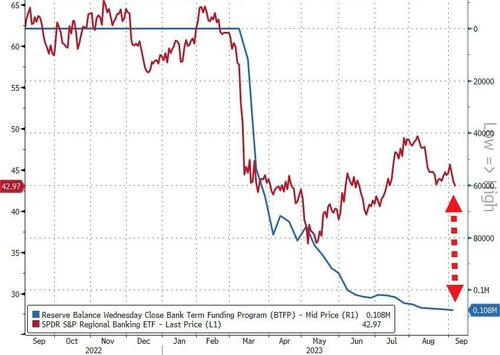
Tick, tock, banks!
Source: Bloomberg
You have six months to figure out how to clean up the $108 Billion hole in your balance sheet that you’re currently paying The Fed’s exorbitant rates to fill.
Bank deposit growth remains negative as The Fed tightens its overly accomodative monetary policy.
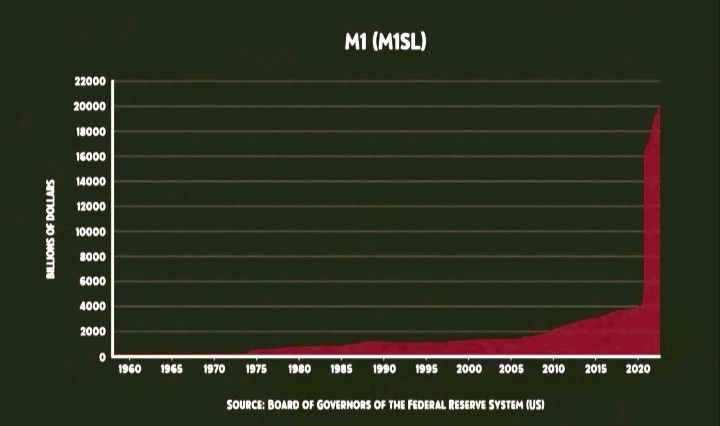
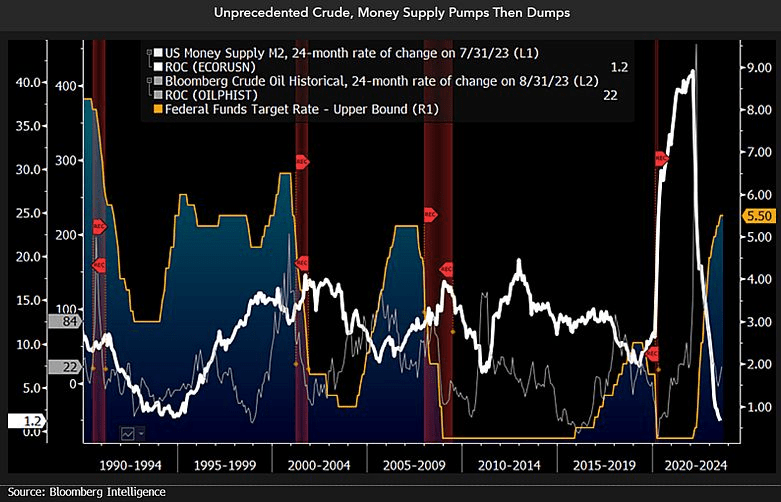
And then we have this chart showing plinging M2 Money (white line fever).
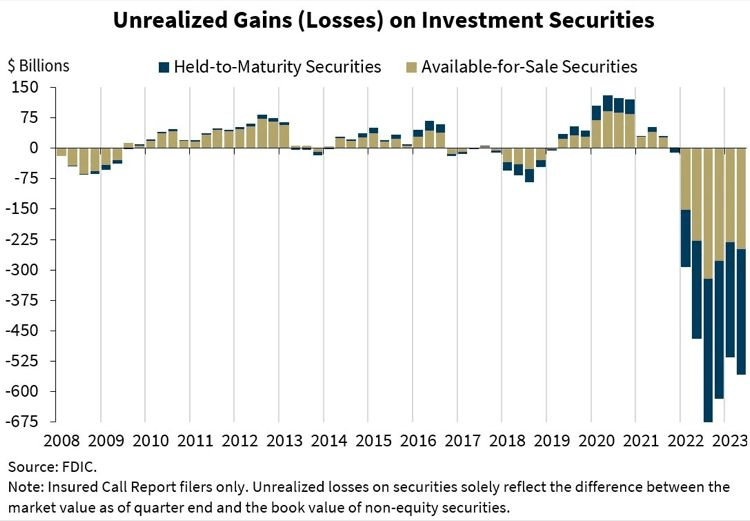
And the horrific unrealized losses on bank’s books.
Bidenomics is failing America. Primarily because Biden was one of the stupidest members of the US Senate. Not to mention nasty. Great President, America! /sarc
As Bidenomics fails to do anything other than make big donors wealthier (green energy companies, big tech and union bosses, etc), we are seeing the impacts of Fed monetary tightening to combat inflation caused by Biden/Pelosi/Schumer’s spending spree.
First, the 10-year REAL Treasury yield is close to breaching 2%.
Second, 30-year mortgage rates are now 7.62%, up over 150% under Bidenomics.
Third, mortgage purchase applications crashed to the lowest level since 1995.
Fourth, the 2-year Treasury yield just breached 5%.
Fifth, the 10Y-2Y yield curve remains deeply inverted.


You must be logged in to post a comment.