Bidenomics! M2 Money Velocity Rises … To Almost Pre-Covid Levels, Fed Balance Sheet Remains Above $8 TRILLION (Biden Energy Secretary Secretly Consulted Top Chinese Energy Official Before SPR Release, Sales To Hunter Biden-Linked Chinese Energy Giant)

I wonder which season the US economy is in, according to President “Chance the Gardener” Biden.

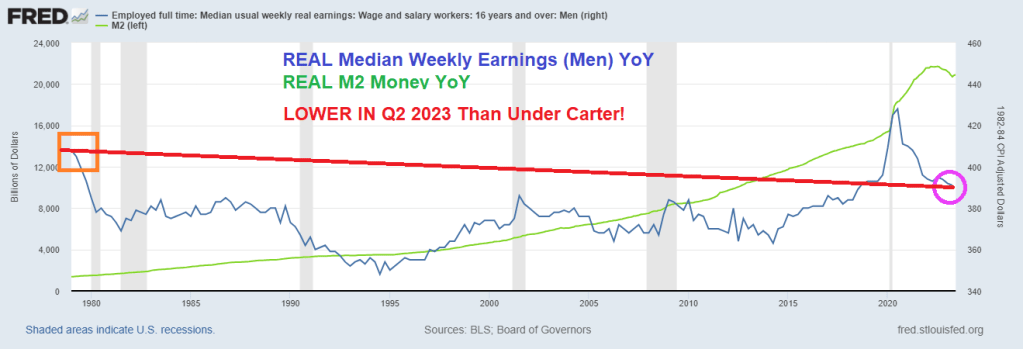
If you believe the recovery talk (from the reckless Covid economic and school shutdowns of 2020), all is well in the (economic) garden. For example, M2 Money Velocity (GDP/M2), is almost back to where it was just prior to the 2020 Covid outbreak and resulting government-caused recession. M2 Velocity was 1.425 in Q4 2019 and was 1.289 for Q2 2023. But ever since The Federal Reserve became hyper intervention in the economy (let’s just start with Bernanke’s massive intervention in late 2008 (red line) and the Fed balance sheet expansion), and it was increased dramatically during the Covid shutdown. And is STILL above $8 trillion!

Before Bernanke and the financial crisis of 2008-2009, M2 Money Velocity was above 2.0. But it has been below 2.0 ever since The Fed’s intervention in 2008.

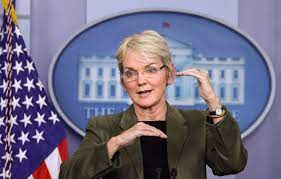
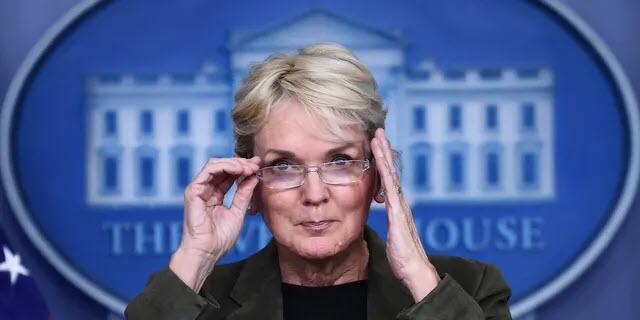
On the energy front, US Energy Secretary Jennifer Granholm, whose catastrophic handling of US energy policy will be one of the most memorable and dire consequences of the Biden era, engaged in multiple conversations with the Chinese government’s top energy official just days before the Biden administration announced it would tap the Strategic Petroleum Reserve (SPR) to combat high gas prices in 2021, the same China whose Hunter Biden-linked energy giant Unipec, which we previously learned had bought millions of barrels from the SPR release.

Granholm called China National Energy Administration Chairman Zhang Jianhua, a longstanding senior member of the Chinese Communist Party, for a half-hour one-on-one conversation on Nov. 21, 2021. Granholm’s calendar also shows an earlier phone call had been scheduled with Jianhua for Nov. 19 but a rep for the former Michigan governor said the first call never took place. Then, on Nov. 23, 2021, the White House announced a release of 50 million barrels of oil from the SPR, the largest release of its kind in U.S. history at the time.

According to Fox News, Granholm’s previously-undisclosed talks with China National Energy Administration Chairman Zhang Jianhua — revealed in internal Energy Department calendars obtained by Americans for Public Trust (APT) and shared with Fox News Digital — reveal that the Biden administration likely discussed its plans to release oil from the SPR with China before its public announcement in the US: yes, China’s Communist Party learned what Biden would be doing before the US did.

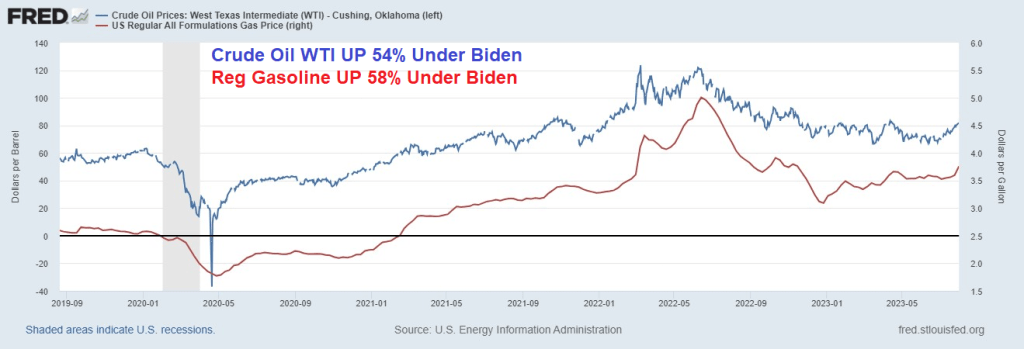
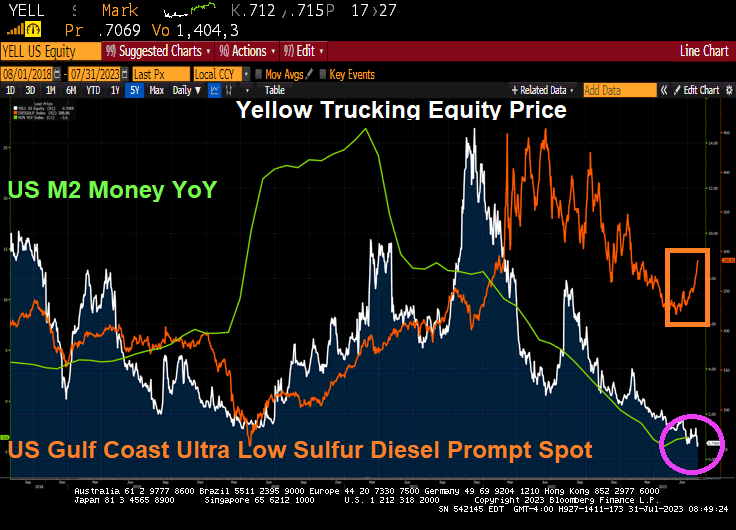
While Biden/Granholm are merrily draining the Strategic Petroleum Reserve, we see that West Texas Intermediate Crude Oil (Cushing) prices are up 54% under Biden and regular gasoline prices are up 58%.

All is sort of well in the garden because The Federal Reserve still has its massive interventionist foot on the gas pedal. Yet, America is on an economic suicide course with its green energy hype.

Frankly, Biden talks like Chance The Gardener from the film “Being There.” Except that Chance the Gardener is a nice person and Biden is reputed to have been the nastiest member of the US Senate. Not to mention the stupidest member of the US Senate. Although I don’t think Chance the Gardener would have taken millions in bribes from foreign countries like China and Ukraine.

Biden The Gardener should be Biden’s re-election slogan! Of course, Chance the Gardener could walk much better than Biden with his dementia shuffle. And Chance was a great gardener, all Biden knows how to do is sell the “Biden Brand” of political influece peddling to foreign countries.

Bidenomics Falsehood: Biden “Created” 400k Jobs Per Month While Trump Lost Jobs (Actually Trump Averaged 1.56 Million Jobs Added Post-Covid While Biden Averaged 400k)

“One of the most cowardly things ordinarily people do, Is to shut their eyes to facts.” – C.S. Lewis

Okay, we know Biden lies constantly and misrepresents facts (hey, he is a politician like Adam Schiff (D-CA). But this graphic praising Bidenomics with Biden having created the most jobs (average per month) since Carter (notice they left out Democrat darling Jimmy Carter!!!). In this absurd graphic, Biden wins by “creating” over 400k jobs per month while Trump lost jobs per month. Riveting … except that it is completely misleading.

Actually, the US economy added 12.53 million jobs after April 2020 (Trump) while Bidenomics created took 2 1/2 years to add 12.56 million jobs. So, Biden took over twice as long to create jobs after Covid than it did under Trump. Simply opening the economy and schools produced that magical claim by Biden. And the National Teacher’s Union and Randi Weingarten worked with Fauci to orchestrate shutting down schools. Blaming Trump for local governments shutting down the economy is pure bunk.

12.53 millions jobs added / 8 months = 1.56 million jobs average per month. Biden? 12.56 million jobs added / 30 months = .43 million jobs average per month. So, Trump averaged more than 3x the job growth post-Covid than Biden.

Here is the “glories of Bidenomics” from the White House. As Biden likes to say, pure malarkey!

I wonder if the Democrat Party is a rebirth of New York City’s Tammany Hall corrupt political movement of the 1800s? Is Biden Boss Tweed? Or is Obama Boss Tweed with Biden as his nasty, dimwitted henchman?

In 1871, Thomas Nast denounces Tammany as a ferocious tiger killing democracy. The image of a tiger was often used to represent the Tammany Hall political movement. Sounds an awful lot like today’s Democrat Party.

Perhaps a fez for Democrats?

US Gasoline Prices Surge Again 6.5% Since 7/23/2023 (Gas Prices UP 60% Under Bidenomics As Strategic Petroleum Reserve DOWN -46% Under Corrupt Joe)

Josef Stalin of the old Soviet Union used to be called County Joe. But Biden has so many possible nicknames: Corrupt Joe, Pay-for-play Joe, Sleazy Joe, Bully Joe, etc. How about Green Joe?

Green Joe (or the Nasty Green Giant?) along with his energy goon Jennifer Granholm, have drained the strategic petroleum reserve by 46% while gasoline prices have soared 60% under Bidenomics.

Gasoline prices have rise over 6.5% just since 7/23/2023.

Trump wants to drain the swamp, Biden/Granholm want to drain the strategic petroleum reserve so we can’t go back to fossil fuels. Biden and Granholm as Fossil Fools

Energy Secretary Jennifer “The Evil Pixie’ Granholm demostrating how she will refill the strategic petroleum reserve. Which she never will, of course.

July Jobs Report Disappoints! Only 187k Jobs Added, Wage Growth Of 4.4% Still Lower Than Core Inflation Rate Of 4.8%, Rent CPI (June) Is Still Roaring At 7.8% YoY (May and June Figures Revised Sharply Lower)

The Federal Reserve is watching July’s jobs report carefully. According to the Bureau of Labor Statistics (BLS), the US economy added 187k jobs in July, less than the expected 200k.

US average hourly earnings continued at 4.4% year-over-year (YoY). However, the last core inflation reading was 4.8% YoY, so real wages continue to decline.

Rent CPI for June was 7.8% YoY.

Here is the rest of the story.

In keeping in with Biden admin’s penchant of constantly fabricating data, both May and June numbers were revised sharply lower of course:

  • May revised down by 25,000, from +306,000 to +281,000
  • June was revised down by 24,000, from +209,000 to +185,000.

To show just how ridiculous the data manipulation is, consider this chart – every monthly payrolls report in 2023 has been revised lower.

And on the disappointing jobs report and massive revisions of past data (the REAL inflation plaguing the nation is The Federal goverment lying about data), the US Treasury 2 year yield dropped like Biden on a flight of stairs.

Here are the faces of Washington DC. Lies, corruption, government for sale to highest bidder, cynacism, oppression, fear mongering, etc. This is Biden’s legacy.

Bidenomics? US Treasury Rates Rise As US Fiscal Deficit Back To Financial Crisis Levels As Tax Revenues Collapse

US Treasury yields are up today along with 30-year mortgage rates. There is a lot happening in bond markets.

It’s been a tumultuous week for yields, with the Bank of Japan’s policy tweak, and the Treasury increasing its funding needs. But Fitch was the weatherman with its US downgrade, telling us about the downpour we can see for ourselves just by taking a glance at the fiscal data. In short, the US faces a perfect storm of a vertiginous fiscal deficit, a near-historically swollen debt load, ballooning interest-rate costs and collapsing tax revenues.

First, the deficit. It’s close to historical wides, bigger than it’s ever been outside of a recession, and almost as wide as it was in the depths of the GFC. It’s the largest in the world in GDP terms, and it is currently heading in the wrong direction. This heaps more pressure on the government debt-to-GDP level, already uncomfortably high at 112%.

Second, tax revenues. These have seen almost their largest annual fall ever, in an economy that’s supposed to be growing at 2.4%.

And then there’s rising interest-rate costs. The total interest expense as a percentage of tax revenue is expected to rise sharply in the next year or two, and make new highs by the end of the decade. However, these CBO forecasts should be taken with a grain of salt as they are based on a 10-year yield of only 3.8% (the ten-year average has been higher than that in every decade bar the 2010s and 2020s).

My former student at University of Chicago’s MBA program, Kevin Smith of Crescat Capital, has this charming chart of state and local income tax receipts collapsing.

There is a view the Treasury is already implementing YCC, based on the fact it has been skewing its issuance towards bills and away from coupons. But issuing more bills is simply the easiest and fastest way for the Treasury to replenish its account at the Fed (the TGA). It was run down to almost zero in the lead-up to the debt-ceiling limit, and has now risen to over $500 billion.

This level of bill issuance is not unusual. The Treasury has an implicit target of about 20% for the amount of bills outstanding as a percentage of total debt. As we can see from the chart below, bills have often been more than 20% of debt outstanding over the last 30 years. Moreover, the Treasury announced this week it was raising its coupon-issuance amounts.

According to the stealth YCC thesis, less longer-dated Treasury issuance implicitly caps longer-term yields, but this has not historically been the case. As the chart above shows, the yield curve typically steepens – not flattens – when there is greater bill issuance – the opposite of what is desired by YCC.

We see the same relationship if we look the duration of US government debt outstanding. When the average duration falls – as it would if issuance is skewed toward bills – the yield curve tends to steepen. The current average duration held by the public is consistent with a steeper, not a flatter, yield curve.

This sounds counter-intuitive. If issuance drives yields, then more issuance at the front-end of the curve versus the longer end – equating to a fall in duration – implies the yield curve should flatten.

But the fact the relationship is the other way implies it’s likely that demand is the more dominant driver of yields in the medium term. There is ready-made demand for bills, from MMFs, etc, so when supply increases, demand rises to meet it, suppressing the yield-curve impact.

It’s thus hard to argue the Treasury is engaging in yield curve control. But that does not detract from the rising possibility it will need to be implemented in some shape or form eventually.

Banks and the Fed are reducing their Treasury holdings, while foreigners now collectively own about $5 trillion less USTs – about 10% – than they did in 2021. At the same time the “Treasury put” means large fiscal deficits are likely to become a feature, not a bug. That means inflation is likely to become embedded.

Fiscal profligacy and elevated price growth are a combustible mix and a road to prohibitively high yields via rising term premium. Yield capping thus starts to look like the endgame.

How it’s done is another matter, whether it’s the Fed co-opted to cap yields as it was in WWII, Treasury buybacks, or financial repression, whereby domestic institutions are forced to hold more government debt. Whatever way, at some point yield curve control in the US is becoming increasingly likely – by stealth or otherwise.

But never fear! Janet “Too Low For Too Long Creating Asset Bubbles” Yellen is still US Treasury Secretary.

Gov Gone Wild! Wild Federal Spending, Massive Deficits And Soaring Interest Payments On Debt Requires More Fed Intervention (Bidenomics At Work!)

The US Fiscal position is very bad and the US is beginning to look like  a third world economy.  And with Biden and Democrat AGs filing indictments against Biden primary Presidential oppoonent, that country is Venezeula! Like skyrocketing interest on the Federal debt to pay for green energy hustlers and the Ukraine war.

The US Federal Deficit continues to grow as seen in the charts below. A $2.25 Trillion dollar run  rate deficit is significantly worse than the $1.3 Trillion that was recorded in Fiscal 2022. This level of  deficit is unprecedented in an economy with low unemployment and theoretically no recession.  Naturally, we ask just how big the deficit will be if we have either a recession or a crisis? In the dotcom  bust, the GFC and the COVID shock, the deficit expanded massively.

Taking Garic’s math one step further, the US incurred a deficit of $1.3T in Fiscal 2022 (September). If  the current run rate is sustained that would imply an annualized deficit of $2.9 Trillion. 

Of course, one big driver of this deficit is the interest cost incurred by the Government itself. It is rapidly  approaching a $1 Trillion dollar run rate which means the Government is spending more in interest than  on national defense. As you can see in the schedule below, the Fed’s rate hiking campaign has been very  expensive for the US Government since a large portion of the federal debt is in shorter maturities which  currently pay ~ 5.3% in interest. As recently as September of 2021, many of these same securities had  much lower interest cost – as low as only 10-30 basis points. 

Looking at the chart above, we wonder: is there anything about this that looks remotely sustainable? We  are at that point in the movie where raising interest rates to fight inflation actually makes things (including  inflation) worse. Worse because deficits swell and will need to be monetized. 

Furthermore, the issue is acute because the US Government uses the short-term bond market to Fund  most of its debt. As the chart below from Gavekal Research/Macrobond shows, the Government needs  to roll over $6 Trillion of maturing notes in 2023 and $3 Trillion of notes in 2024. This does not take  into account any of the roughly $1.2 Trillion of bonds and notes that will be sold into the market by the  Fed if Quantitative Tightening continues. Nor does it account for the ever increasing US Federal Deficit  which will easily exceed $2.2 Trillion this year. 

In short, the US Government has some serious funding challenges particularly when we consider that  foreigners have been net sellers of our bonds since 2014.

IT’S THE DEBT, STUPID 

On January 19, 2023 the US Federal Government hit its debt ceiling of $31.4 Trillion. Extraordinary  spending measures kicked in which allowed the Government to keep operating. This lasted until June  when Treasury Secretary Yellen informed Congress that a debt default was imminent if the ceiling was  not raised. 

After the usual political posturing, Congress did two things: (i) they agreed to place a two year cap on  spending increases for a small portion of the budget that amounted to only 7% of the total budget. (like  placing a band aid on a gaping wound); and (ii) they agreed to suspend the debt limit and to not replace  it with another figure until January of 2025. We do not think they have ever.

Put it differently, let’s call this “Government Gone Wild!”

Bidenomics! Mortgage Demand Decreases 3.0% From One Week Earlier, But Purchase Demand Down 26% From Last Year, Down -45% Under Biden While Mortgage Rates Are UP 134% (US Interest Expenses Surged By 50% In Past Year To Nearly $1 Trillion On Annualized Basis)

Inflation under Biden has been very painful for the US middle class and low wage workers. That inflation has resulted to surging mortgage rates thanks to The Fed’s counterattack.

The result? Mortgage rates are up 134% under Bidenomics, while mortgage purchase demand is down -45% since Biden was selected. And mortgage refinancing demand is down a staggering -90%!

Mortgage applications decreased 3.0 percent from one week earlier, according to data from the Mortgage Bankers Association’s (MBA) Weekly Mortgage Applications Survey for the week ending July 28, 2023.

The Market Composite Index, a measure of mortgage loan application volume, decreased 3.0 percent on a seasonally adjusted basis from one week earlier. On an unadjusted basis, the Index decreased 3 percent compared with the previous week. The Refinance Index decreased 3 percent from the previous week and was 32 percent lower than the same week one year ago. The seasonally adjusted Purchase Index decreased 3 percent from one week earlier. The unadjusted Purchase Index decreased 3 percent compared with the previous week and was 26 percent lower than the same week one year ago.

US interest expenses have surged by about 50% in the past year, to nearly $1 trillion on an annualized basis.

Look at the share of net worth by the top 1% as Treasury borrows more money.

Oddly, Biden is not talking about about putting US government policies up for sale to the highest bidders. But don’t worry. Biden is the King of Corruption in the District of Corruption (Washington DC).

Bidenomics! Wheels Come Off The “Strong Jobs” Myth As Job Openings Drop To 2 year Low (Number Of Hires And Quits Plunge As Fed Withdraws Monetary Stimulus)

The wheels are coming off the Bidenomics recovery.

US job openings (JOLTS) keep declining as The Fed withdraws its Covid sugar splash of monetary stimulus and raise The Fed’s target rate.

For those enthralled by the narrative that AI will cause a margin-busting corporate revolution as millions of well-paid, middle-management employees are replaced by a cheap “bullshitting” AI algo, then today’s latest JOLTS report may come as a bigger shock than the big drop in job openings from one month ago. That’s because after unexpectedly dumping by 496K in May (a number which has been revised far worse of course), the BLS just reported that in June the number of job openings was practically unchanged, dropping by just 34K, to 9.582MM from a downward revised 9.616 million. And while the monthly change was modest after the downward revision of course, the total was dragged to the lowest level since April 2021.

The number was about 1.4 million below the 11 million from a year ago and below the consensus estimate of 9.6 million, a rare miss in a series which has been best known for decisively beating Wall Street’s expectations.

According to the BLS, the largest increases in job openings was in health care and social assistance (+136,000) and in state and local government, excluding education (+62,000). Job openings decreased in transportation, warehousing, and utilities (-78,000), state and local government education (-29,000), and federal government (-21,000)

The slide in the number of job openings meant that after rising to the highest since January 2023 in April, in June the number of job openings was just 3.7625 million more than the number of unemployed workers, the lowest since Sept 2021.

Said otherwise, after rising to 1.82 openings for every worker in April, in June the number dropped to just 1.61, which would have been the lowest level since Oct 2021 if it weren’t for last month’s sharp downward revision.

Yet even as the number of job openings dropped only modestly from the (sharply) downward revised print for May (because under Biden, no number is ever revised stronger), conflicting data remained and in June, the number of people quitting their jobs – an indicator traditionally associated with labor market strength as it shows workers are confident they can find a better wage elsewhere – unexpectedly tumbled by 295K to just 3.772MMthe biggest monthly drop since May 2021.

According to the BLS, the number of quits decreased in several industries, with the largest decreases in retail trade (-95,000), health care and social assistance (-75,000), and construction (-51,000). The number of quits increased in arts, entertainment, and recreation (+20,000).

And just in case some still believe Biden’s strong jobs lie, the number of hires also tumbled in June, crashing by 326K – the biggest monthly drop since July 2020…

… to 5.905MM, the lowest since February 2021.

Of course, as we have explained on multiple occasions previously, none of the above data actually matters or is credible for the simple reason that the response rate of the JOLTS survey is stuck at a record low 31.2%. Which means that only those who actually have job openings to report do so, while two-thirds of employers are either non-responsive or their mail is quietly lost in the mail.

Wheels. Of massive corruption and debauchery.

Bidenomics (Or Yellenomics)! Real Weekly Earnings For Men LOWER Under Biden Than Jimmy Carter! (Men’s Real Weekly Earnings DOWN -9% Since Q2 2021 While M2 Money UP 31%)

President Jimmy Carter is usually the bar for terrible Presidents. Under Carter, the US experienced economic stagnation and soaring inflation. At least it led to the election of Ronald Regan!

So, Biden’s much mentioned Bidenomics have produced REAL MEDIAN WEEKLY EARNINGS FOR MEN that is currently below 1979 levels under Jimmy Carter.

Even worse for Bidenomics, REAL MEDIAN WEEKLY EARNINGS GROWTH FOR MEN was -4.45% In April 2023, while the last reading prior to Covid under Trump was 6.674% YoY in February 2020. So, Bidenomics isn’t even back to Trump levels for men.

I like this chart which I call “Yellenomics” because it illustrates The Fed’s Folly of money printing and its impact on real earnings. After the Trump wage growth boom, real median weekly earnings for men has been steadily declining.

Women, on the other hand, did show a gain since Carter, but still lower than the last month before Covid struck. Women’s real median weekly earnings growth YoY since Q2 2021 are down -5%. So, Bidenomics has been less sucky for women than men.

Reminds me of The Yardbird’s classic “I’m A Man.” Worse off under Biden than under Jimmy Carter. Although The Yardbird’s “Over Under Sideways DOWN” is more emblematic of Bidenomics.

Bidenomics should be renamed Corruptionomics given Biden’s habit of selling government influence to anyone willing to waive a few million.

Another Bidenomics Casualty! Trucking Giant Yellow Ceases Operations (Unions + Diesel Fuel Costs = FAILURE)

Biden: “Its my Presidency and I’ll lie if I want to.” As well as demolish the economy to serve his Progressive green energy agenda.

One of the casualties? Yellow trucking. Carrier Yellow Corp. ceased all operations at 12 p.m. Sunday, according to a notice on the gates at its terminals. Its stock price is now sub $1.

Separate internal documents showed the procedures for closing the facilities as well as “talking points” to be used when informing union employees not to show up for their shifts. The documents indicated the company plans to issue a public statement Monday updating “the state of the company and the operation.”

On Friday, Yellow laid off most of its nonunion employees in areas like customer service, information technology and sales. The company stopped making pickups earlier in the week and has been delivering the remaining freight in its network ahead of what appears to be a permanent closure.  

After months of negotiations with its Teamsters workforce, the carrier has been unable to reach terms over proposed operational changes it has said were required for its survival. In a breach of contract lawsuit filed last month regarding the matter, the company said it could be out of cash as soon as mid-July.

Most are expecting Yellow to announce it will file for bankruptcy Monday.

Not surprising given the disastrous earning per share. The culprits? High energy costs and a hostile Teamsters Union (labor costs and practices).

A closer look at Yellow’s earning per share deterioration as Biden’s energy folicies has taken hold and crushed the life out at Yellow Trucking.

Biden! They call him The Sleeze!