Former Obama economist and Harvard University President Lawrence Summers says that the FTX meltdown whiffs on an Enron-like scandal.
“A lot of people have compared this to Lehman. I would compare it to Enron,” Summers told Bloomberg Television’s “Wall Street Week” with David Westin. “The smartest guys in the room. Not just financial error but — certainly from the reports — whiffs of fraud. Stadium namings very early in a company’s history. Vast explosion of wealth that nobody quite understands where it comes from.”
Lehman, Enron? How about Solyndra, one of the biggest political boondoggles in US history.
About two years after the Obama administration co-signed $535 million loans to Solyndra, the company filed for bankruptcy on September 1, 2011. A 2015 report from the Department of Energy found major flaws in Solyndra’s business practices and claimed the company made “inaccurate and misleading” statements to obtain the loan guarantees, and also found fault with Department of Energy oversight.
Which brings us to FTX and Sam Bankman-Fried (the son of Stanford law professor Barbara Fried and co-founder of the political fundraising organization Mind the Gap, which advocates for progressive political candidates and funds get-out-the-vote groups). Sam Bankman-Fried was a big Biden donor. What are the odds that The Federal government will impartially investigate SBF and the FTX fiasco? ZERO!
Why did FTX run into trouble?
FTX has a native cryptocurrency token called FTT, which traders use for operations like paying transaction fees. Last year, Mr. Zhao sold his stake in FTX back to Mr. Bankman-Fried, who paid for it partially with FTT tokens.
On Nov. 2, the crypto publication CoinDesk reported on a leaked document that appeared to show that Alameda Research, a hedge fund run by Mr. Bankman-Fried, held an unusually large amount of FTT tokens. FTX and Alameda are meant to be separate businesses, but the report claimed that they had close financial ties.
Binance announced on Nov. 6 that it would sell its FTT tokens “due to recent revelations.” In response, FTT’s price plummeted and traders rushed to pull out of FTX, fearful that it would be yet another fallen crypto company.
FTX scrambled to process requests for withdrawals, which amounted to an estimated $6 billion over three days. It seemed to enter a liquidity crunch, meaning it lacked the money to fulfill requests.
How did Binance intervene?
On Tuesday, Binance said it had reached an agreement to bail out FTX by buying the company. But, Mr. Zhao added in the announcement, “Binance has the discretion to pull out from the deal at any time.”
In a concurrent announcement, Mr. Bankman-Fried said the deal would protect customers and allow FTX to finish processing their withdrawals. He attempted to dispel rumors of conflict between FTX and Binance, adding, “we are in the best of hands.”
His last quote made me laugh.
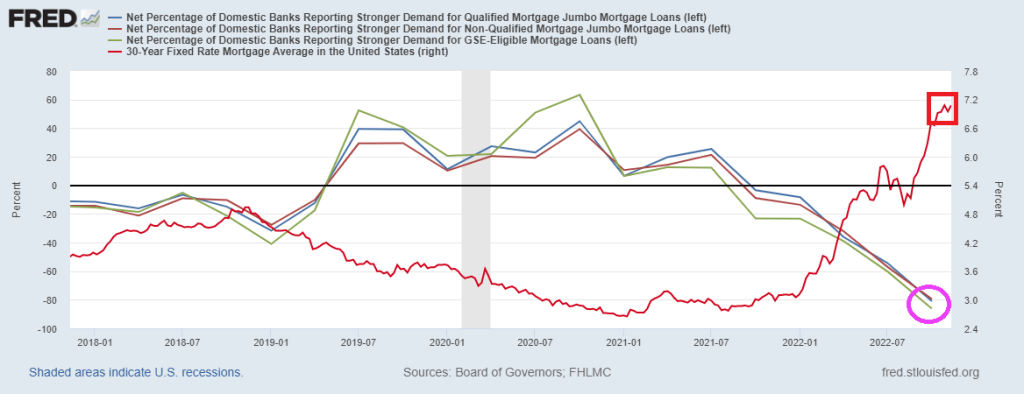
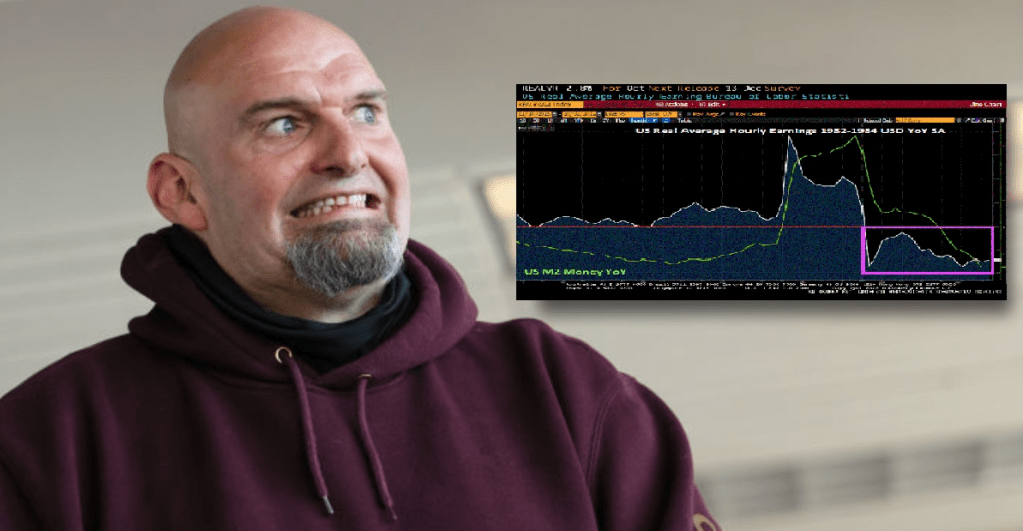
Bitcoin plunged another -6% today as gold (gold line) and the S&P 500 (yellow line) rose. Moral to the story? Nothing has been the same since The Fed started tightening.

All cryptos are down today (except Litecoin). The three biggest, Bitcoin, Ethereum and Binance Coin are all down over 5%.

Why does Sam Bankman-Fried remind me of the late John Belushi?

Here is Sam Bankman-Fried defending his actions to his law professor Mom.


You must be logged in to post a comment.