Will The Fed keep on printing?
Under Joe Biden, The Federal Reserve has jacked-up M2 Money by 12.2%. And with the fear of economic destruction under Biden, Bitcoin is up 265%.
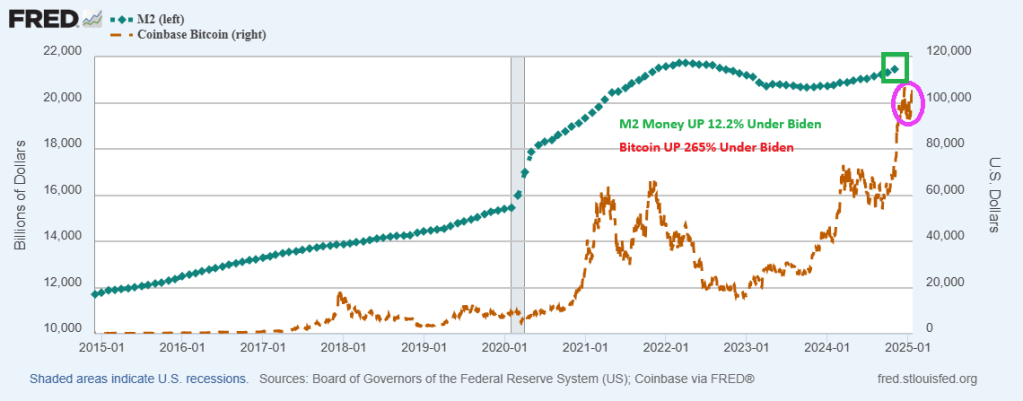
With Trump being sworn in, That’s all, folks!

Confounded Interest – Anthony B. Sanders
Financial Markets And Real Estate
Will The Fed keep on printing?
Under Joe Biden, The Federal Reserve has jacked-up M2 Money by 12.2%. And with the fear of economic destruction under Biden, Bitcoin is up 265%.
With Trump being sworn in, That’s all, folks!
Today’s jobs report was smoking hot! As in 256k jobs added.
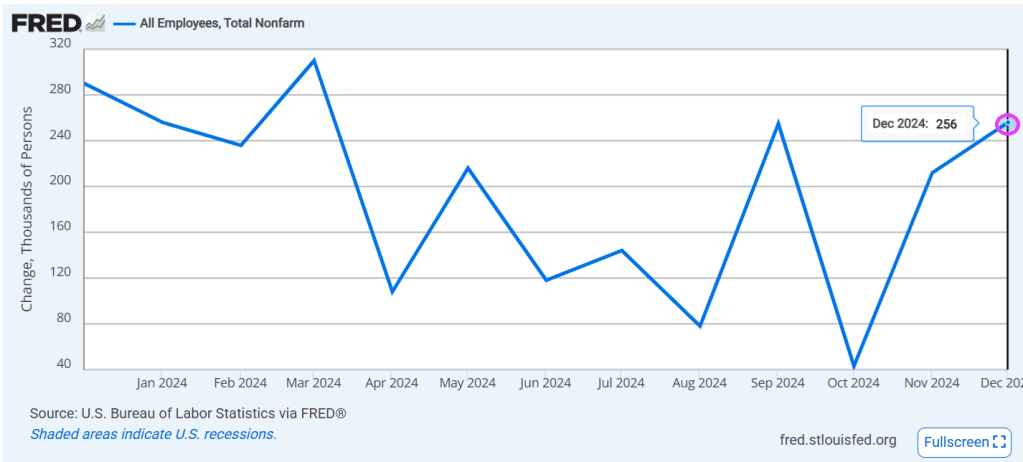
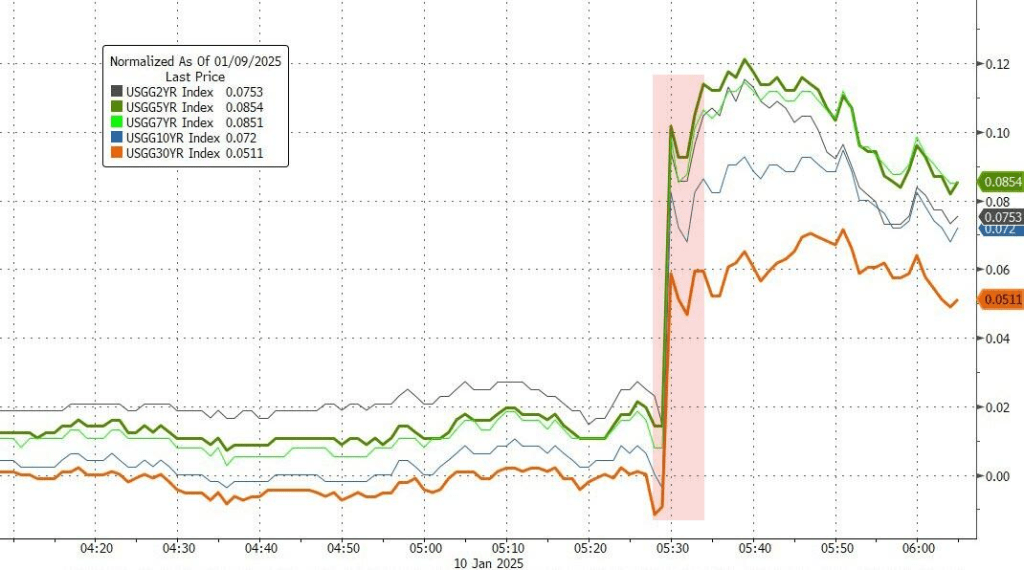
With the strong payrolls number, the likelihood of a Fed rate cut is falling.

And with the jobs report, rates are a soarin’!
On a different note, LA Fire Department Supplies Were Sent To Ukraine Over The Past Two Years & They Are Forced To Battle Flames With Women’s Handbags As Buckets Under Gavin Newsom’s Leadership.
At least the smelts are safe in Los Angeles!

Was Freddie King correct? Is the US economy going down??
The US Treasury yield curve (10Y-2Y) has inverted to the positive side after a prolonged NEGATIVE inversion (from July 6, 2022 to Sept 5, 2024) marking the longest period of negative inversion since August 18, 1978 – May 1, 1980. Each negative inversion was followed by a recession.

The UST 10Y-3M yield curve tells a similar tale. The 10Y-3M curve inverts prior to recessions but goes positive just prior to recessions.

Yes, if the yield curve is a good predictor of recession, the US economy is going down.

Freddie King is playing a Gibson ES-355TDC guitar.
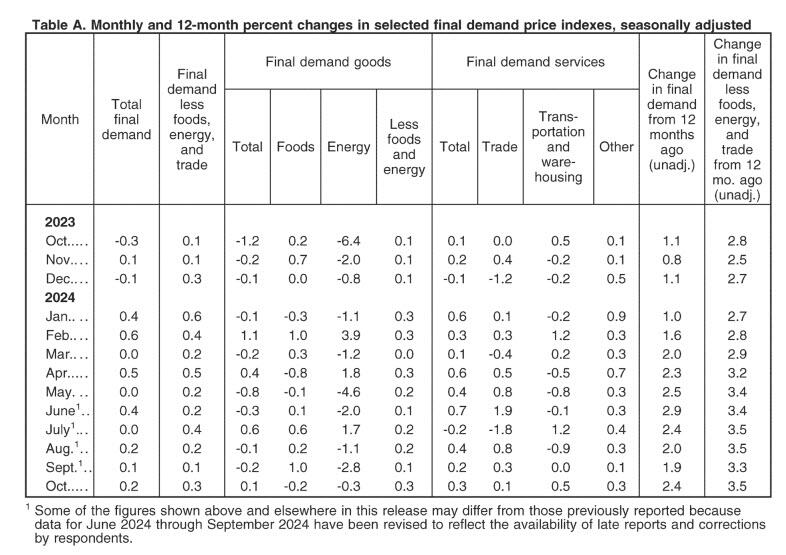
Slippin’ into (inflation) darkness … again. Producer price index (PPI) FINAL DEMAND rose 2.4% YoY in October.
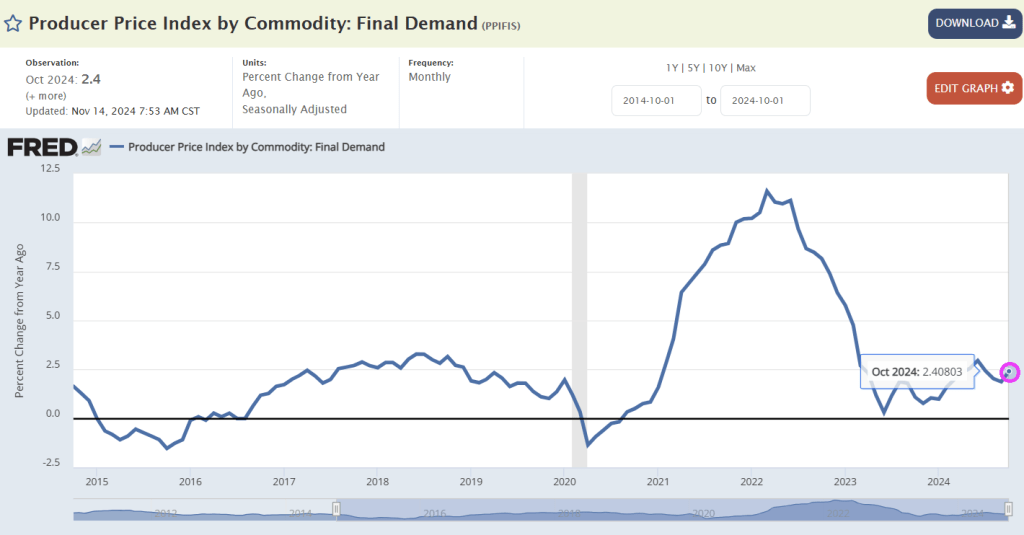
After yesterday’s in line – but really cooler than whispered – CPI which restored hope in a December rate cut, all eyes are on this morning’s PPI print to boost dovish hopes that the Fed’s easing cycle would remain on track. It was not meant to be, however, as the PPI came in hotter than expected across the board on both a monthly and annual basis.
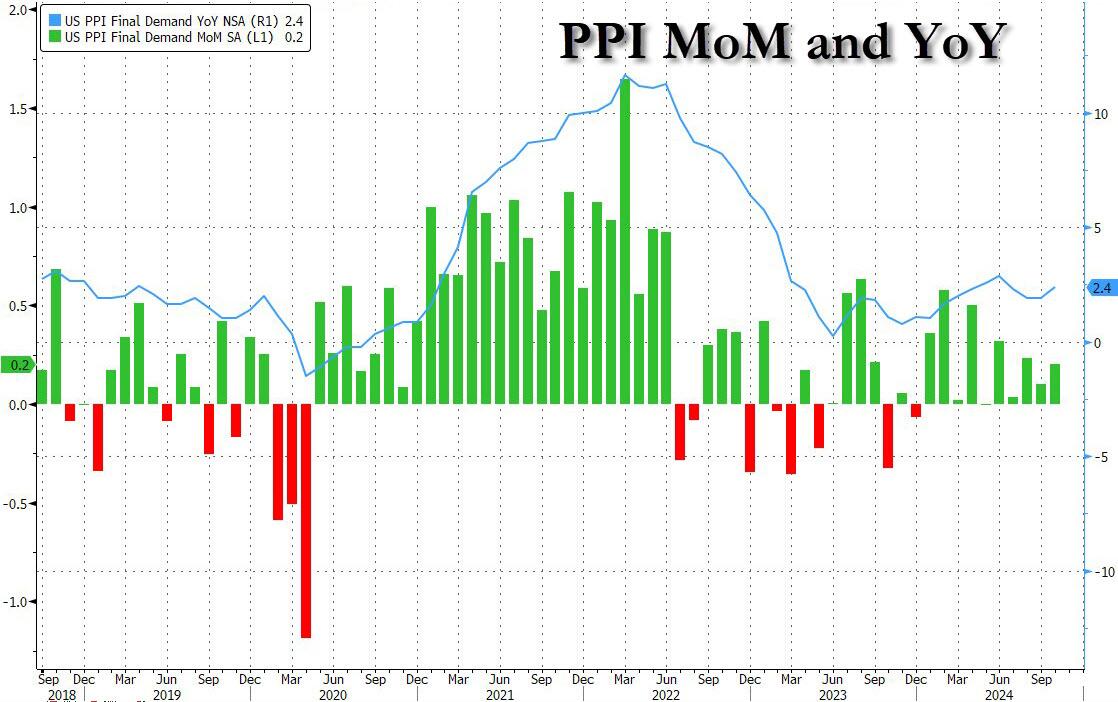
Starting at the top, headline PPI rose 0.2% MoM (in line with the +0.2% expected) but September was revised higher from 0.0% to 0.1%; meanwhile on an annual basis, headline PPI rose 2.4%, higher than the 2.3% expected, with the last month also revised higher from 1.8% to 1.9%.
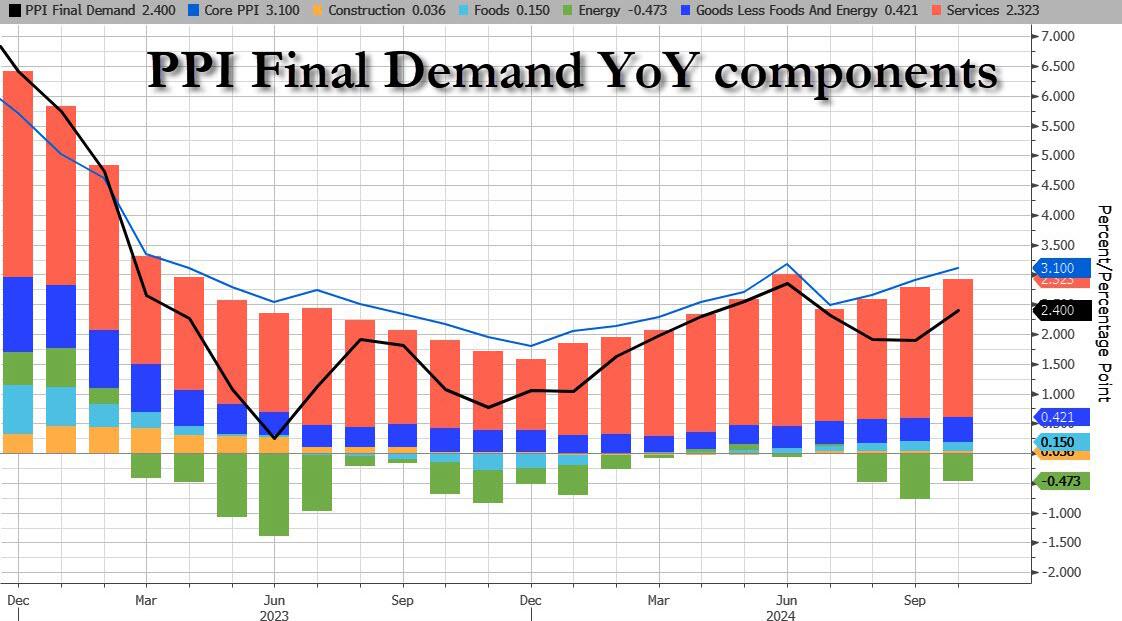
Unlike last month when a drop in energy prices weighed heavily on the headline PPI number, this month energy subtracted just 0.02% from the final print, the lowest detraction since July. Meanwhile, Services added a hefty 0.179% to the bottom line number.
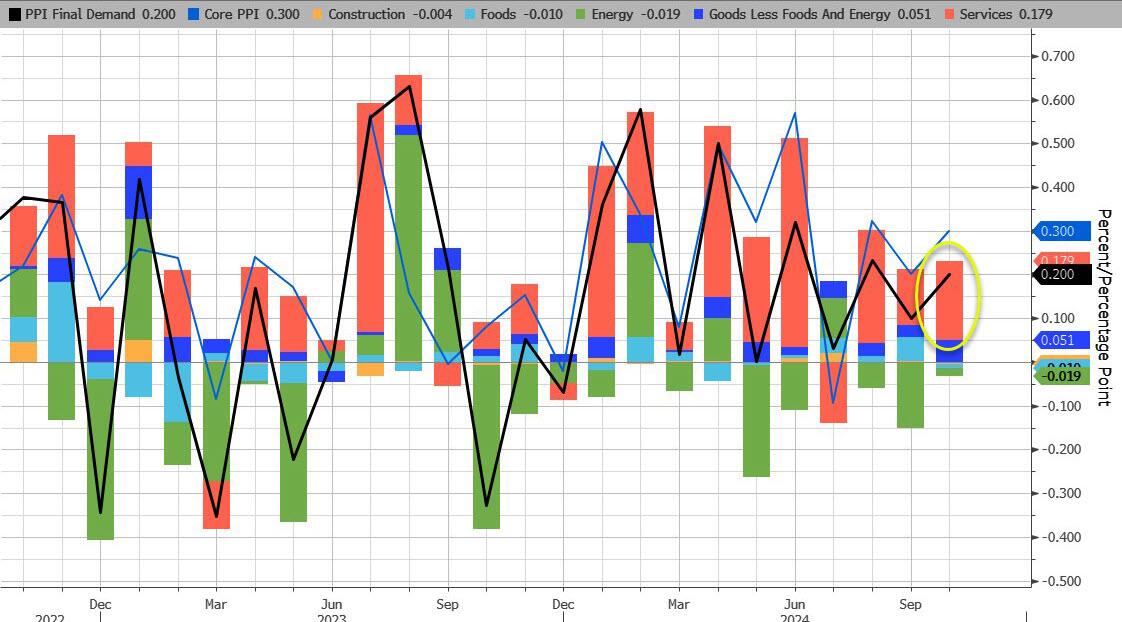
Indeed, according to the BLS, most of the rise in final demand prices can be traced to a 0.% advance in the index for final demand services. Prices for final demand goods inched up 0.1%, the first increase in the index since July.
Taking a closer look at the components:
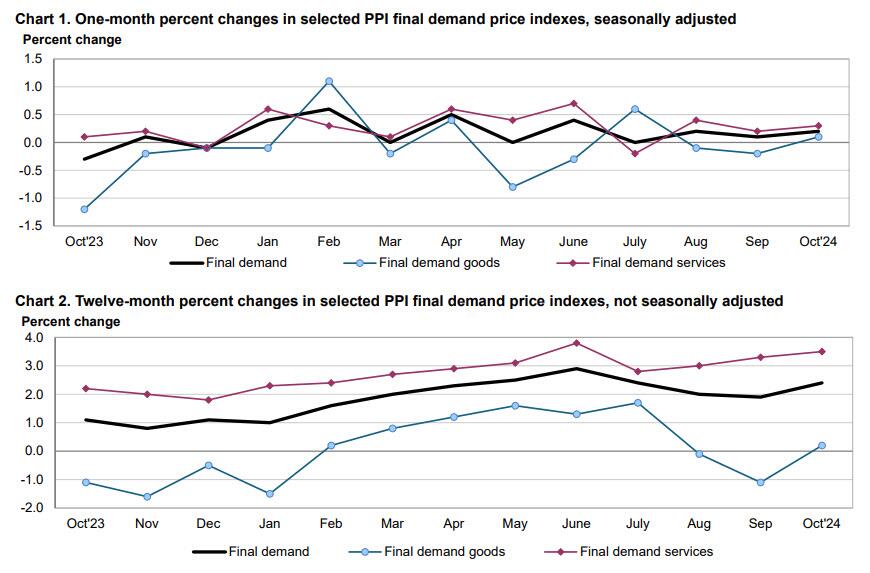
Final demand services: The index for final demand services increased 0.3 percent in October after rising 0.2 percent in September. Over three-fourths of the broad-based advance in October is attributable to prices for final demand services less trade, transportation, and warehousing, which moved up 0.3 percent. The indexes for final demand transportation and warehousing services and for final demand trade services also increased, 0.5 percent and 0.1 percent, respectively. (Trade indexes measure changes in margins received by wholesalers and retailers.)
Product detail:
Final demand goods: The index for final demand goods inched up 0.1 percent in October following two consecutive decreases. The advance can be traced to a 0.3-percent rise in prices for final demand goods less foods and energy. Conversely, the indexes for final demand energy and for final demand foods declined 0.3 percent and 0.2 percent, respectively.
Product detail:
Even more problematic for the doves, however, is that core PPI jumped to +3.1% YoY (hotter than the 3.0% exp) with the prior month revised higher to 2.9% from 2.8%. This was the second hottest print going back to March 2023 with just the June outlier surge hotter than October…
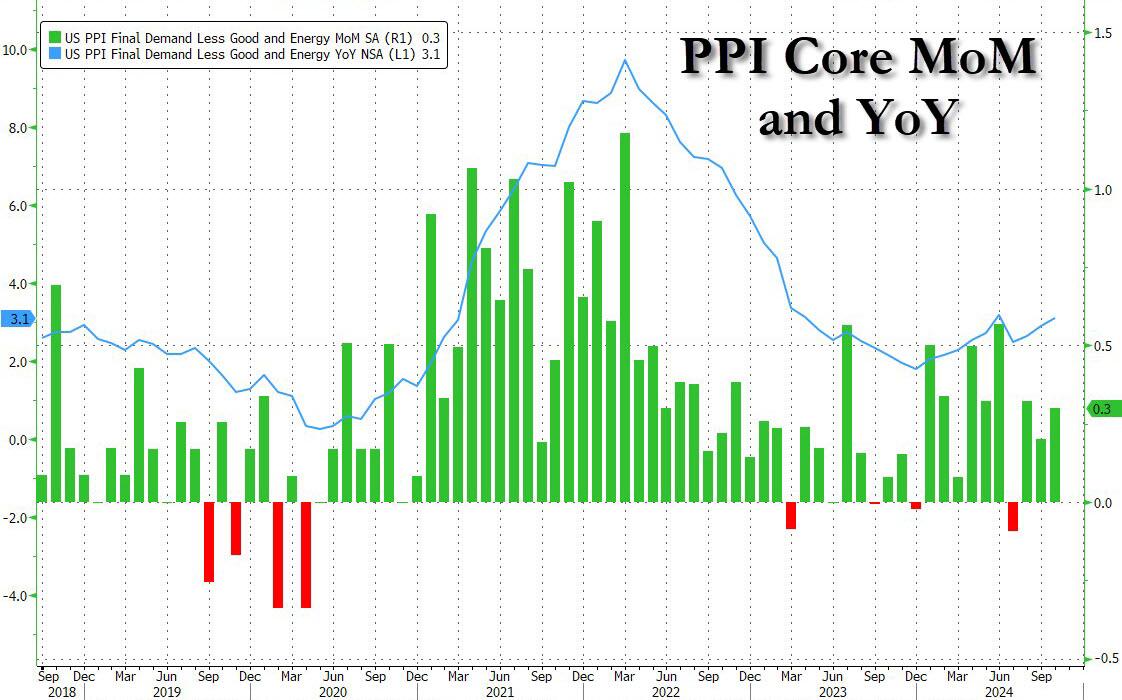
… as sticky Services costs continue to rise.
The hotter than expected PPIs have pushed yields and the dollar higher, even as the market waits to see the details of what impact today’s numbers will have on the Fed’s preferred core PCE metric – according to UBS key PPI components to PCE look hot – although Bloomberg noted a big jump in air passenger services (3.2%), which suggests some upside risks (i.e., 0.3% core PCE).
The most notable takeaway from the data appears to be the increase in final demand for services in October, which is similar to the factors that increased CPI yesterday — shelter, food and energy, which are components the Fed cannot control with interest rates.
Bottom line: this is a long way from the Fed’s mandated 2%, and it’s moving in the wrong direction, something which has not been lost on the market, where Treasury curves are flattening after the data, which suggests traders are wavering over the prospects of a December rate cut. That has yet to be reflected in rates markets — bets have been trimmed but marginally, not enough to really change the swaps market outlook as of now. According to BBG’s Vince Cignarella, sizeable block trades are going through Treasuries, mostly in the five-year tenor and some ten-year tenors, which looks like positioning for higher yields and flatter curves.
The US is the expensive tower of power … but it should be cheap. Getting rid of coal power was idiotic and The Left’s fear of nuclear power is laughable.
EIA data by user classification, chart by Mish.

Rising energy bills have forced companies to scale back industrial operations, threatening a greater drag on the economy.
As of May, electrical energy costs are up 24.4 percent from a year ago. Producer Price Index (PPI) data suggests things are getting worse.
Please consider US Industrial Complex Is Starting to Buckle From High Power Costs
Europe’s fertilizer plants, steel mills, and chemical manufacturers were the first to succumb. Massive paper mills, soybean processors, and electronics factories in Asia went dark. Now soaring natural gas and electricity prices are starting to hit the US industrial complex.
On June 22, 600 workers at the second-largest aluminum mill in America, accounting for 20% of US supply, learned they were losing their jobs because the plant can’t afford an electricity tab that’s tripled in a matter of months. Century Aluminum Co. says it’ll idle the Hawesville, Kentucky, mill for as long as a year, taking out the biggest of its three US sites. A shutdown like this can take a month as workers carefully swirl the molten metal into storage so it doesn’t solidify in pipes and vessels and turn the entire facility into a useless brick. Restarting takes another six to nine months. For this reason, owners don’t halt operations unless they’ve exhausted all other options.
At least two steel mills have begun suspending some operations to cut energy costs, according to one industry executive, who asked not to be identified because the information isn’t public. In May, a group of factories across the US Midwest warned federal energy regulators that some were on the verge of closing for the summer or longer because of what they described as “unjust and unreasonable” electricity costs. They asked to be wholly absolved of some power fees—a request that, if granted, would be unprecedented.
Michael Harris, whose firm Unified Energy Services LLC buys fuel for industrial clients, says costs have risen so high that some are having to put millions of dollars of credit on the line to secure power and gas contracts. “That can be devastating for a corporation,’’ he says. “I don’t see any scenario, absent explosions at US LNG facilities’’ that trap supplies at home, in which gas prices are headed lower in the long term.
EIA Average Electricity Cost Cents

EIA Cost Data January 2021 vs May 2022
Those prices are through May 2022. Much electrical energy comes from natural gas.
US Natural Gas Futures

US gas prices fluctuated wildly in June and July. I suspect the average price is 7.33 or so for both months. Things are decidedly worse in Europe.
EU Natural Gas Price

From 25 or even 50 to 200 is one hell of a leap. It’s somewhere between 300% and 700% depending on your starting point vs 100% or so for the US.
Let’s now check the latest PPI data for a look at where things are and more importantly headed.
PPI Electrical Power Index 2020-Present

From pre-pandemic to January of 2021, the PPI electrical power index was flat. It has since surged on a relatively steady pace.
From May to July the index went from 231 to 238. That tacks on another three percentage points since the EIA report.
PPI Electrical Power Index 1991-Present

Long Term Trend
The long-term trend does not exactly look pretty.
And as Bloomberg noted, Century Aluminum Co. says it’ll idle the Hawesville, Kentucky, mill for as long as a year, taking out the biggest of its three US sites.
Reflections on Beer
Regarding the price of aluminum, please note America’s Beer CEOs Have Had It With the Trump-Era Aluminum Tariffs
The beer industry uses more than 41 billion aluminum cans annually, according to a Beer Institute letter to the White House dated July 1.
“These tariffs reverberate throughout the supply chain, raising production costs for aluminum end-users and ultimately impacting consumer prices,” according to the letter signed by the CEOs of Anheuser-Busch, Molson Coors, Constellation Brands Inc.’s beer division, and Heineken USA.
This letter to the president comes amid the worst inflation in more than 40 years and just months after aluminum touched a multi-decade high. Prices for the metal have since eased significantly.
Whatever victory beer makers and drinkers may have with aluminum prices may not last with US aluminum plants shutting down.
Then again, the cure for everything is likely to be a huge recession.
Zero Consumer Inflation
I am pleased to report there was no consumer inflation in July.
For discussion, please consider CPI Month-Over-Month Was Unchanged, Year-Over-Year Up 8.5 Percent
The CPI report resulted in a nonsensical Twitter debate on the meaning of zero. For the record, assuming you believe the numbers, there was indeed zero inflation month-over-month.
The accurate rebuttal is: One month? So what?
Moreover, zero is not as good as it looks. All of it was due to a 7.7 percent decline in the price of gasoline. And year-over-year inflation was a hot 8.5 percent.
Meanwhile, rent and food keep rising and the price of rent will be sticky. Gasoline is more dependent on recession and global supply chains.
Food Prices Rise Most Since February 1979
For more on the price of food, please see Food at Home is Up 13.1 Percent From a Year Ago, Most Since February 1979
For more on rent, please note Tennant’s Unions Demand Biden Declare a National Emergency to Stop Rent Gouging
For more on producer prices please see Producer Prices Decline For the First Time Since the Pandemic Due to Energy
Although energy declined, electricity didn’t.
Spotlight on Fed Silliness
The above reports and this one industrial costs puts a spotlight on the silliness of the Fed’s focus on consumer inflation as if that’s all that matters.
The Fed has blown three consecutive bubbles trying to produce two percent consumer inflation while openly promoting raging bubbles in assets and missing the boat entirely on industrial matters.
I would like to see Kamala Harris explain why mortgage purchase applications are down -60% under Biden/Harris Presidency. Other than a word salad answer. Or Cottage Cheese.
Mortgage applications decreased 17.0 percent from one week earlier, according to data from the Mortgage Bankers Association’s (MBA) Weekly Applications Survey for the week ending October 11, 2024.
The Market Composite Index, a measure of mortgage loan application volume, decreased 17.0 percent on a seasonally adjusted basis from one week earlier. On an unadjusted basis, the Index decreased 17 percent compared with the previous week. The seasonally adjusted Purchase Index decreased 7 percent from one week earlier. The unadjusted Purchase Index decreased 7 percent compared with the previous week and was 7 percent higher than the same week one year ago.

The Refinance Index decreased 26 percent from the previous week and was 111 percent higher than the same week one year ago.

Housing prices are up 34.2% under Biden/Harris while mortgage rates are up 138.6%.

Biden/Harris will be remembered for many things, mostly BAD. Uncontrolled immigration, crime out of control, endless wars, grossly incompetent government administrators, 200k+ missing immigrant children, etc. But wreckless inflation coming from insane government spending takes the cake. And it is heating up again, with the help of The Feral Reserve. Yes, The FERAL Reserve.
Under Biden/Harris, prices are WAY up, real weekly earnings are WAY down.
Gas: +38.2%
Electricity: +31.3%
Fuel oil: +37.4%
Airfare: +24.5%
Hotels: +42.4%
Groceries: +22.1%
Eggs: +69.2%
Baby food: +31%
K-12 food: +69.7%
Rent: +22.9%
Transportation: +31.1%
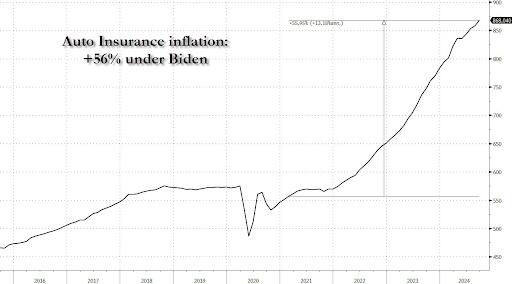
Car insurance: +56.5%
Real average weekly earnings: -3.4%
For the 52nd straight month, core consumer prices rose on a MoM basis in September (+0.3% MoM – hotter than the 0.2% expected) – the strongest since March. That left Core CPI YoY up 3.3%, hotter than the 3.2% expected…
The headline CPI also printed hotter than expected (+0.2% MoM vs +0.1% MoM exp), with the YoY CPI up 2.4% (hotter than the 2.3% expected but lowest since Feb 2021)…
Core Services and Food costs surged in September…
Overall, headline consumer prices are up over 20% (5.1% p.a.) since the Biden-Harris admin took over, which compares to around 8% (1.97% p.a) during Trump’s first term…
The so-called SuperCore CPI also increased on a YoY basis to +4.6%…
A surge in Transportation Services costs (record high auto insurance) and Medical Care Supplies lifted Super Core…
Why is the cost of auto insurance up 56% since Biden and Harris took over?
Real wages are down since the start of the Biden-Harris administration…
Finally, we note that money supply is resurgent once again, suggesting The Fed’s confidence in CPI’s decline may be misplaced…
Could we really replay the ’70s once again?
Will that really be Powell’s legacy? Or will the timing of this resurgence in inflation be perfectly timed to coincide with Trump’s election victory… and offer a perfect patsy for who is to blame?
Hey Big Spender! (Federal Government).
The US government now pays out on average $3bn in interest expenses per day…If the Fed cuts interest rates by 1%-point and the entire yield curve declines by 1%-point, then daily interest expenses will decline from $3bn per day to $2.5bn per day.

Even worse, unfunded Federal liabilities total $219 trillion while total US assets total only $213 trillion. In other words, if China (for example) forced us to pay off our unfunded liabilities like Social Security, Medicare, etc., we couldn’t.

Notice how NO politician ever discusses The Federal goverment spending LESS money. Particularly not Joe “The fool on the hill” Biden or Kamala “Word salad Kammie” Harris.

What a long, strange trip it has been under the gross economic mismanagement by the Biden/Harris team.
First, market participants are pricing in nearly 250 basis points (or 2.5%) in rate cuts by Jan 2026. Down to 3% from the cuurent rate of 5.50.
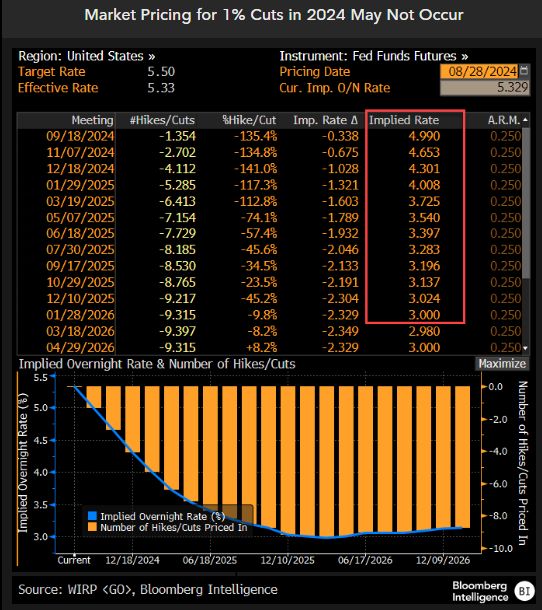
Why? The economy is a shambles due to bad economic policies by Harris/Biden and their Congressional stooges, especially Schumer in the Senate and Pelosi in the House. Hence, The Fed will feel pressure to lower rates. Although I don’t think that it will happen.
Of course, the Philly Fed disclosed that the Biden/Harris administration overstated jobs added by almost 1 million jobs in Q2. I would love to see Harris interviewed about that and watch her deflect and break into gales of laughter. How do American workers feel about Biden/Harris overstating jobs gains by almost 1 million jobs?? Isn’t that fraud?
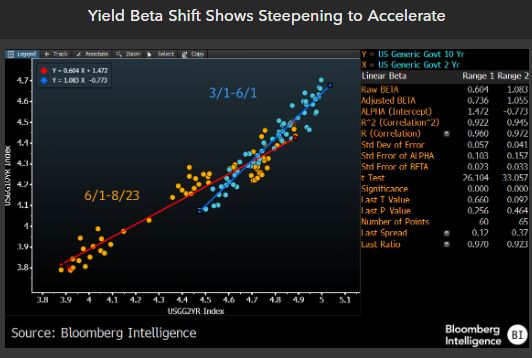
Yield beta is expected to accelerate.
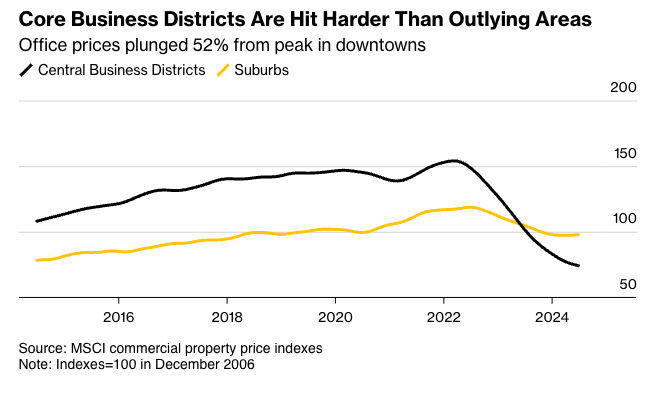
Downtown? I know a place where the crime and congestion isn’t so bad, the suburbs.
Commercial real estate market challenges are more severe for older office towers in downtown metro areas than those outside city centers. The mismatch between funding needs and available credit in a high-interest-rate environment has also intensified the strain on building owners, as elevated tower vacancy rates persist across many markets due to the ongoing trend of remote work becoming the norm.
Aging business districts from Los Angeles to Chicago to Boston of zombie towers with high vacancy rates that have no use in today’s economy.
Big landlords, including Brookfield, Blackstone, and Starwood Capital Group, have walked away from older downtown towers in recent quarters.
The latest data from MSCI shows office values in metro areas have crashed 52% from their highs. Some of the worst declines have occurred in San Francisco, Manhattan, Washington, and Boston.
Between 2019 and 2023, about $557 billion of value evaporated from US offices due to a multi-year slide in demand, with older towers quickly falling out of favor with companies, according to an estimate by economists at Columbia and New York universities. CBRE Group noted that only 2% of towers in the US are considered top-tier, with rents 84% higher than the rest of the market.
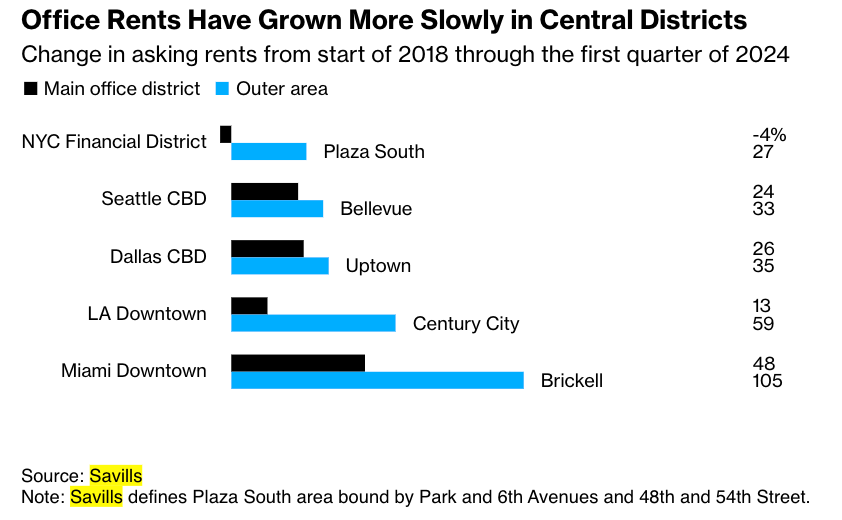
Data from brokerage Savills shows office rents in business districts have grown slower than rents for similar buildings outside metro areas.
The move to new towers highlights how, for decades, the bubbles in legacy downtown districts, fueling economies, have ended for now, and older towers will have to be torn down.
To be very frank. It’s a crisis. Democrats running the crime-ridden metro area are delusional and blinded by their woke religion as the city’s population recently crashed to a 100-year low, and violent crime remains a major issue.
We’ve had conversations with multiple folks at wealth management and investment banking firm Stifel Financial about the latest shift of operations outside the dying business district to a new tower in a much safer and newer district. At first, Stifel contemplated leaving the city for the suburbs because far-left Democrats in City Hall could not enforce law and order.
CRE foreclosures are on the rise.

Don’t forget about Soros-funded district attorneys not enforcing the law in large cities. Expect more of the same if Harris/Walz win the election.


You must be logged in to post a comment.