President Biden was expected yesterday to propose a cap of 5% on annual rent increases for tenants of major apartment landlords, and he did. Whether it can happen is something else.
As the White House communicatedon Tuesday, the administration is looking for Congress to pass legislation for landlords with more than 50 units in their portfolios, that being the proxy for institutional owners, although it would also affect private investors, family offices, and others that might own at least that many units. According to administration calculations, the total pool would cover 20 million rental units.
The law would then give landlords a choice. They could either restrict annual rent increases to no more than 5% a year or they would forfeit the ability to take fast depreciation of rental housing. There would be an exception for new construction or “substantial renovation or rehabilitation.”
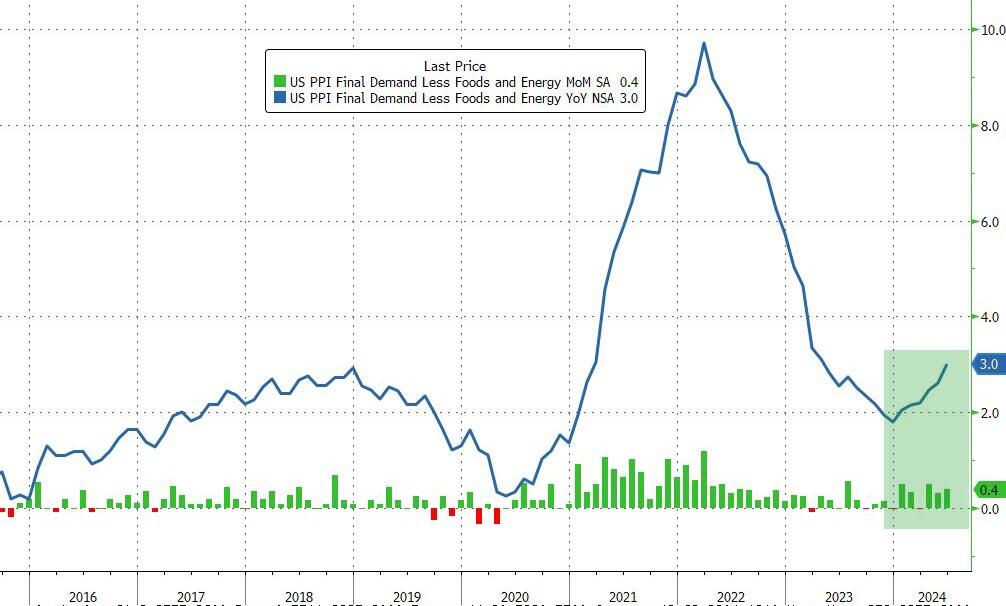
Core PPI rose by 0.4% MoM (double the 0.2% exp), sending the YoY price rise up by 3.0% (also the hottest since March 2023)…
Source: Bloomberg
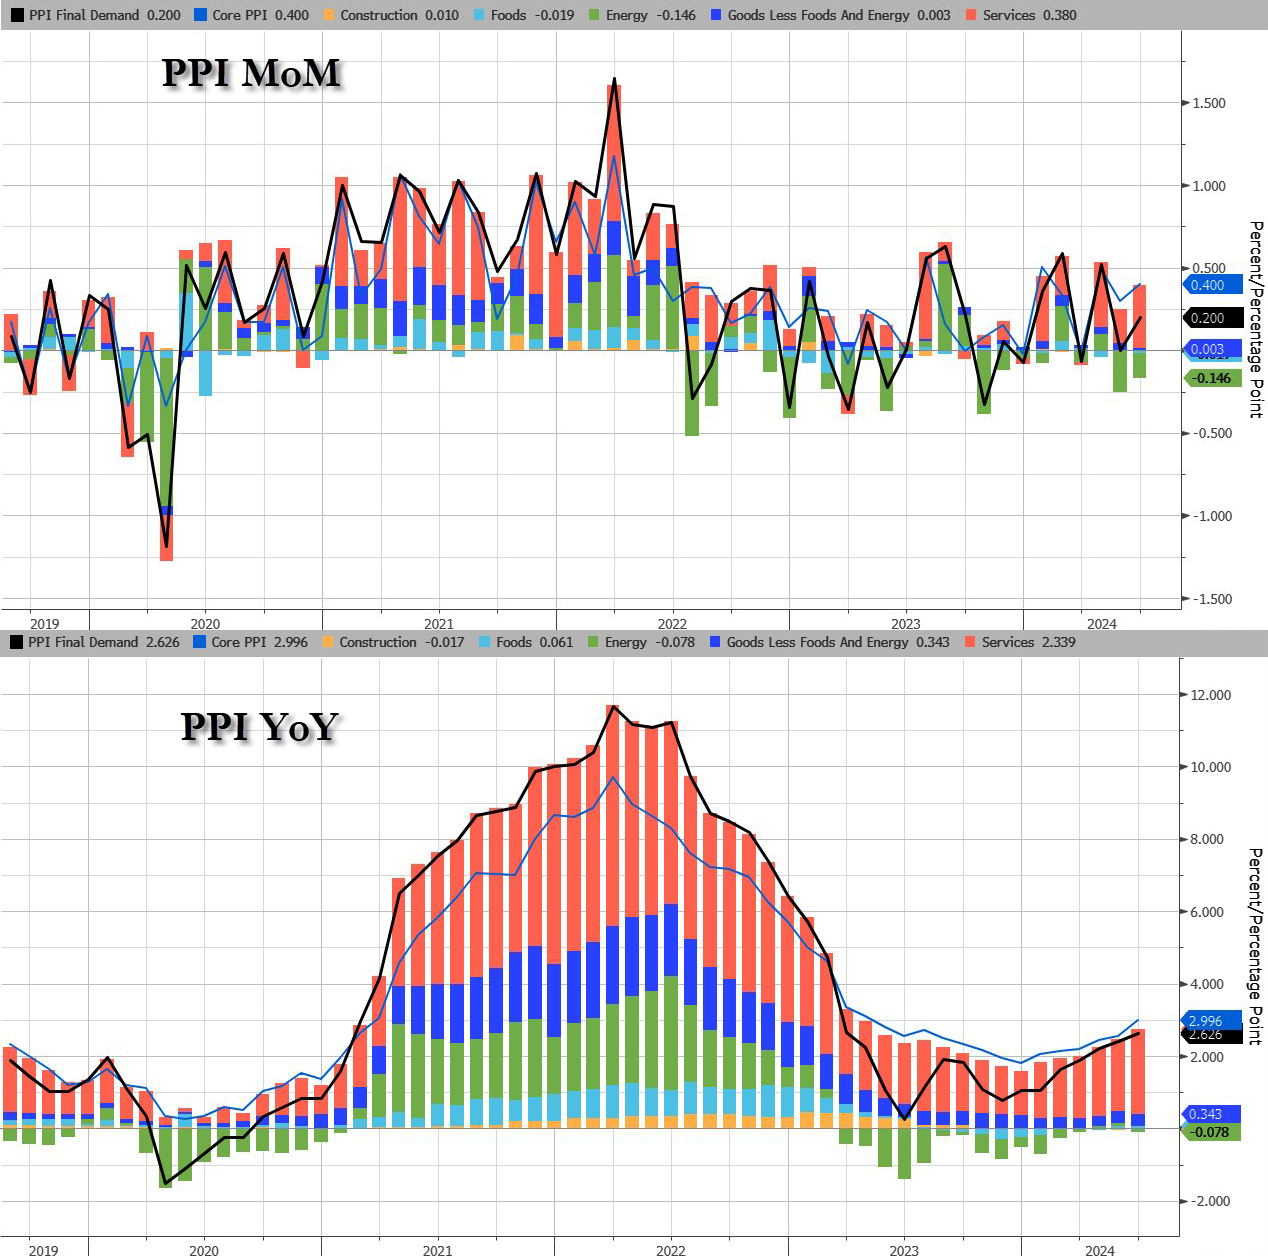
The jump in PPI was driven by a resurgence in Services costs as Energy remains deflationary (for now)…
Source: Bloomberg
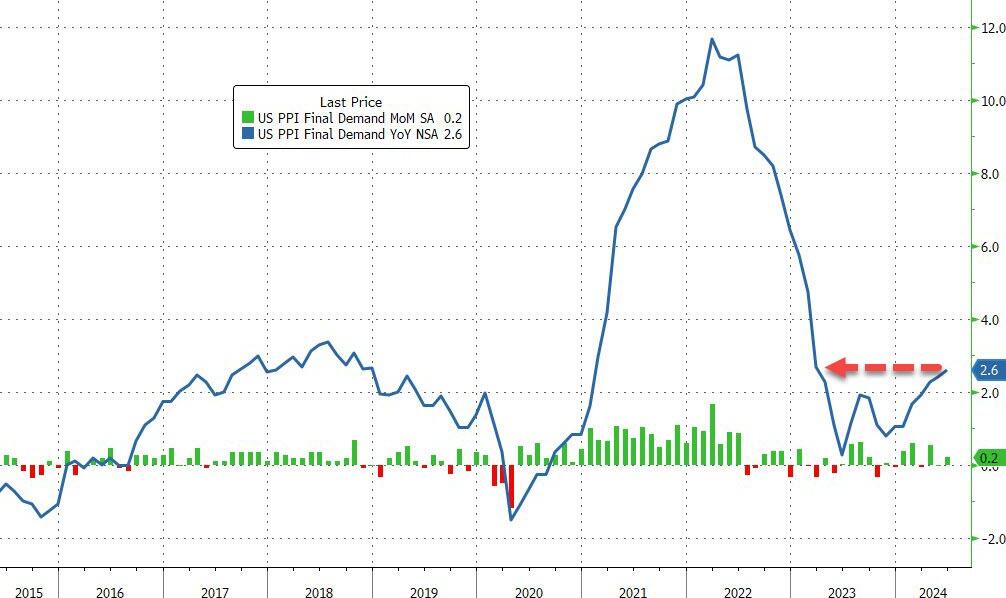
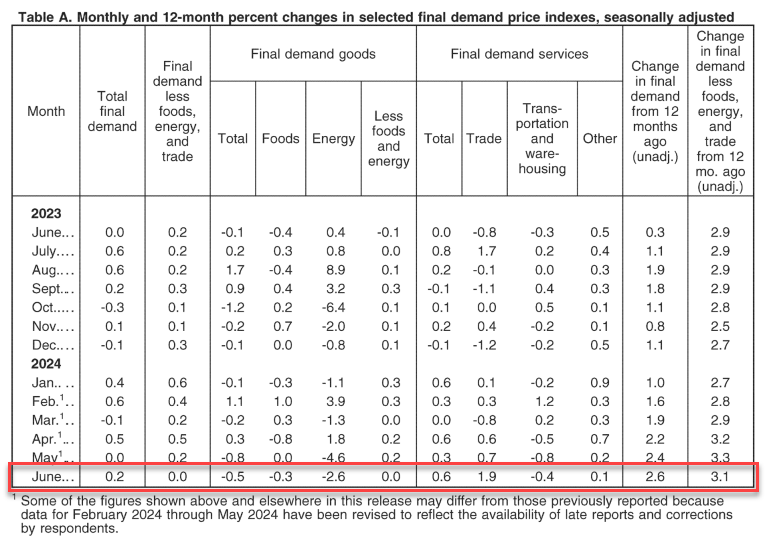
The June rise in the index for final demand can be traced to a 0.6-percent increase in prices for final demand services. In contrast, the index for final demand goods decreased 0.5 percent
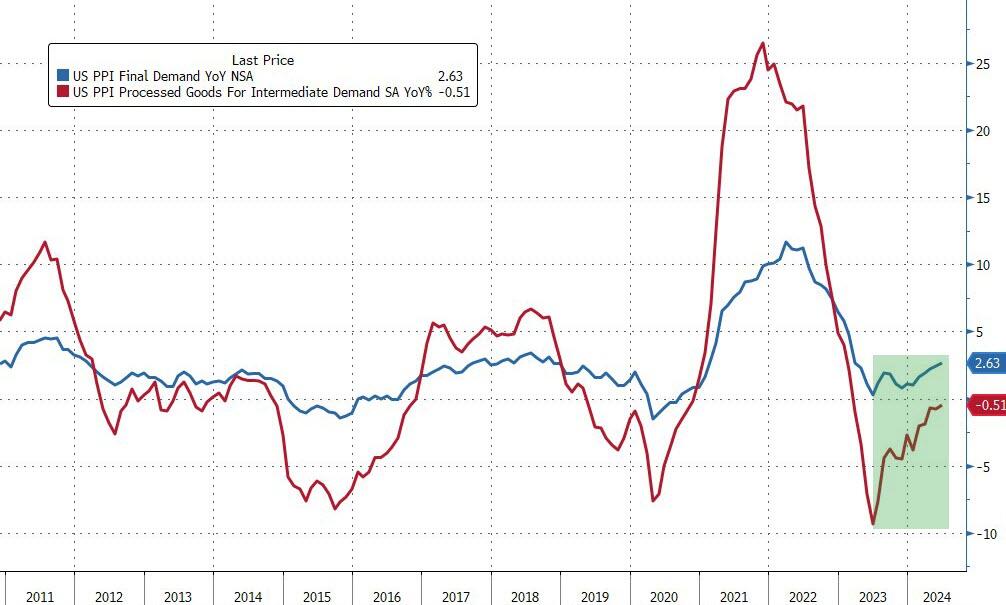
Perhaps worse still, the pipeline for PPI (intermediate demand) is accelerating…
Source: Bloomberg
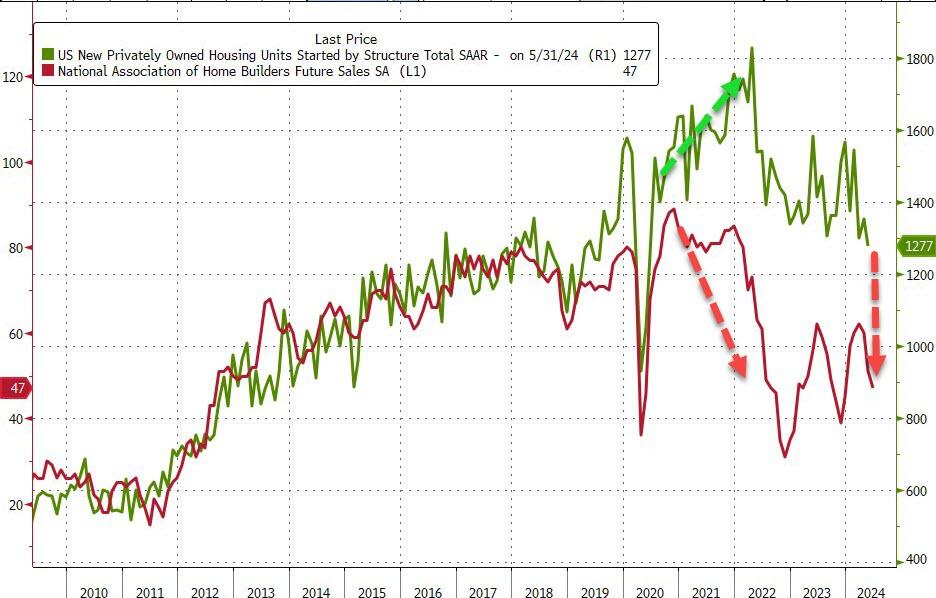
On the housing side, buying conditions for housing tanks to all-time low.
During the first three months of 2023, U.S. office vacancy topped 20 percent for the first time in decades. In San Francisco, Dallas, and Houston, vacancy rates are as high as 25 percent. These figures understate the severity of the crisis because they only cover spaces that are no longer leased. Most office leases were signed before the pandemic and have yet to come up for renewal. Actual office use points to a further decrease in demand. Attendance in the 10 largest business districts is still below 50 percent of its pre-COVID level, as white-collar employees spend an estimated 28 percent of their workdays at home.
A new report from Moody’s offers yet another grim outlook that the commercial real estate downturn is nowhere near the bottom. Elevated interest rates and persistent remote and hybrid working trends could result in around 24% of all office towers standing vacant within the next two years. The office tower apocalypse will result in more depressed values that will only pressure landlords.
“Combining these insights, with our more than 40 years of historic office performance data, as well as future employment projections, our model indicates that the impact on office demand from work from home will be around 14% on average across a 63- month period, resulting in vacancy rates that peak in early 2026 at approximately 24% nationally,” Moody’s analysts Todd Metcalfe, Anthony Spinelli, and Thomas LaSalvia wrote in the report.
In a separate report, Tom LaSalvia, Moody’s head of CRE economics, wrote that the office vacancy rate’s move from 19.8% in the first quarter of this year to the expected 24% by 2026 could reduce revenue for office landlords by between $8 billion and $10 billion. Factor in lower rents and higher costs, this may translate into “property value destruction” in the range of a quarter-trillion dollars.
In addition to remote working trends, Moody’s analysts pointed out that the amount of office space per worker has been in a “general downward trend for decades.”
At the peak of the Dot-Com boom, office workers used an average of 190 sq ft. The figure has since slid to 155 sq ft in 2023.
“The argument for maintaining or even increasing remote work practices remains compelling for many businesses,” the analysts said, adding, “If productivity remains stable and costs can be reduced by forgoing physical office spaces, the rationale for mandating in-office attendance diminishes.”
Related research from the McKinsey Global Institute forecasts that office property values will plummet by $800 billion to $1.3 trillion by the decade’s end.
Moody’s expects vacancy rates to top out as office towers are demolished or converted to residential ones in the coming years.
“Right-sizing will continue over the next decade as the market shakes out less efficient space for flexible floorplans that support our relatively new working habits,” they said.
Earlier this year, Goldman analyst Jan Hatzius pointed out that a further 50% price decline would make office tower conversions financially sensible.
…which, many believe, will also drag down inflation (and it has been)…
Source: Bloomberg
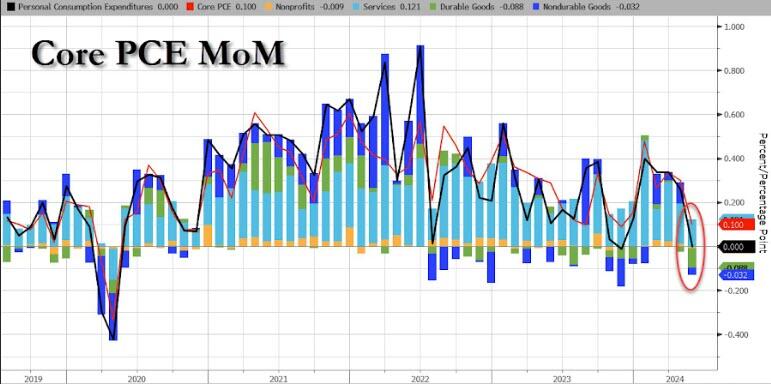
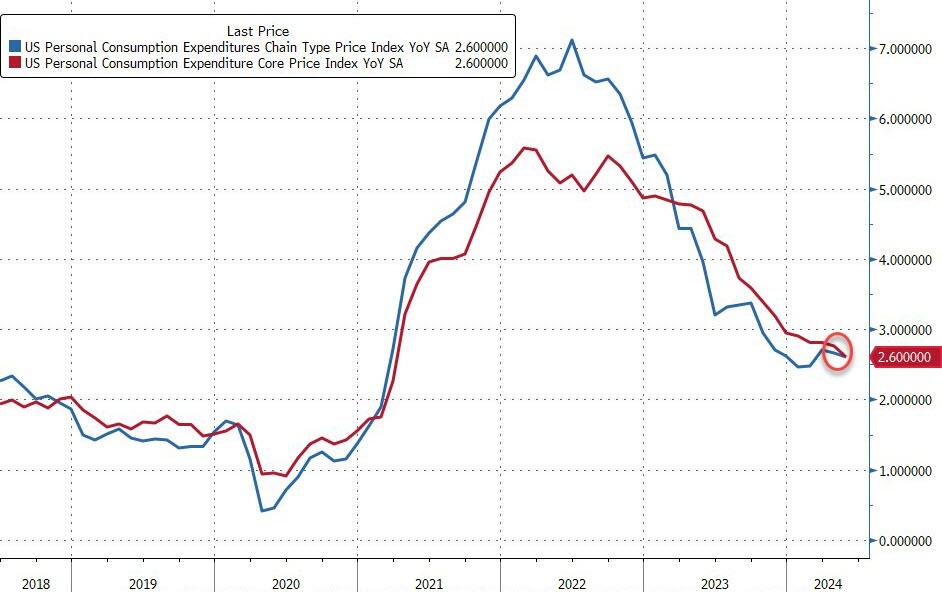
Today, we get to see The Fed’s favorite inflation indicator – Core PCE – which rose 0.1% MoM in May (after a revised +0.3% MoM for April) and in line with expectations. The headline PCE Price Index was unchanged MoM as expected as Durable Goods deflation trumped surging Services costs…
Source: Bloomberg
On a YoY basis, both headline and core PCE declined…
Source: Bloomberg
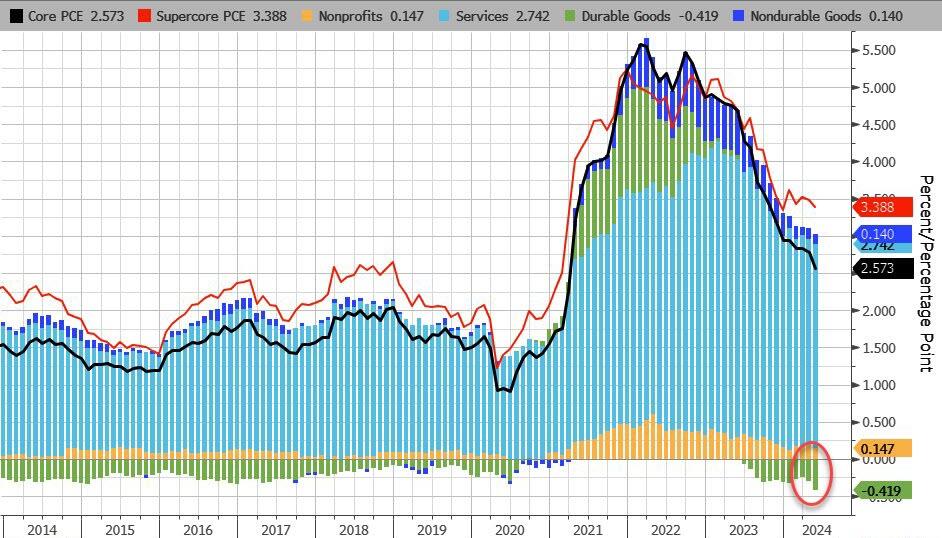
On a YoY basis, Durable Goods deflation is at its strongest in at least a decade…
Source: Bloomberg
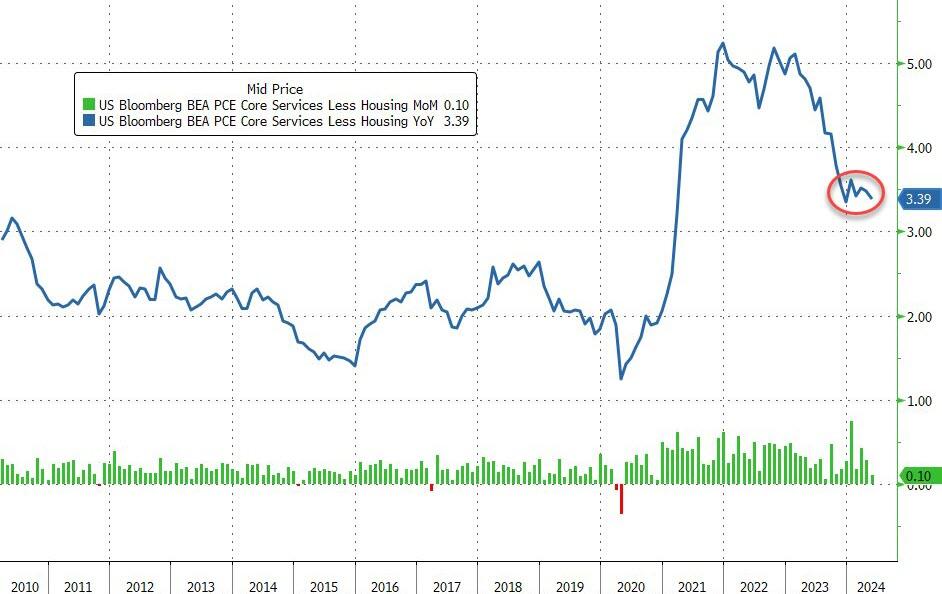
More notably, the so-called SuperCore PCE rose 0.1% MoM, which saw YoY slow to 3.39%… which is awkwardly stagnant at elevated levels…
Source: Bloomberg
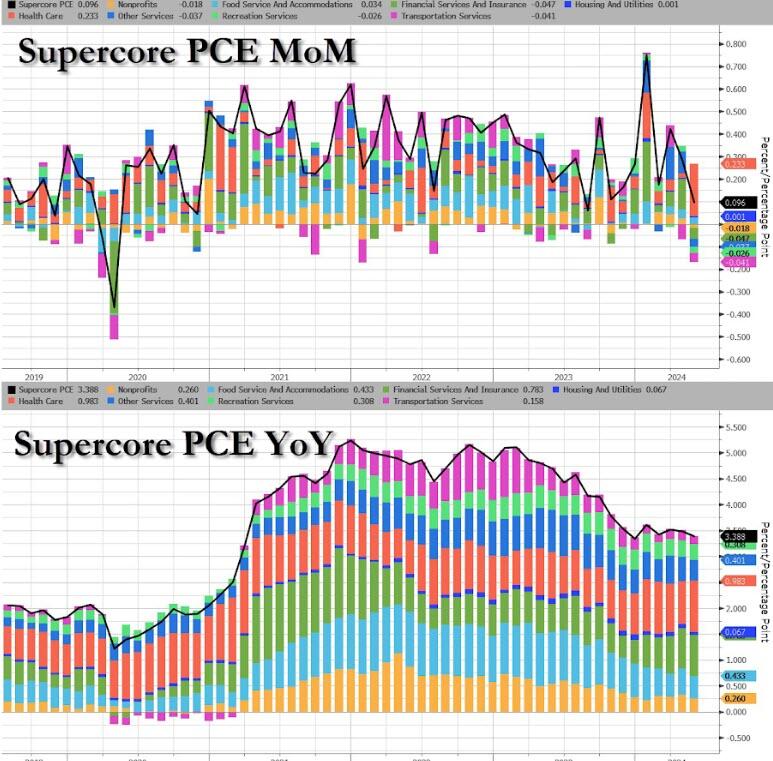
That is the 49th straight monthly rise in SuperCore prices with Healthcare costs soaring…
Source: Bloomberg
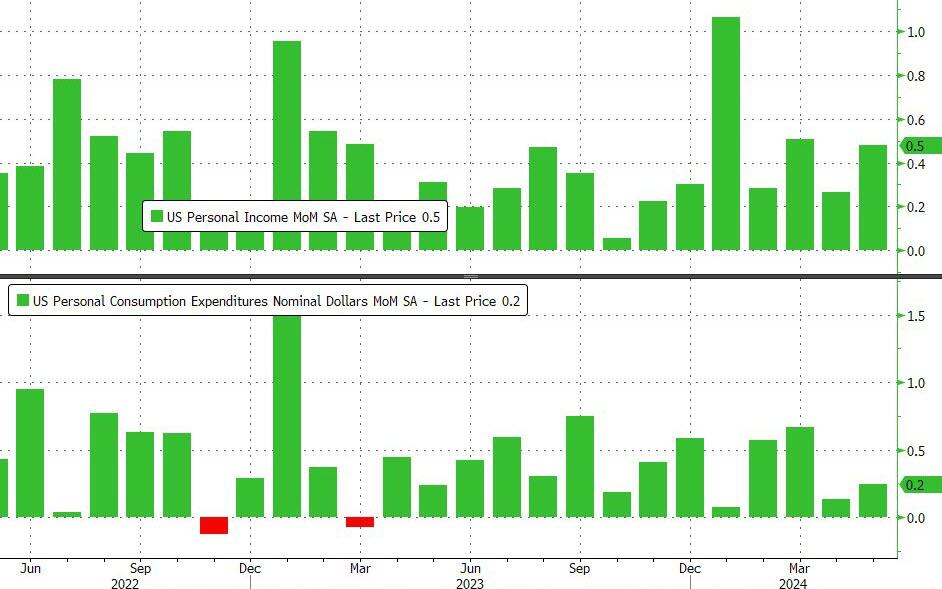
On a MoM basis, Income grew more than expected (+0.5% vs +0.2% exp) while spending rose less than expected (+0.2% MoM vs +0.3% exp)
Source: Bloomberg
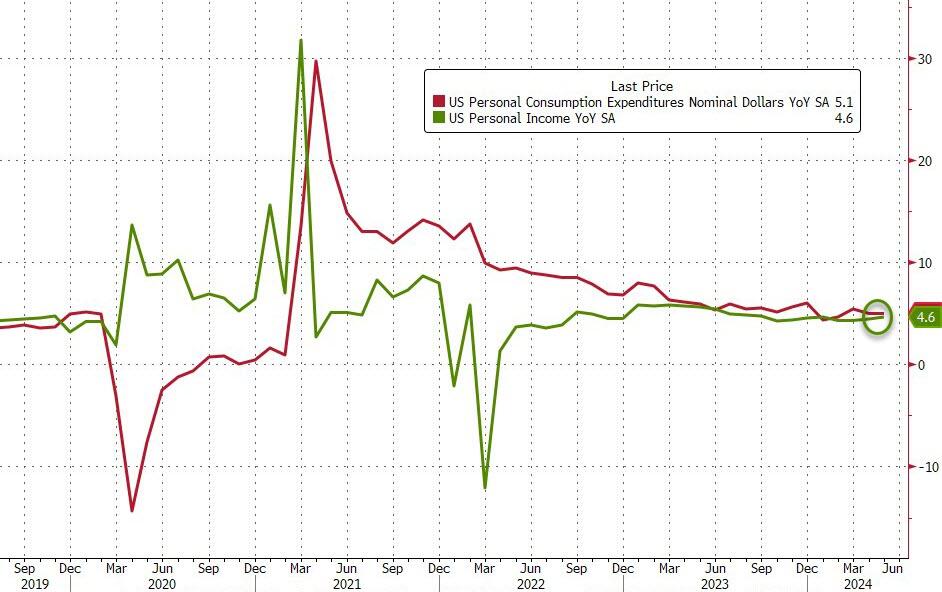
Which accelerated both income and spending on a YoY basis (with the latter outpacing the former, of course)…
Source: Bloomberg
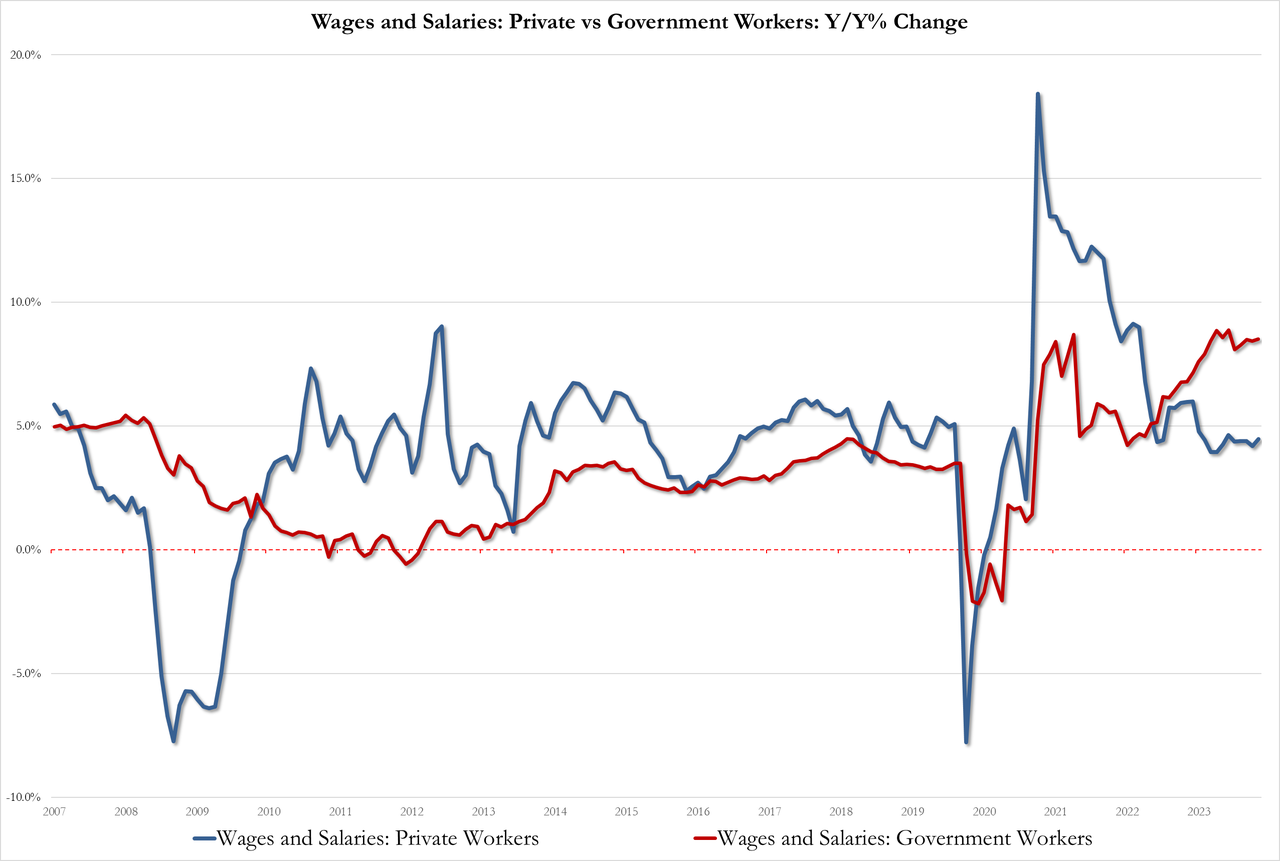
With wage pressures rising once again…
Government 8.5%, up from 8.4% but below the record high of 8.9%
Private 4.5% up from 4.2%
Source: Bloomberg
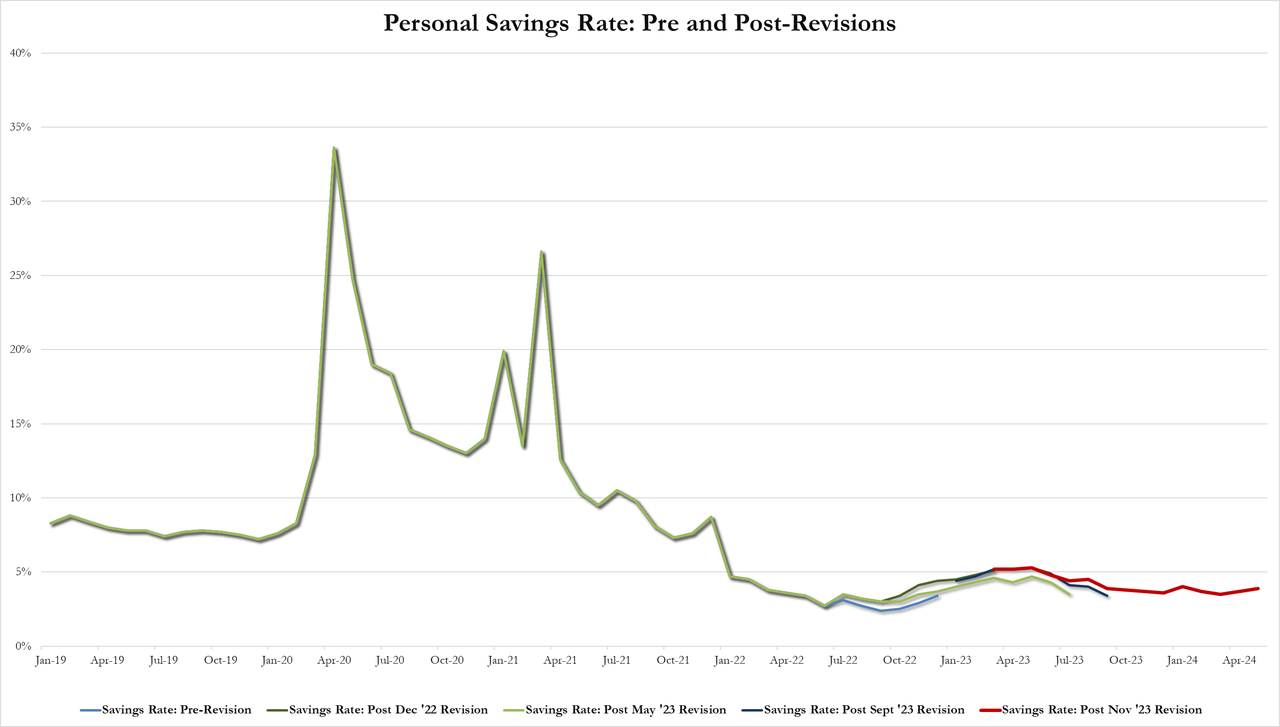
And after a series of revisions, the savings rate ticked up to 3.9% of DPI (from 3.7%) – the highest since January…
Source: Bloomberg
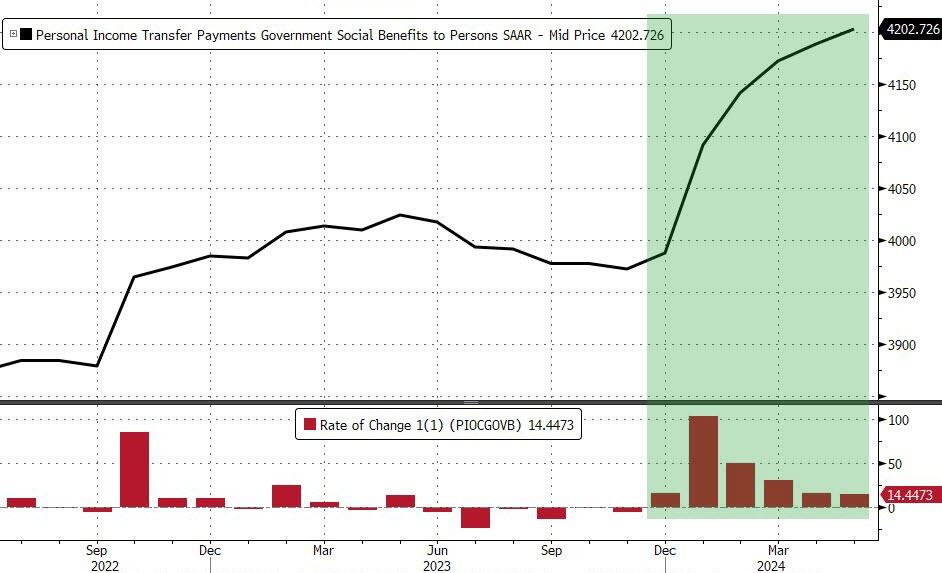
All of which takes place against a background of the sixth straight month of rising government handouts (well it is an election year after all)…
Source: Bloomberg
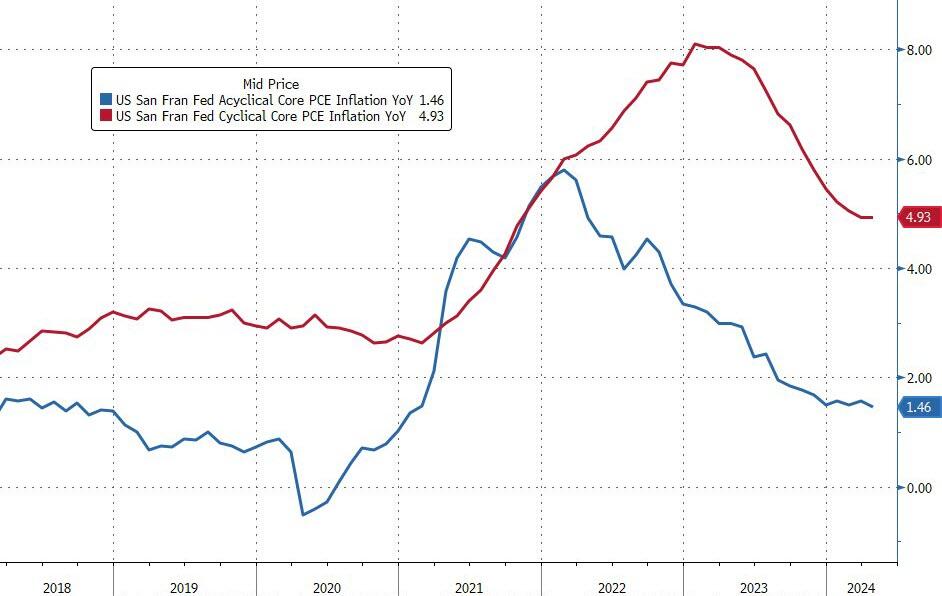
Finally, while acyclical inflationary pressures continue to drift lower, cyclical inflationary pressures remain extremely elevated…
Source: Bloomberg
A very mixed bag but nothing screams ‘automatic’ rate-cuts… and SuperCore refuses to budge.
The jointly signed letter, first reported by Axios, says the economic agenda of U.S. President Joe Biden, a Democrat, is “vastly superior” to Trump’s, the former Republican president seeking a second term.
Read the source article from Reuters for the rest of the Marxist clown show. What Joe Stiglitz and other Leftist economists are cheerleading in the excessive post Covid spending spree that Biden and Congress went on. There is a different between a free market system and government directed spending, usually on large donors.
One source of crippling inflation under Biden is (wasteful) government spending, up 37.7% under Biden. Federal debt is up a nauseating 50% under Biden. These levels of spending and debt are NOT sustainable!
Another souce of inflation under Biden has been The Federal Reserve. With Covid. The Fed entered like gangbusters dropping their target rate to 25 basis points and massively increasing their balance sheet. Call this BIDEN 1. Then to squelch inflation, The Fed raised their target rate and slowly started to unwind the balance sheet. We saw a slowing of inflation. Nothing to do with Biden, although I am sure he will take credit for it at Thursday’s debate with Trump.
Inflation was growing rapidly in Biden 1, but inflation started to slow (Biden 2) as The Fed rapidly raised their target rate.
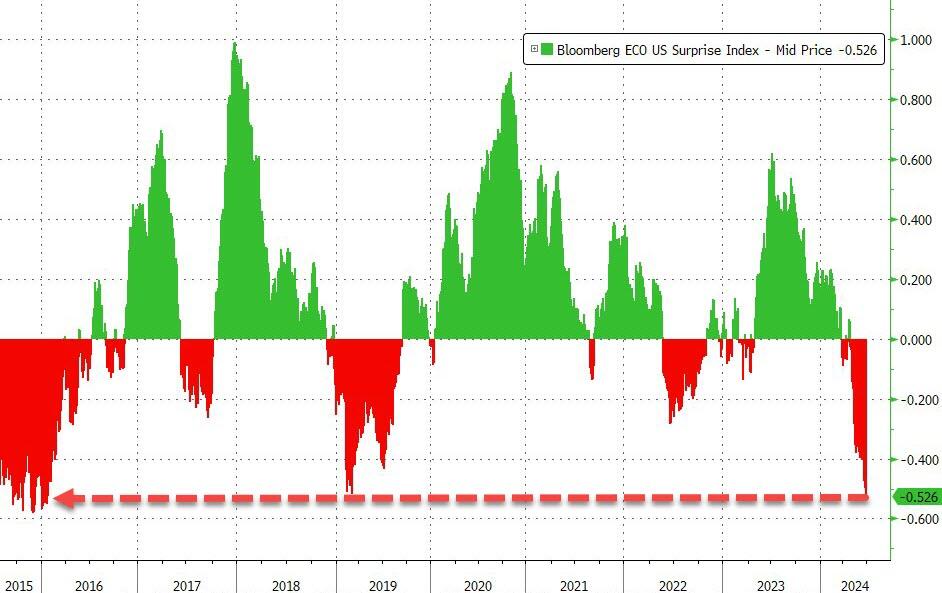
Well, perhaps bot a genuine surprise. We are aware that the US economy has been slowing as the massive fiscal and monetary stimulus from Covid is wearing out.
The economics surprise index slumped to -28.10, the lowest since 2022.
I feel like the US economy is experiening a Ragnarok change. With the giants (World Economic Forum/UN. etc) winning.
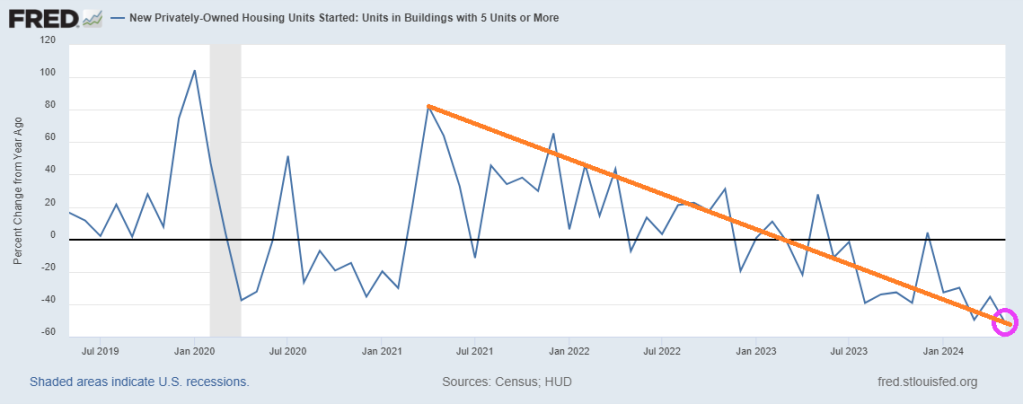
It begs the question: where are the 10+ million illegal immigrants living who have poured over the border under Binden/Mayorkas? Especially when 5+ units housing starts dropped -51.7% since last year (YoY) in May. And the trend under Biden looks terrible!
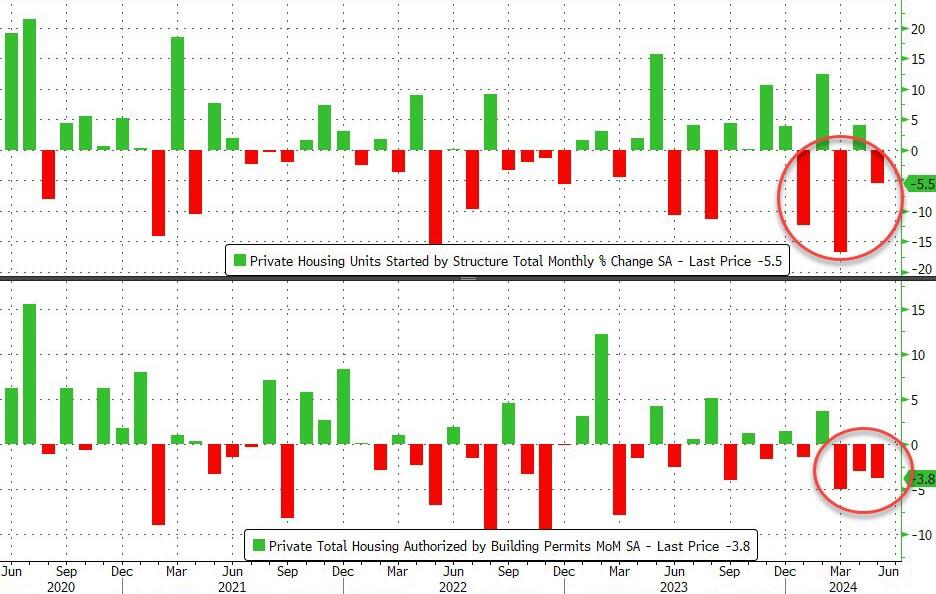
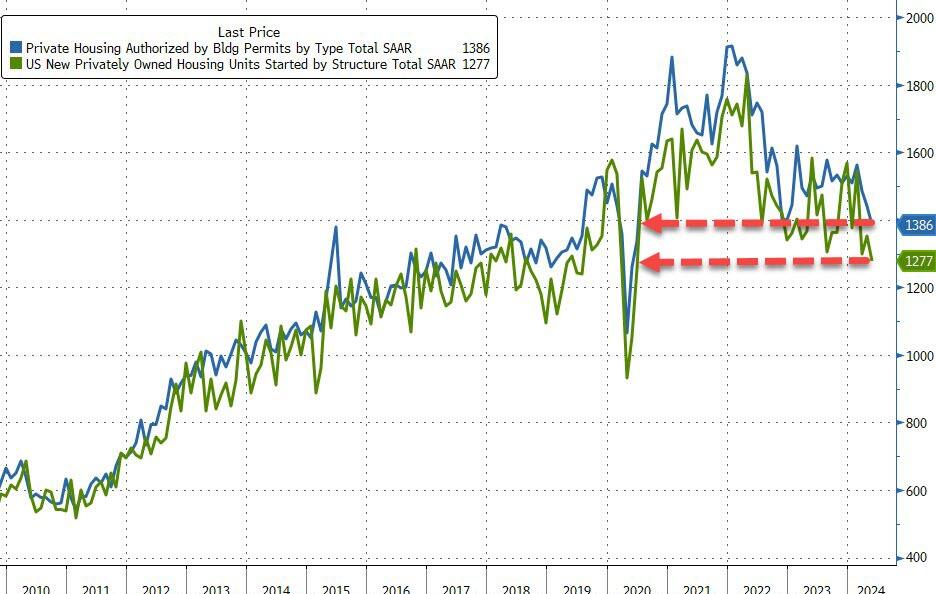
That was the third monthly drop in permits (more forward looking) in a row. Worse still, April Housing Starts were revised lower (from +5.7% to +4.1%), making this miss even worse.
This dragged the SAARs for starts and permits to their lowest since the trough of COVID…
Source: Bloomberg
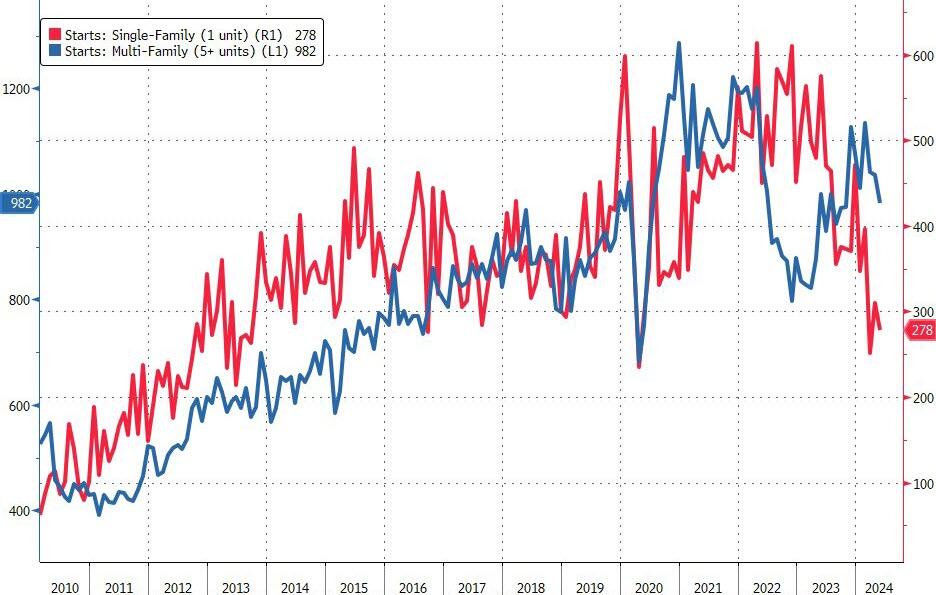
With Multifamily starts falling back near COVID lockdown lows…
Single-Family 982K SAAR, down 4.8% from 1,031K and the first sub-million print since October 2023
Multi-Family 278K, down 13.7% from 322K and the lowest since March’s 245K (which was the lowest print since covid crash)
Source: Bloomberg
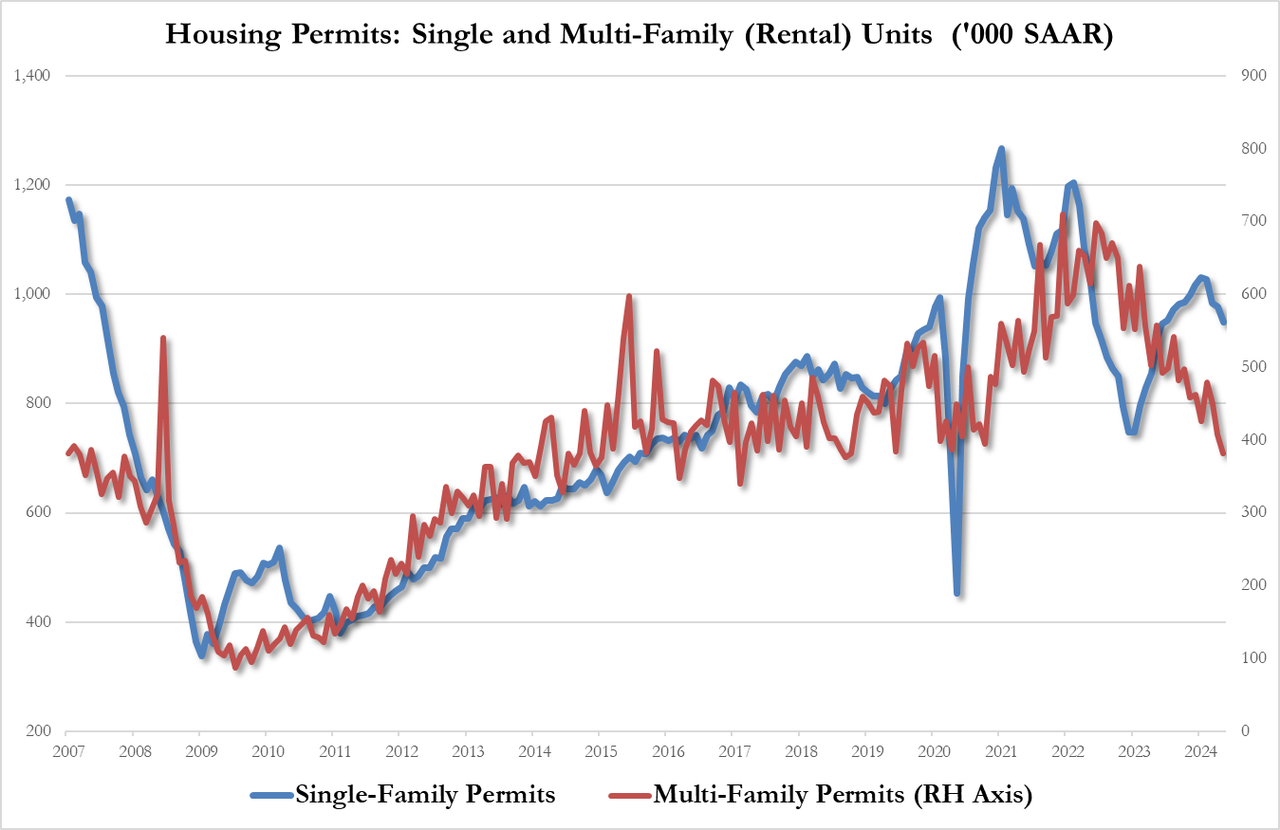
And multi-family permits cratering to their lowest since Oct 2018…
Single-Family permits 949K SAAR, down 2.9% from 977K
Multi-Family permits 382K SAAR, down 6.1% from 407K
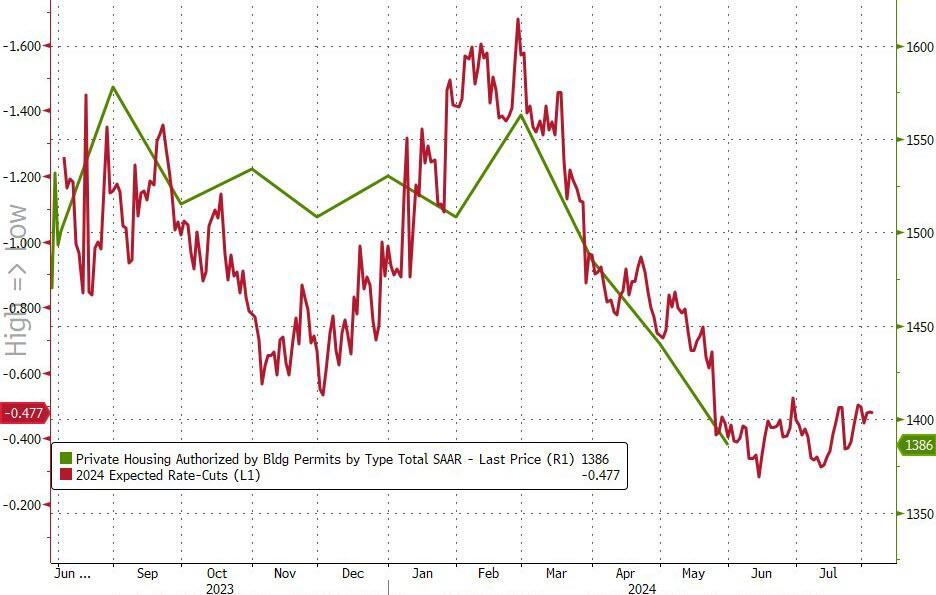
And with rate-cut expectations holding near their lows, there is no sign of recovery in home-building yet…
Source: Bloomberg
It seems reality is starting to set in for homebuilders…
Source: Bloomberg
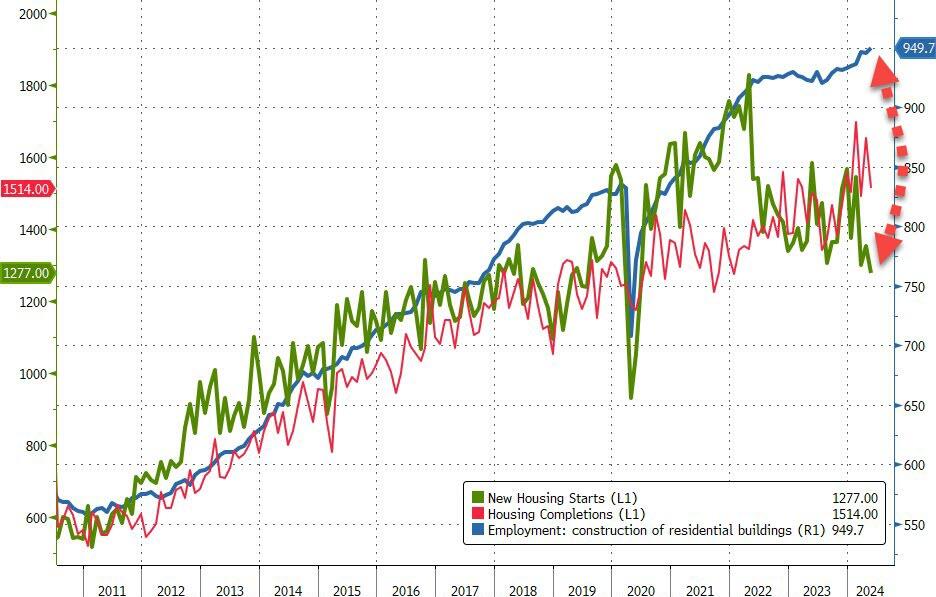
As housing starts plummet, jobs seem to keep growing to record highs…
Now you know why Joe Biden has fund raisers in Hollywood and New York where the elites (the top 1%) live. Biden is the President of The Elites, not the middle class.
How bad it is? The top 1% now have more household wealth than the entire middle class. Note that the recent surge occurred under Trump, but Biden is doing nothing about it.
Further evidence? 46% of households are struggling.
In terms of housing prices, home prices are growing FASTER than average hourly earnings. Again!
Politicians. You can’t trust ANY of them with our money. Or a cookout.
Here is New Yprk Senator Chuck Schumer posing as a middle class American cooking gray hamburgers at super low heat with cheese on top of raw meat. What a fraud!
This prediction only got warmer two months later when, inexplicably, Japan’s Norinchukin bank, best known as Japan’s CLO whale, was quietly added to the list of counterparties for the Fed’s Standing Repo Facility, a/k/a the Fed’s foreign bank bailout slush fund.
But if that was the first, and still distant, sign that something was very wrong at one of Japan’s biggest banks (Norinchukin is Japan’s 5th largest bank with $840 billion in assets) today the proverbial canary stepped on a neutron bomb inside the Japanese coalmine, because according to Nikkei, Norinchukin Bank “will sell more than 10 trillion yen ($63 billion) of its holdings of U.S. and European government bonds during the year ending March 2025 as it aims to stem its losses from bets on low-yield foreign bonds, a main cause of its deteriorating balance sheet, and lower the risks associated with holding foreign government bonds.”
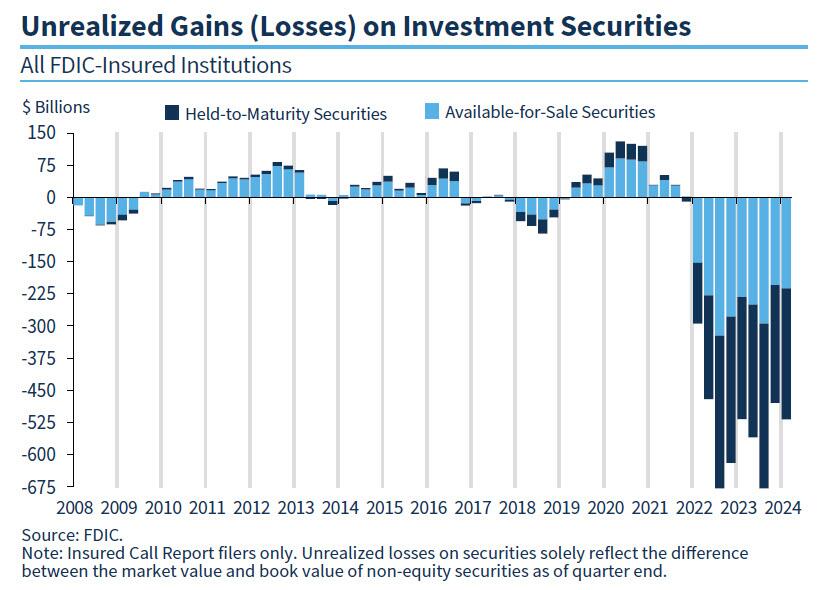
See, what’s happened in Japan is not that different from what is happening in the US, where as the FDIC keeps reminding us quarter after quarter, US banks are still sitting on over half a trillion dollars in unrealized losses, as a result of the huge jump in interest rates which has blown up the banks’ long-duration fixed income holdings, sending them trading far below par and forcing banks (and the Fed, see BTFP) to come up with creative ways of shoving these massive losses under the rug.
And while Japanese rates have barely budged – the BOJ only just raised rates for the first time in decades in April – the move is already cascading into the form of huge losses for domestic banks, which have been hammered twice as hard due to their holdings of offshore debt which until 2021 was viewed as risk free, only to blow up in everyone’s face two years ago when the bull market since the early 1980s ended with a bang.
Enter Norinchukin: according to the Nikkei, the company’s net loss for the year ending March 2025, which was previously forecast to top 500 billion yen, will rise to the 1.5 trillion yen level with the bond sales.
“We plan to sell low-yield [foreign] bonds in the amount of 10 trillion yen or more,” Norinchukin Bank CEO Kazuto Oku told Nikkei, an amount just above $60 billion.
Facing a problem that is very familiar to all US banks, Oku said the bank “acknowledged the need to drastically change its portfolio management” to reduce unrealized losses on its bonds, which totaled roughly 2.2 trillion yen as of the end of March. Oku explained bank’s intention to shift its investments, saying, “We will reduce [sovereign] interest rate risk and diversify into assets that take on corporate and individual credit risk.”
Now, if Nochu, as it is affectionately known by bankruptcy lawyers, was a US bank circa one year ago, it would not have to sell anything: it could just pledge all of its sharply depreciated bonds at the Fed’s BTFP facility, and get a par value for them.
Unfortunately, Nochu is not US but Japanese, and it is not 2023 but rather 2024, when the high-rate disaster of 2023 was supposed to be over. Supposed to be… but instead it’s only getting worse. Regular readers will hardly need it, but for novices Nikkei gives the following quick primer: “Interest rates in the U.S. and Europe have risen and bond prices are down. This reduced the value of high-priced (low-yielding) foreign bonds that Norinchukin purchased in the past, causing its paper losses to swell.”
So faced with no other options, Nochu is doing the only thing it can: an orderly liquidation of tens of billions of securities now, when they are still liquid and carry a high price, in hopes of avoiding a disorderly liquidation and much worse, in a few months when the bond market freezes up.
And yes, the Japanese rates canary is quite, quite massive: as of the end of March, Norinchukin had approximately 23 trillion yen of foreign bonds (about $150 billion), amounting to 42% of its total 56 trillion yen of assets under management.
To get some sense of the scale, according to the Bank of Japan, outstanding foreign bonds held by depositary financial institutions amounted to 117 trillion yen as of the end of March. Norinchukin, which is a major institutional investor in Japan, holds as much as 20% of the total on its own! And those asking, yes: once Nochu begins selling, all others will have to join the club!
But why start the selling now? Because, as we warned last October when we predicted that the next bank crisis will be in Japan, the Japanese mega-bank now believes interest rate cuts in the U.S. and Europe are likely to take longer than it previously expected, it will try to significantly cut its unrealized losses by selling foreign bonds in fiscal 2024.
And so, Norinchukin plans to sell over 10 trillion yen in foreign bonds, in addition to its normal trading activities.
The rest of the story is filler: in attempt to divert attention from the 10 trillion yen elephant in the room, the Nikkei then wastes time discussing the bank’s other “alternatives” to wit:
The company is now considering investment alternatives, including equities, corporate bonds, corporate loans and private equity, as well as securitized products such as corporate loan-backed securities and mortgage-backed securities. By diversifying its portfolio, it aims to prevent unrealized losses from expanding to the point where they become a concern for management. It will also try to replace some low-yielding foreign government debt with other such bonds offering higher interest rates.
What are you talking about? What diversification? Once the selling begins, the bank will be lucky if it can get even a fraction of the proceeds it hopes for (because all the other banks won’t just be standing there twiddling their thumbs, as they wait to see how massively Nochu reprices the market).
And it’s not just banks: if and when the selling begins by a bank that holds 20% of all foreign bonds in Japan, the liquidation cascade will quickly spread to Mrs Watanabe. According to the U.S. Treasury Department, Japanese investors held $1.18 trillion of U.S. government bonds as of March, the largest slice among foreign holders.
Needless to say, but the Nikkei does so anyway, “Massive sales by Norinchukin could have a sizable effect on the U.S. bond market.”
And since we now know what is happening, it is only a matter of time before everyone else frontruns Norinchukin.
What happens next will be even uglier: since the bank will no longer be able to mask its fixed income losses under the guise of accounting sleight of hand, the bank’s financial results for the period ending March 2025 will “deteriorate significantly as a result of the huge divestment of foreign bonds and turn paper losses into real ones.” As of May, Norinchukin put its final loss at more than 500 billion yen, but this is now expected to reach the 1.5 trillion yen level.
A little more context: back in the immediate aftermath of the global financial crisis, in the year ending March 2009, Norinchukin posted a final loss of about 570 billion yen due to impairment of securitized products. The forecast loss for this fiscal year is expected to top the previous record by roughly 1 trillion yen. Nevertheless, Oku said that putting the losses on the books in the year ending next March will “improve [the bank’s] finances and portfolio, thus enabling to move into the black in the period ending March 2026.”
Spoiler alert: no it won’t… and that’s why the bank is now scrambling to share the pain with even greater fools, i.e., “investors.”
According to the Nikkei, Norinchukin Bank is considering raising 1.2 trillion yen to shore up its finances. It has already started discussions with Japan Agriculture Cooperatives, one of its main investors, and others. Of course, the question of who in their right mind would lend the bank good money to plug an even bigger hole that is about to open up, is anyone’s guess.
But that won’t stop the bank from doing what it has to, now that it has picked the liquidation route: and once the selling flood begins, it won’t end as these flashing red headlines from Bloomberg just confirmed:
*NORINCHUKIN TO SELL US, EUROPEAN SOVEREIGN BONDS GRADUALLY
*NORINCHUKIN ALSO WEIGHS LOCAL, OVERSEAS BONDS, PROJECT FINANCE
*NORINCHUKIN EYES ASSETS INCLUDING CLOS, STOCKS AFTER BOND LOSS
There’s a name for this: a firesale, but – drumroll – a “gradual” one, because that’s how firesales supposedly go in Japan.
Luckily, the one thing nobody has to guess, is what happens next: as the wonderful movie Margin Call laid out so very well, once you realize that the music has stopped, you have three choices: i) be first, ii) be smarter, or iii) cheat. In the case of Japan’s Norinchukin, it has decided the time has come to liquidate before everyone else. We wonder how “everyone else” will take this particular news…


You must be logged in to post a comment.